SCIENTIFIC REPORT - europa.eu
←
→
Page content transcription
If your browser does not render page correctly, please read the page content below
SCIENTIFIC REPORT

APPROVED: 23 June 2021

Annual Report on surveillance for avian influenza in poultry
 and wild birds in Member States of the European Union in
                           2020
                             European Food Safety Authority (EFSA),
           Inma Aznar, Francesca Baldinelli, Alexandra Papanikolaou, Anca Stoicescu and
                                       Yves Van der Stede

Abstract
In 2020, Council Directive 2005/94/EC required EU Member States (MSs) to carry out surveillance for
avian influenza (AI) in poultry and wild birds and notify the results to the responsible authority. Based
on this, MSs, Iceland, Norway, Switzerland and the United Kingdom implemented ongoing surveillance
programmes to monitor incursions of AI viruses in poultry and wild birds. EFSA received a mandate
from the European Commission to collate, validate, analyse and summarise the data resulting from the
avian influenza surveillance programmes in an annual report. This is the second such report produced
using data directly submitted to EFSA by MSs. This report summarises the results of the surveillance
activities carried out in poultry and wild birds in 2020. Overall, 24,768 poultry establishments (PEs)
were sampled, of which 46 were seropositive for H5 virus strains and seven for H7 strains.
Seropositive PEs were found in nine MSs (Belgium, Denmark, Finland, France, Italy, the Netherlands,
Poland, Spain and Sweden) and the United Kingdom. As per previous years, the highest percentages
of seropositive PEs were found in establishments raising waterfowl game birds and breeding geese.
Out of the 53 PEs with positive serological tests for H5/H7, seven tested positive in polymerase chain
reaction (PCR) or virology for H5/H7 virus strains: six for Low Pathogenic Avian Influenza (LPAI) and
one for Highly Pathogenic Avian Influenza (HPAI). In addition, 13 countries also reported PCR results
from 748 PEs which did not correspond to the follow-up testing of a positive serology event (e.g. in
some PEs, PCR tests were used for screening). Twenty-five of these PEs were found positive for AI
viral RNA. These positive PEs were located in Bulgaria, Estonia, Germany, Romania and Slovakia. A
total of 18,968 wild birds were sampled, with 878 birds testing positive to HPAI virus. Fourteen
countries reported HPAI-positive wild birds, with all HPAI strains identified as H5. Most positive birds
were infected with H5N8, with a smaller number of N1, N3, N5 and unidentified NA subtypes. In
addition, there were 317 birds testing positive for LPAI H5 or H7 virus and 429 birds testing positive
for non-H5/H7 AI virus, reported by 31 countries. The surveillance findings for poultry and wild birds
for 2020 are discussed in relation to the current knowledge of the epidemiology of AI in Europe, in
particular the H5N8 epidemic which has been identified late 2020.
© 2021 European Food Safety Authority. EFSA Journal published by John Wiley and Sons Ltd on behalf
of European Food Safety Authority.

Keywords: Avian Influenza, HPAI, LPAI, surveillance, poultry, wild birds

Requestor: European Commission
Question number: EFSA-Q-2021-00340
Correspondence: ALPHA@efsa.europa.eu

www.efsa.europa.eu/efsajournal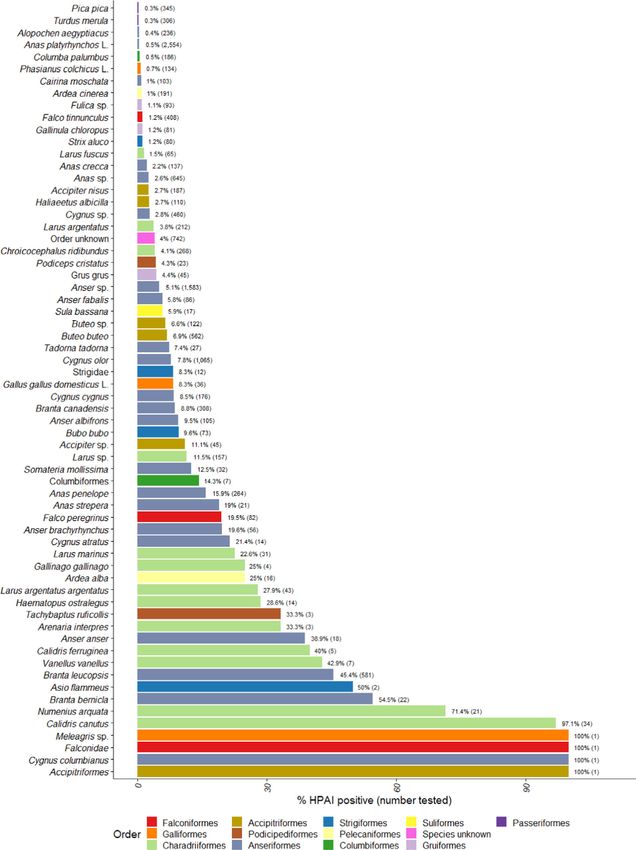
Avian influenza surveillance in 2020

Declarations of interest: The declarations of interest of all scientific experts active in EFSA’s work
are available at https://ess.efsa.europa.eu/doi/doiweb/doisearch.
Acknowledgements: EFSA wishes to thank the following for the support provided to this scientific
output: AUSVET, Member State representatives and Verena Oswaldi. EFSA also wishes to thank the
AHAW Panel of Experts for endorsing this report.
Suggested citation: EFSA (European Food Safety Authority), Aznar I, Baldinelli F, Papanikolaou A,
Stoicescu A and Van der Stede Y, 2021. Annual Report on surveillance for avian influenza in poultry
and wild birds in Member States of the European Union in 2020.
ISSN: 1831-4732
© 2021 European Food Safety Authority. EFSA Journal published by John Wiley and Sons Ltd on behalf
of European Food Safety Authority.
This is an open access article under the terms of the Creative Commons Attribution-NoDerivs License,
which permits use and distribution in any medium, provided the original work is properly cited and no
modifications or adaptations are made.

                                 The EFSA Journal is a publication of the European Food Safety
                                 Authority, a European agency funded by the European Union.

www.efsa.europa.eu/efsajournal                             2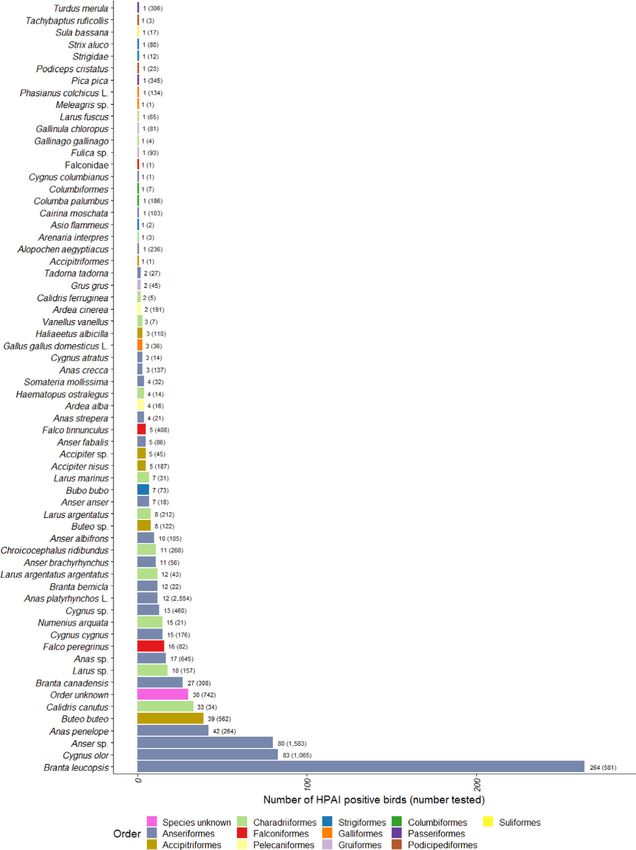
Avian influenza surveillance in 2020

Table of contents

 Abstract...................................................................................................................................................    1
 1.         Summary..................................................................................................................................           4
 1.1.       Serological surveys in poultry .....................................................................................................                4
 1.2.       Surveillance in wild birds............................................................................................................              5
 2.         Introduction..............................................................................................................................          6
 2.1.       Background and Terms of Reference...........................................................................................                        6
 3.         Results .....................................................................................................................................       7
 3.1.       Poultry......................................................................................................................................       7
 3.1.1.     Number of poultry establishments sampled .................................................................................                          7
 3.1.2.     Timing of sampling in poultry .....................................................................................................                 9
 3.1.3.     Avian influenza in poultry ...........................................................................................................              11
 3.1.3.1. Serological results overview .......................................................................................................                 11
 3.1.3.2. Serological results by reporting countries ....................................................................................                      11
 3.1.3.3. Serological results by administrative units....................................................................................                      12
 3.1.3.4. Serological results by month ......................................................................................................                  13
 3.1.3.5. Serological results by poultry category ........................................................................................                     15
 3.1.3.6. Serological results: summary ......................................................................................................                  17
 3.1.3.7. PCR and virological results .........................................................................................................                17
 3.2.       Wild birds .................................................................................................................................       18
 3.2.1.     Number of birds sampled...........................................................................................................                 18
 3.2.2.     Timing of sampling in wild birds .................................................................................................                 19
 3.2.3.     Species distribution in wild birds .................................................................................................               20
 3.2.4.     Avian influenza in wild birds .......................................................................................................               22
 3.2.4.1. Detection of avian influenza virus in samples ...............................................................................                         22
 3.2.4.2. High pathogenic avian influenza in wild birds...............................................................................                          24
 3.2.4.2.1. HPAI results by neuraminidase type............................................................................................                     24
 3.2.4.2.2. HPAI results by species..............................................................................................................              24
 3.2.4.2.3. HPAI results by type of surveillance ............................................................................................                  27
 3.2.4.2.4. HPAI results in time...................................................................................................................            27
 3.2.4.3. Low pathogenic avian influenza in wild birds ...............................................................................                          28
 3.3.       Abundance and distribution of wild birds in Europe ......................................................................                          30
 4.         Discussion and conclusions ........................................................................................................                31
 4.1.       Poultry......................................................................................................................................      31
 4.2.       Wild birds .................................................................................................................................       32
 5.         Methods ...................................................................................................................................        33
 5.1.       Framework for reporting ............................................................................................................               33
 5.2.       Survey design ...........................................................................................................................          33
 5.2.1.     Poultry......................................................................................................................................      33
 5.2.2.     Wild birds .................................................................................................................................       34
 5.3.       Sampling procedures and laboratory testing ................................................................................                        34
 5.4.       Data and data processing ..........................................................................................................                34
 5.5.       Uncertainty ...............................................................................................................................        35
 References...............................................................................................................................................     35
 Abbreviations ...........................................................................................................................................     35
 Appendix A – Comparison of detailed poultry establishment categories with previous reporting categories ......                                                36
 Appendix B – Serological results by poultry species .....................................................................................                     41
 Appendix C – Total number of wild birds of the different orders sampled by passive and active surveillance ....                                               42
 Appendix D – Scientific and common names of wild bird species..................................................................                                43
 Appendix E – EFSA list of target wild bird species for avian influenza surveillance..........................................                                  49
 Appendix F – Wild bird observations by voluntary contributors .....................................................................                           51
 Appendix G – Wild bird species detected with HPAI virus in passive surveillance............................................                                   53
 Appendix H – Wild bird species detected with HPAI virus in active surveillance..............................................                                  55
 Appendix I – Country data sets .................................................................................................................              57

www.efsa.europa.eu/efsajournal                                                  3
Avian influenza surveillance in 2020

1.          Summary
    The European Union’s Member States (MSs), Iceland, Norway, Switzerland and the United Kingdom
(together referred to as reporting countries, RCs) implement surveillance programmes to detect
incursions of avian influenza viruses (AIVs) in poultry and wild birds, particularly migratory wild birds,
which are considered the main source of introduction of AIVs to poultry. The present report
summarises the results of the EU co-funded surveillance activities conducted in 2020, which consisted
of:
     •   Serological surveys to monitor the circulation of AIV subtypes H5 and H7 in poultry (active
         surveillance).
     •   Passive surveillance aiming at the virological detection of AI in wild birds found dead or
         moribund.
   In addition, some MSs also reported the results of active surveillance performed by testing live and
hunted birds. AI surveillance in some RCs is based on targeted sampling. Therefore, comparisons of
seropositivity rates between different groups presented in this report relate to the specific observations
recorded (surveillance samples) only. They cannot be extrapolated to the source populations because
sampling was targeted at higher risk groups and the targeting approach may be different between
countries, between groups and between years. Risk-based surveillance is designed for early detection
and should not be used to measure changes in disease prevalence or incidence.

1.1.        Serological surveys in poultry
    A total of 31 reporting countries (RCs) reported data on sampling and AI testing in poultry
establishments (PEs). In some RCs, establishments were sampled several times throughout the year.
For the purpose of this report, each sampling exercise taking place on a specific date and targeting a
different poultry category was considered as an independent event and counted as one PE sampled.
Therefore, the numbers reported in this report as PEs sampled should be interpreted as the number of
sampling events taking place in an RC for each of the reported categories.
    Figures on the size of the poultry population under surveillance in the RCs were not available at the
time of writing of the present report. In 2020, a total of 24,767 PEs were sampled, roughly the same
number of PEs as the previous year. The total number of PEs sampled and reported in each RC ranged
from 28 in Malta to 5,035 in Italy.
    Sixteen poultry categories have been used to report surveillance results in the present document.
None of them were sampled by all RCs. However, laying hen (conventional and free-range), fattening
turkey, breeding chicken and gallinaceous game bird establishments were sampled by at least 20 RCs
each. Growers and breeding geese were targeted by only few countries. In terms of the number of
PEs sampled, backyard flocks were the most sampled category (n = 4,740), followed by conventional
and free-range laying hens (n = 4,404 and 3,487, respectively).
    A total of 53 PEs (0.21%) were seropositive to either H5 or H7 (hereafter ‘H5/H7’), including 46 H5
and 7 H7. The H5/H7 seropositivity rate was around half of that observed in 2019 (0.45%). Ten
countries reported H5 seropositive PEs: Belgium, Denmark, Finland, France, Italy, the Netherlands,
Poland, Spain, Sweden and the United Kingdom. Spain also reported H7 seropositive PEs.
    Most H5/H7 detections (45 PEs out of 53) occurred in countries, which sampled a number of PEs
larger than the median number of PEs sampled. The 2020 results confirm an overall decreasing trend
in the proportion of H5/H7 seropositive establishments noted since the 2016 H5 outbreaks (with the
significant exception of 2019). The number of H5 seropositive PEs detected remained higher than H7
detections, as per previous years.
    As observed in previous years, waterfowl game birds and breeding geese were the categories with
the highest proportion of H5/H7 seropositive establishments (9.5% and 3.3%, respectively). The
proportion of H5/H7 seropositive PEs was 1.8% in breeding duck establishments and below 1% in all
other poultry categories. No positive PE were found in the following categories: conventional laying
hens, turkeys (fattening and breeding), broilers (heightened risk) and breeding chickens. While
backyard establishments and conventional laying hens had the largest numbers tested, one
seropositive PE only was identified in the former category, and none in the latter. Ten of the H5/H7
seropositive PEs were identified in June in Spain, among waterfowl game birds, associated with a
larger sampling effort in this category at the end of the hunting season. December was the month
with the second highest seropositivity rate and did not appear to be associated with a particular
category or country.

www.efsa.europa.eu/efsajournal                      4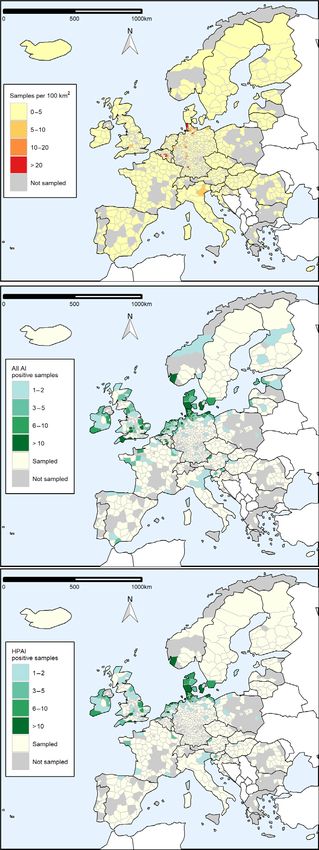
Avian influenza surveillance in 2020

    Serological results for AI subtypes other than H5 and H7 were also reported for some PEs.
However, due to the non-mandatory reporting, the results presented in this report do not represent
the complete picture of the distribution of these subtypes in reporting countries. In addition, 13
countries also reported PCR results from 748 PEs carried out either as a screening test or subsequent
to a negative serological test result. Twenty-five of these PEs were found positive for H5 AI viral RNA
(Bulgaria, Germany, Romania and Slovakia) or non-H5/H7 AI viral RNA (Estonia).
    In Commission Delegated Regulation (EU) 2020/6891, MSs are required from April 2021 to carry
out complementary risk-based surveillance aiming to detect clusters of establishments (in time and
geographical proximity) infected with LPAI viruses. The poultry categories in which this surveillance is
recommended to be carried out include, among others, the categories where most of the serological
positive results were found in 2020. In order to better understand the data resulting from this
complementary surveillance (and poultry surveillance in general), RCs are encouraged to report the
link between seropositive establishments, and the results of further follow-up sampling and/or testing
carried out in the same or surrounding establishments. Finally, understanding the underlying poultry
population will help to better understand the efficiency of the surveillance carried out at a European
level. The estimated poultry population could be submitted to EFSA in an aggregated form (by poultry
category and NUTS3 level) as a once-off exercise, with updates reported by RC when available.

1.2.         Surveillance in wild birds
    All 27 EU MSs, Iceland, Norway, Switzerland and the United Kingdom reported results from passive
surveillance of AI in wild birds in 2020. Although not mandatory, ten countries also reported results
from their active surveillance programmes. Wild bird surveillance in some RCs is not based on
representative sampling, and therefore, the results presented here cannot be extrapolated to the
source populations. Comparisons are only valid for the specific observations recorded (surveillance
samples) and cannot be used to imply differences between years, species or locations.
    Results were reported for a total of 18,968 wild birds, including 12,418 birds sampled by passive
surveillance. This is a similar total number of birds as in 2019, but with a larger contribution of passive
surveillance. The total number of birds tested by passive surveillance by RC ranged from 3 birds in
Estonia to 3,041 birds in Germany. As active surveillance results in wild birds are reported to EFSA on
a non-mandatory basis, the numbers presented in this document do not represent the full extent of
surveillance activities conducted by some RCs.
    The distribution of number of birds by quarter was relatively consistent from January to September,
with an increase in the last quarter (41% of the total). The distribution within specific countries was
highly variable. Almost all birds were fully identified with a species name (9,905 birds). These birds
belonged to 259 species distributed in 22 orders. As expected, most samples originated from birds in
the order Anseriformes (n = 3,578). The orders Passeriformes, Columbiformes, Accipitriformes and
Charadriiformes were also sampled in high numbers (n > 1,000). Forty-four of the 50 species listed by
EFSA as target for HPAI surveillance were sampled in 2020. The proportion of birds belonging to
target species was 35% and 49% among passive and active surveillance samples, respectively.
    A total of 1,624 wild birds tested positive to AI: 878 for HPAI and 746 with LPAI. Most HPAI strains
were identified as H5N8 (737 out of 878 positive birds). Three species made up 44% of the HPAI-
infected birds (Branta leucopsis, Cygnus olor and Anas penelope). HPAI was identified much more
frequently than previous years (163 and 1 HPAI positive wild birds reported in 2018 and 2019,
respectively). HPAI-positive birds were reported by 14 countries: Belgium, Denmark, France, Germany,
Hungary, Ireland, Italy, the Netherlands, Norway, Poland, Slovenia, Spain, Sweden and the United
Kingdom. Almost all positive birds were detected from mid-October onwards. These results are in
accordance with the widespread epidemic of H5N8 reported in Europe since late 2020, affecting both
poultry and wild birds. The last large HPAI epidemic in Europe had been reported in 2016–2017. After
a relatively low circulation of HPAI in Europe in 2018 and 2019, it appears that the risk of AI has
substantially increased late 2020 throughout the continent.
    The 932 wild birds positive for non-HPAI viruses were reported by 16 of the 30 RCs. A total of 21
wild bird species as well as birds from four genera with unknown species were detected as positive for
non-HPAI AIVs. Positivity rates were lowest in spring (March to July). Most positive birds were detected
from September onwards. The majority of positive LPAI detections were found by active surveillance

 1
     https://eur-lex.europa.eu/legal-content/EN/TXT/?uri=uriserv%3AOJ.L_.2016.084.01.0001.01.ENG

www.efsa.europa.eu/efsajournal                                5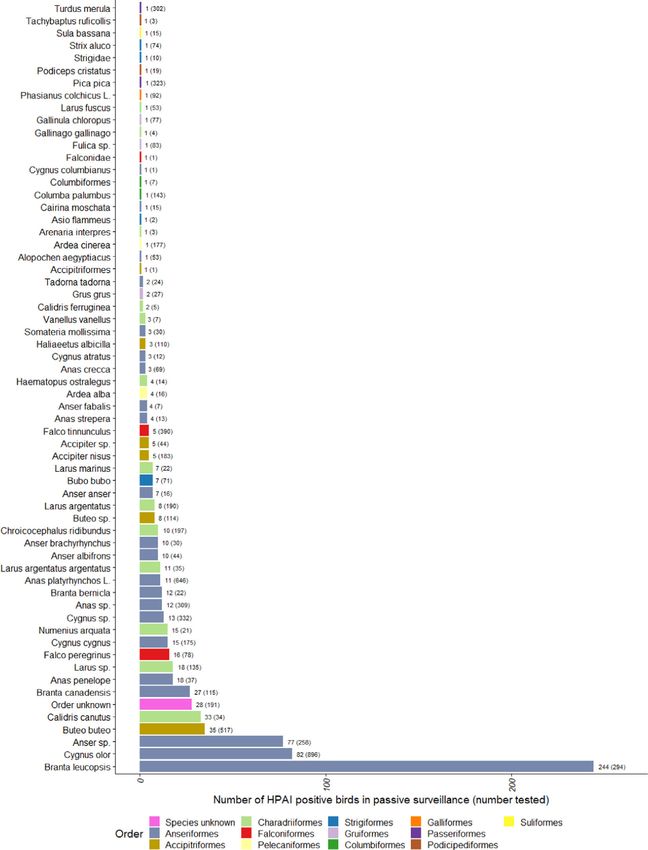
Avian influenza surveillance in 2020
(93%). Most LPAI-positive birds belonged to the order Anseriformes, which was expected given that
this is the order most sampled by both active and passive surveillance.
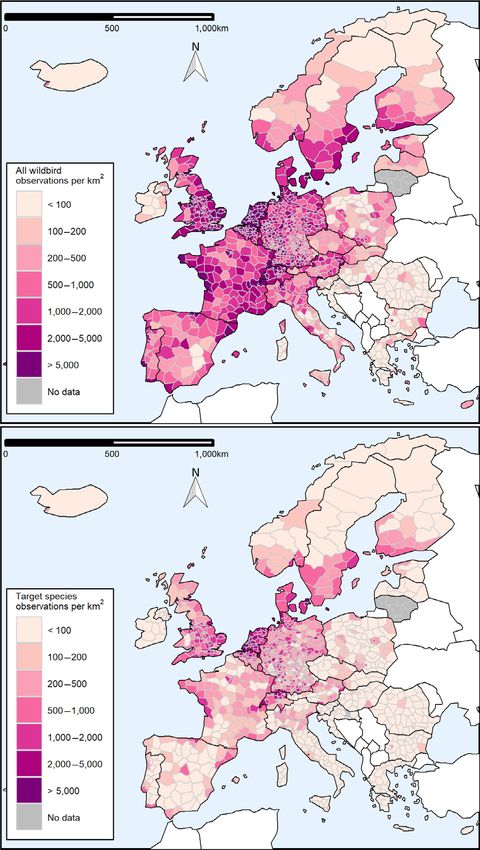
The report also presents summary data of wild bird observations in the RCs by voluntary
contributors, obtained from the EuroBirdPortal project. Despite the limitations of such data, and until
further spatial modelling of the distribution and abundance of wild birds in Europe is readily available,
the maps presented in this report could help to shed light on areas where the birds of the species
belonging to the target list may gather, supporting RCs in carrying out more targeted surveillance
activities. Further maps of the distribution of the 50 target species and the number of samples taken
by RCs for those species by month and NUTS3 have been uploaded in Zenodo.2 Considering the
seasonality attached to the circulation of avian influenza viruses, these maps may be of help in
improving the timing of sampling within targeted surveillance activities.
2. Introduction
Since late 2020, several European countries have been experiencing outbreaks of avian influenza
(AI) in domestic poultry, mainly farmed ducks, due to an H5N8 virus subtype.3 In addition to this virus
strain and other high pathogenic avian influenza (HPAI) virus strains identified over the years, low
pathogenic avian influenza (LPAI)4 viruses are regularly isolated from both domestic and wild birds in
the EU. To implement appropriate measures to prevent incursions of AI and control the spread of the
disease when incursions occur, Member States (MSs) have implemented surveillance programmes in
poultry and wild birds, including serological and virological surveillance activities. These activities
include sampling of biological materials from different origins, detection of Avian Influenza A viruses
(AIV) by various laboratory methods and typing of different antigenic subtypes based on their surface
glycoproteins: haemagglutinin (H) and neuraminidase (N). The development and implementation of
these surveillance programmes was supported by a legislative frame, which is presented below. Please
note that this frame was in place until the 21st of April 2021, date in which the new Animal Health
Law was implemented. The Terms of Reference of the European Commission mandate to the European
Food Safety Authority (EFSA) related to the production of the present report are also described.
2.1. Background and Terms of Reference
In 2020, EU legislation on avian influenza required Member States to carry out compulsory
surveillance programmes in poultry and wild birds.
The objective of the surveillance programme for AI in poultry stated in Annex I of Commission
Decision 2010/367/EU was:
to inform the competent authority of circulating avian influenza virus with a view to controlling the
disease in accordance with Directive 2005/94/EC by the annual detection through active
surveillance for:
a - LPAI of subtypes H5 and H7 in gallinaceous birds (chickens, turkeys, guinea fowl, pheasants,
partridges and quails) and ratites thereby complementing other existing early detection systems.
b - LPAI of subtypes H5 and H7 and HPAI in domestic waterfowl (ducks, geese and mallards for
re-stocking supplies of game).
The objective of the surveillance programme for AI in wild birds, as stated in Annex II of
Commission Decision 2010/367/EU is:
the timely detection of HPAI of the subtype H5N1 in wild birds in order to protect poultry in poultry
holdings and safeguard veterinary public health.
Also, as described in Decision 2018/1136/EU, the identification and review of areas that are at
particular risk for the introduction of HPAI viruses into poultry establishments, had to be carried out by
2
Monthly observations and samples from wild birds on the EFSA list of target species for 2020 by NUTS3 region. The green
colour scale represents the number of wild bird observations from the target species, as per data provided by the
EuroBirdPortal project. The black dots represent the number of wild bird samples from target species tested within the
countries’ AI passive surveillance programmes. Wild bird samples reported at NUTS2 level are not shown on these maps.
https://doi.org/10.5281/zenodo.4967481
3
Avian influenza overview December 2020 – February 2021, https://doi.org/10.2903/j.efsa.2021.6497
4
In the present report, LPAI-positive birds include both birds reported positive for an H5 or H7 AI virus not classified as HPAI
and birds reported positive for subtypes other than H5 or H7.
www.efsa.europa.eu/efsajournal 6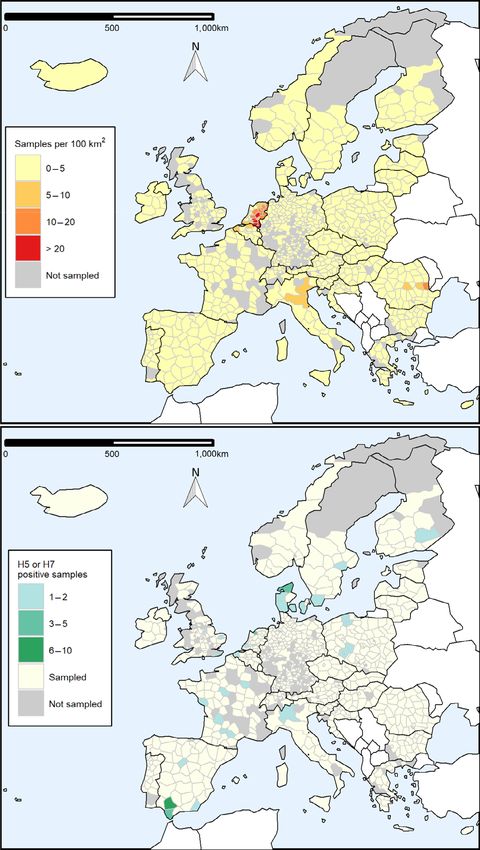
Avian influenza surveillance in 2020

MSs, ensuring that increased passive surveillance of the wild bird populations took place in these
higher risk areas.
   Guidelines for the implementation of the surveillance programmes have been provided by the EC.
The EC guidelines also include a list of wild bird target species which is under constant review as new
evidence is generated when HPAI epidemics occur in Europe. As a result, EFSA published a scientific
report providing further guidance to adjust wild bird surveillance of susceptible European species for
the detection of H5 HPAI by passive surveillance (EFSA AHAW Panel, 2017).
   Under Directive 2005/94/EC, MSs were requested to submit the results of these surveillance
programmes to the competent authority. Late in 2017, EFSA received a mandate with the Terms of
Reference being to: ‘collect, collate, validate, analyse and summarise in an annual report the results
from avian influenza surveillance carried out by Member States in poultry and wild birds’. In the
context of Article 31 of Regulation (EC) No 178/2002, from 2019 onwards, EFSA was requested to
provide the technical and scientific assistance to the Commission to deliver on this mandate. This
implies that EFSA is in charge of producing the annual surveillance report on AI since 2019.5 In
addition, the collation of all data relevant to the surveillance activities taking place in MSs has been
conducted by EFSA since January 2019.

3.            Results
3.1.          Poultry

3.1.1.        Number of poultry establishments sampled
    Twenty-seven MSs as well as Iceland, Norway, Switzerland and the United Kingdom, here referred
to as reporting countries (RCs), reported their serological surveillance activities in 2020. Data on the
total number of poultry establishments present in each RC and on the distribution of poultry categories
within RCs were not available for this report. For this reason, the number of samples by poultry
category reported below does not include information on the proportion of the population sampled in
each RC and poultry category.
    A total of 24,768 poultry establishments (PEs) were sampled as part of the RCs’ surveillance
programmes. In this report, the numbers reported as ‘PEs sampled’ should be treated with caution as
they refer to the total number of poultry sampling events taking place on a specific date, in a specific
establishment and for a specific poultry category (see Methods section for further details). Thus, the
number of distinct poultry establishments where sampling occurred in each country may be lower than
the total number of PEs sampled reported here, where poultry establishments have been sampled
more than once in 2020. The reason PEs are defined in this way is because not all RCs submit
surveillance data in a non-aggregated manner.
    Surveillance in RCs varied in both the number of PEs sampled and the poultry categories targeted
for surveillance (Figure 1). Some countries conducted testing in a limited number of poultry categories
(e.g. backyard flocks), while others distributed their sampling effort over a larger number of
categories. An overview of the total number of PEs sampled by each RC and for each poultry category
is provided in Figures 5A and 9A, respectively.
    When looking at the poultry categories among which the largest number of samples were taken by
RCs, backyard flocks and conventional and free-range laying hens were the three most sampled
poultry categories (Figure 1). In addition, Figure 1 also shows the poultry categories which are most
frequently targeted (i.e. tested by the largest number of RCs). There were five categories for which
surveillance results were reported by at least 20 RCs: laying hens (conventional and free-range),
fattening turkeys, breeding chickens and gallinaceous game birds. Only 3 and 7 countries reported
taking samples from growers6 and breeding geese, respectively. Between 10 and 17 countries reported
surveillance results for the remaining categories (others, breeding and fattening ducks, breeding
turkeys, backyard flocks, waterfowl game birds, ratites, broilers at heightened risk and fattening
geese).

 5
     The annual report on surveillance for avian influenza in poultry and wild birds in 2019 is available at https://doi.org/10.2903/
     j.efsa.2020.6349
 6
     For the purpose of this report, growers are defined as poultry establishments (different species) in which birds are reared for
     only part of their productive cycle, to be then sold to other farms belonging to the rural sector where birds will end their
     production cycle for meat/eggs (Brouwer et al., 2018).

www.efsa.europa.eu/efsajournal                                    7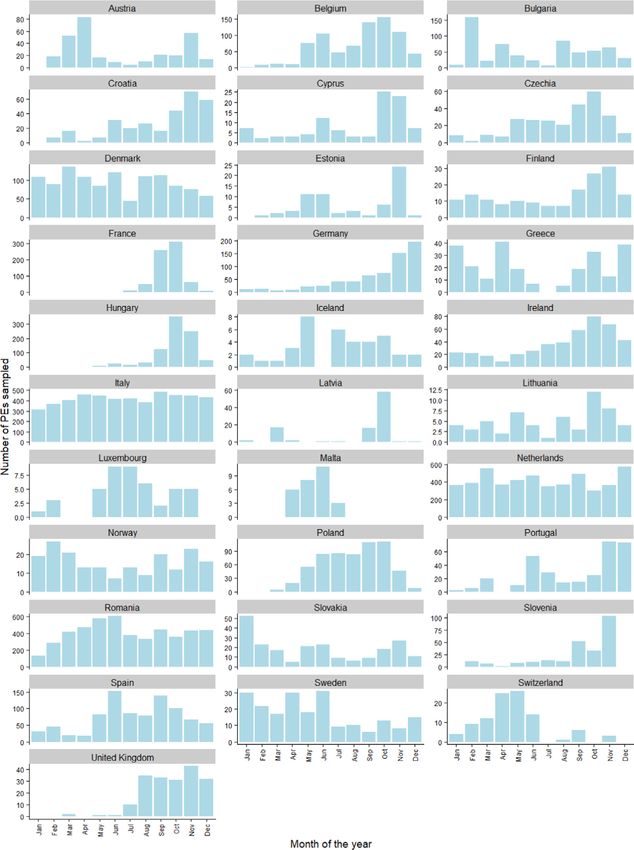
Avian influenza surveillance in 2020

   The mapping between current, more detailed reporting categories and the 16 reporting categories
used in this report (for consistency with previous reports) is presented in Appendix A (Tables A.1 and
A.2).

Figure 1: Total number of PEs sampled, presented by RC and poultry category, according to 16
          poultry categories. The colours are used to indicate the poultry categories with the smallest
          (lightest blue shade) to the largest (darkest blue shade) number of PEs sampled within a
          given RC
    Within MSs and in addition to the sampling carried out under European funding (‘EU co-funded
active surveillance’, in blue in Figure 2), five countries reported surveillance results from their national
programmes (Estonia, Lithuania, Luxembourg, Slovakia and Spain) and one from a private industry
sampling programme (Slovakia) (Figure 2). Norway, Switzerland and Iceland reported results from
their national programmes, with Iceland also reporting some results obtained via private industry
sampling.
    Please note that it is not mandatory for MSs to report surveillance results from surveillance
activities other than the EU co-funded active surveillance.

www.efsa.europa.eu/efsajournal                       8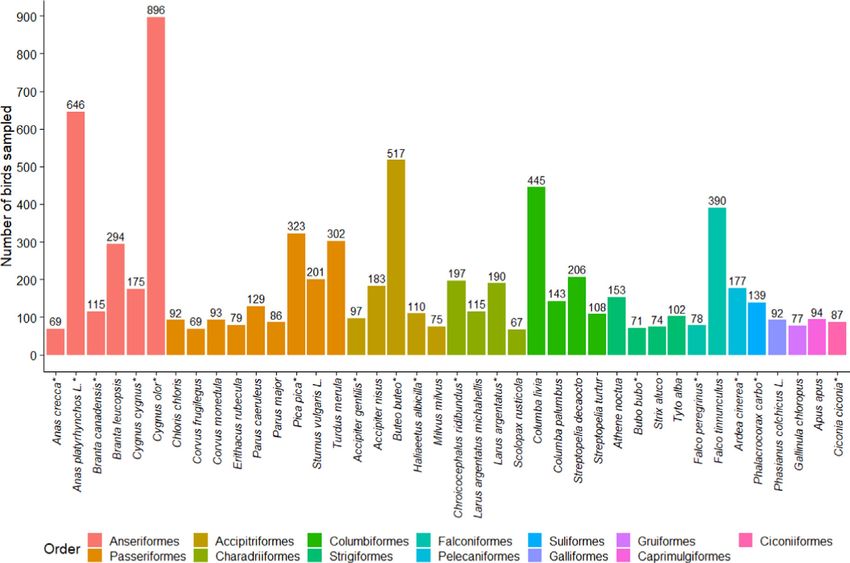
Avian influenza surveillance in 2020

Figure 2: Number of PEs sampled by RCs in 2020 according to the type of active surveillance
          programme and for which results were reported to EFSA
3.1.2.      Timing of sampling in poultry
    In terms of the timing of the sampling, 57% of the sampling took place in the second half of the
year (July–December). All countries but France conducted sampling activities during both semesters
(Figure 3). A total of 14,068 PEs were reported as sampled from July to December 2020, while 10,700
PEs were reported as sampled in the reporting period going from January to June. Figure 3 shows the
monthly distribution of poultry sampling in each RC.

www.efsa.europa.eu/efsajournal                   9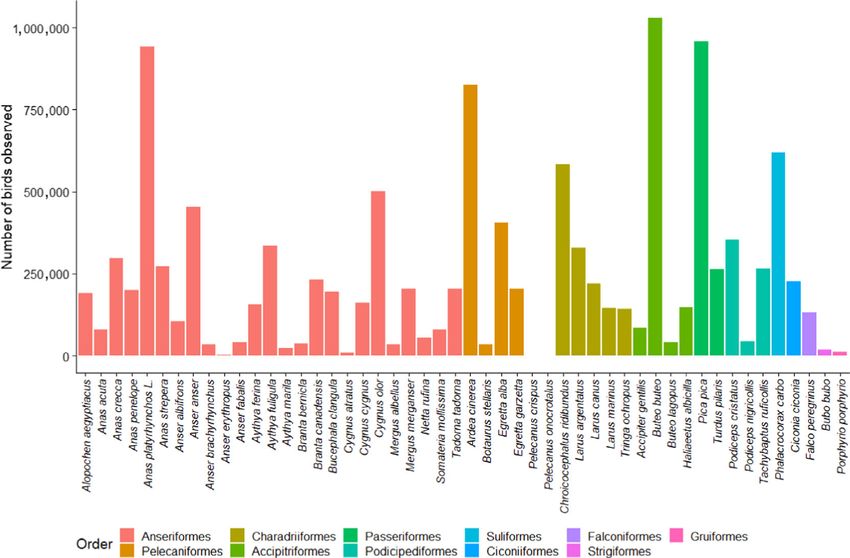
Avian influenza surveillance in 2020

Figure 3: Monthly number of PEs sampled in 2020, presented by RC. Note that the scale of the
          vertical axes is specific to each country

www.efsa.europa.eu/efsajournal               10
Avian influenza surveillance in 2020
3.1.3. Avian influenza in poultry
3.1.3.1. Serological results overview
In this section, comparisons of seropositivity rates between different groups relate to the sampling
results. They cannot be extrapolated to the source populations because:
• the sampling was targeted at higher-risk groups (non-representative sampling strategy) in some
RCs,
• the targeting approaches may differ between countries, between groups and between years.
Therefore, the percentages and trends provided in this report relate only to the surveillance
samples, not to the underlying population. Temporal trends are based on the assumption that
sampling strategies and targeting remain constant over time in all RCs.
In 2020, 46 PEs tested positive for AI H5 and 7 for H7 (Figure 4). None of the PEs sampled tested
positive for both H5 and H7. The combined H5/H7 seropositive percentage was 0.21%, lower than the
seropositive percentage in 2019 (0.45%). The percentage of AI H5 seropositive PE was 0.19%. This
number is lower than that of the previous year (0.36%). The percentage of AI H7 seropositive PEs
was 0.03%, lower than the proportion found in 2019 (0.09%). In 2020, the total number of PEs
sampled (n = 24,768) was at its highest since 2014. It was lower than the number of PEs sampled in
2013 and in previous years. The downward trend in the number of PEs sampled observed since 2008
may be reverting (Figure 4A).
Figure 4: (A) Total number of PEs sampled per year and (B) line graph of the percentage of the AI
seropositive PEs of the H5 and H7 subtypes, with the number of seropositive PEs shown
per year as labels
3.1.3.2. Serological results by reporting countries
Considerable variation in the number of PEs sampled7 among RCs was observed in 2020 (Figure 5),
as already noted in previous years. Three countries (Italy, the Netherlands and Romania) reported
60% of all PEs sampled over the course of 2020. The total number of PEs sampled among RCs ranged
from 28 in Malta, to 5,035 in Italy, with the median number of PEs sampled among RC being 270
(Figure 5). Variation among RCs in terms of the number of PEs testing seropositive to either H5 or H7
AI was also noticed. Ten RCs reported the detection of seropositive PEs for H5 or H7. All ten countries
7
Please note that throughout this report, “number of PEs sampled” refers to all PEs sampled, regardless of the type of tests
conducted on the samples (serology or virology).
www.efsa.europa.eu/efsajournal 11Avian influenza surveillance in 2020
reported detection of AI H5 (total of 46 PEs) and only Spain reported the detection of AI H7
seropositive PEs (total of 7 PEs) (Figure 5). Most H5/H7 detections (45 PEs out of 53) occurred in
countries which sampled a number of PEs larger than the median number of PEs sampled.
Figure 5: (A) Total number of PEs sampled in 2020 per RC shown in descending order and (B) total
number of serologically positive PEs found by H subtype
3.1.3.3. Serological results by administrative units
Surveillance activities in poultry were reported for 32 NUTS2 (Nomenclature of Territorial Units for
Statistics, level 2) units and 798 NUTS3 units in 2020. Reporting at NUTS2 level was linked to
surveillance activities in Belgium, Germany, Italy and the United Kingdom. Out of the 24,768 PEs,
5,830 and 18,938 were reported at NUTS2 and NUTS3 level, respectively. Out of 53 seropositive PEs, 3
and 50 were reported at NUTS2 and NUTS3 level, respectively.
Figure 6 shows the geographical distribution of the surveillance activities that took place in 2020, as
well as the number of H5 or H7 seropositive detections. Data are represented at the NUTS level they
were reported at (i.e. the maps show a combination of NUTS2 and NUTS3 units). The sampling
density, estimated as the number of PEs sampled per 100 km2 within an NUTS region, and the
distribution of the seropositive PEs for AI H5 or H7 are presented in Figure 6 in the upper and lower
maps, respectively.
www.efsa.europa.eu/efsajournal 12Avian influenza surveillance in 2020
Figure 6: Sampling density expressed as the number of PEs sampled per 100 km2 (upper map) and
geographical distribution of AI H5 and H7 seropositive PEs (lower map) by administrative
unit. Non-reporting countries are shown in white
3.1.3.4. Serological results by month
Since 2019, poultry surveillance data have been reported on a monthly basis. The distribution of
PEs testing positive for H5 or H7 by month shows that the months with the highest seropositivity rates
(and the highest number of seropositive PEs) were February, June, October and December 2020
(Figure 7). During these months, 6, 12, 6 and 9 PEs, respectively, were reported positive, compared to
between 1 and 3 PEs during other months of the year. There was no apparent correlation between
higher seropositivity rates and higher number of PEs sampled. However, as noted in the previous
report, the month with the highest number of positives corresponded to the month where most of the
PEs from the category ‘game birds (waterfowl)’ were sampled. In 2019, this occurred in April, while in
2020, it occurred in June: 76 PEs sampled in June compared to 104 during the remaining 11 months.
Out of 17 positive PEs in waterfowl game birds, 10 were identified in June.
www.efsa.europa.eu/efsajournal 13Avian influenza surveillance in 2020
For the ten countries reporting H5 or H7 seropositive PEs, the distribution of these events by month
is shown in Figure 8.
Figure 7: (A) Total number of PEs sampled by month with values above the bars referring to the
number of PEs sampled. (B) percentage (y-axis) and number (above bars) of PEs sampled
that tested serologically positive to H5 or H7 AI virus by month
Figure 8: Monthly number of PEs sampled and positive in serology (H5 or H7 only) in 2020,
presented for RCs with at least one H5 or H7 positive PE only. Note that the scale of the
vertical axes is specific to each country
www.efsa.europa.eu/efsajournal 14Avian influenza surveillance in 2020
3.1.3.5. Serological results by poultry category
The highest numbers of PEs sampled by RCs in 2020 were from the backyard and conventional
laying hen categories (n = 4,740 and 4,404, respectively) (Figure 9A). These two most sampled
categories were the same as in previous years. Other categories sampled in large numbers were the
free-range laying hens, breeding chickens, fattening turkeys and growers (Figure 9A).
As in 2019 and earlier, the highest percentage of AI H5 or H7 seropositive PEs in 2020 was found in
the waterfowl game bird category (9.4% out of 180 waterfowl game bird PEs sampled), followed by
breeding geese (3.3% out of 152 PEs) and breeding ducks (1.8% out of 221 PEs). The proportion of
seropositive PEs was under 1% in all other poultry categories. The ‘other’ category had a lower
proportion of seropositive PEs compared to the previous year (0.1% out of 1,049 PEs sampled). When
considering only gallinaceous species, the highest percentage of H5 or H7 seropositive PEs was
observed in the free-range laying hen category (0.4% out of 3,487 PEs sampled). No H5 or H7
seropositive results were found in turkeys (fattening or breeding), broilers (heightened risk), breeding
chickens and conventional laying hens. One positive PE was found in each of the growers and ratite
categories, unlike in 2019 where no positive PE had been found in these categories.
In addition to H5 and H7 positive results, ten RCs reported non-H5/H7 positive results in poultry
(Austria, Belgium, Denmark, Estonia, Germany, Latvia, Luxembourg, Norway, Sweden and Spain).
There were 261 PEs seropositive for AI virus strains other than H5 or H7.8 The categories with the
largest numbers of non-H5/H7 seropositive PEs were the laying hens (free-range and conventional),
backyard flocks, waterfowl game birds and breeding chickens. Proportions of non-H5/H7 seropositive
PEs by poultry category could not be reliably estimated, as not all RCs reported these results. For this
reason, Figure 9 does not display the non-H5/H7 results.
For each poultry category, detailed results by month are shown in Figure 10. In addition,
surveillance results by bird species and order are shown in Figure B.1 – Appendix B. The figure shows
that, regardless of management system, positive PEs were found in Anseriformes (domestic and
Mallard ducks as well as geese), chickens, ratites and pheasants. A large number of positive samples
were identified in PEs raising game birds from the order Anseriformes for which the bird species was
not available.
Figure 9: (A) Total number of PEs sampled by poultry category with values above the bars referring
to the number of PEs sampled; (B) percentage (y-axis) and number (above bars) of PEs
sampled that tested serologically positive to H5 or H7 AI virus by poultry category
8
Reporting of non-H5 or H7 seropositive PEs by MSs is not compulsory.
www.efsa.europa.eu/efsajournal 15Avian influenza surveillance in 2020
Figure 10: Monthly number of PEs sampled and positive in serology (H5 or H7 only) in 2020,
presented by poultry category. Note that the scale of the vertical axes is specific to each
category. Some positive results (e.g. in laying hens) are not visible due to the small
number of positive PE that month (e.g. 1 H5-positive PE only). The asterisks indicate
whether there was at least one positive PE in that category and month
www.efsa.europa.eu/efsajournal 16Avian influenza surveillance in 2020
3.1.3.6. Serological results: summary
Figure 11 shows the countries and poultry categories in which H5 seropositive birds were detected.
Spain, the Netherlands and Denmark were the countries reporting the most H5-positive PEs. Those
PEs were reported mainly in free-range laying hens in Denmark and the Netherlands, and mainly in
waterfowl game birds in Spain. Spain also reported the detection of H7 seropositive PEs (waterfowl
game birds and fattening ducks).
The sensitivity of serological surveillance activities to detect HPAI in RCs depends on several
parameters, including the number of poultry establishments in each country, the number of
establishments sampled, the sensitivity of within-establishment sampling and the design prevalence
(proportion of establishments which is expected to be infected should HPAI be present in the country).
Figure 11: Number of H5 and H7 seropositive PEs by RC and poultry category in 2020, presented for
RCs and categories with at least one H5 or H7 positive PE only
3.1.3.7. PCR and virological results
Out of the 53 PEs with positive serological tests for H5 or H7, samples from 46 PEs were tested
further for AI viral RNA using polymerase chain reaction (PCR), and seven of these PEs tested positive
in PCR:
• two positives in France, one for H5 LPAI and one for non-H5/H7 LPAI, both in fattening ducks.
• one free-range laying hen PE tested positive in the Netherlands for H5 LPAI.
• in Denmark, one laying hen PE tested positive for H5 LPAI and one PE (category ‘others’) tested
positive for H5 HPAI.
• one waterfowl game bird PE tested positive for non-H5/H7 LPAI in Sweden.
• and, last, one breeding duck PE tested positive for H5 LPAI in the United Kingdom.
Most of the seropositive PEs were tested by PCR on the same day (n = 36), while the remainder
were re-sampled for PCR testing on average 11 days after the serological tests. No virus isolation
results were available for the PEs with positive serological or PCR tests. Virus isolation results were
available for samples from four PEs (all in Spain) and were all negative.
In addition, 13 countries also reported PCR results from 748 PEs which did not correspond to the
follow-up testing of a positive serology event (e.g. in some PEs, PCR tests were used for screening).
Twenty-five of these PEs were found positive for AI viral RNA, including 16 PEs with H5 HPAI in
Bulgaria and Germany. The pathogenicity of the virus identified in the other PEs was not available (H5
in Romania and Slovakia, non-H5/H7 in Estonia).
www.efsa.europa.eu/efsajournal 17Avian influenza surveillance in 2020
3.2. Wild birds
3.2.1. Number of birds sampled
In 2020, a total of 18,968 wild birds were sampled by 27 MSs as well as Iceland, Norway,
Switzerland and the United Kingdom (31 RCs) either by active or passive surveillance.
Within MSs and in addition to the sampling carried out under European funding (‘EU co-funded
passive surveillance’, in blue in Figure 12), four countries reported surveillance results from their
national programmes (non-EU co-funding programmes) (Belgium, Estonia, Germany and Spain).
Norway, Switzerland and Iceland reported results from their national programmes.
Figure 12: Number of wild birds sampled by RCs in 2020 according to the type of surveillance
programme
For the purpose of this report, birds ‘found dead’ or ‘live with clinical signs’ were classified under
passive surveillance (the latter including injured birds), while birds reported as ‘hunted with clinical
signs’, ‘hunted without clinical signs’ and ‘live without clinical signs’ were considered as birds sampled
via active surveillance. This is consistent with the classification method followed in previous reports.
Passive surveillance is assumed to be undertaken by voluntary contributors.
All 31 RCs reported results from their passive surveillance. From the total number of birds sampled,
12,418 were sampled by passive surveillance in 2020, more than in 2018 or 2019, but less than in
2017 (Table 1). The sensitivity of passive surveillance for AI in wild birds is highly dependent on the
probability of contributors discovering and reporting birds found dead, injured or with clinical signs.
Some RCs (n = 10) also performed and reported results from active surveillance data (non-EU
co-funding programmes for which reporting is non-mandatory), particularly, Belgium, Estonia, Germany
and Norway who sampled a higher number of birds by active than by passive surveillance (Table 1).
Although active surveillance was carried out in other RCs, the data shown in the report represent the
data submitted to EFSA only. As reporting active surveillance results in wild birds to EFSA is not
mandatory, the numbers reported below for active surveillance do not represent the full extent of
activities conducted by some RCs. Consequently, this report contains complete data for passive
surveillance only and mainly focuses on summarising the sampling activities and results obtained by
passive surveillance.
www.efsa.europa.eu/efsajournal 18Avian influenza surveillance in 2020
Table 1: Number of wild birds sampled by RC in 2020 (light grey background), with active and
passive surveillance presented separately and combined as a total, and number of wild
birds sampled by passive surveillance from 2017 to 2019 (no background colour). Small
figures or no data for active surveillance do not mean that no active surveillance was
carried out in that RC, rather, little or no data were reported to EFSA from that RC
Passive surveillance Active surveillance Total
Reporting Country
2017 2018 2019 2020 2020 2020
Austria 897 109 85 183 0 183
Belgium 367 237 423 275 1,094 1,369
Bulgaria 47 58 65 70 8 78
Croatia 279 223 160 92 0 92
Cyprus 117 109 87 137 18 155
Czechia 330 94 104 127 0 127
Denmark 154 148 111 288 0 288
Estonia 38 16 8 3 111 114
Finland 316 195 174 222 0 222
France 766 113 158 503 0 503
Germany 8,533 1,711 1,392 3,041 4,391 7,432
Greece 90 13 12 6 0 6
Hungary 703 371 338 472 0 472
Iceland – – 2 9 0 9
Ireland 137 142 78 165 0 165
Italy 2,019 2,109 2,719 2,791 1 2,792
Latvia 11 14 15 4 0 4
Lithuania 131 70 63 139 0 139
Luxembourg 61 – 50 135 0 135
Malta – – – 9 94 103
Netherlands 509 663 643 878 0 878
Norway – – 28 128 528 656
Poland 209 36 33 97 0 97
Portugal 54 82 126 74 0 74
Romania 528 244 201 107 44 151
Slovakia 513 84 45 83 0 83
Slovenia 556 178 231 270 0 270
Spain 370 344 281 437 261 698
Sweden 452 455 456 410 0 410
Switzerland 162 45 30 55 0 55
United Kingdom 1,194 1,282 816 1,208 0 1,208
Total 19,543 9,145 8,934 12,418 6,550 18,968
3.2.2. Timing of sampling in wild birds
In Figure 13, the quarterly distribution of the number of birds sampled by passive surveillance in
2020 is shown by RC. The highest number of samples were taken during the last quarter (October-
December). The distribution of sampling was lower but relatively consistent during the first three
quarters:
• Quarter 1: 2,152 birds, 17%
• Quarter 2: 2,352 birds, 19%
• Quarter 3: 2,789 birds, 22%
• Quarter 4: 5,125 birds, 41%
Figure 13 shows some variation among RCs in terms of the sampling distribution throughout the
year (percentage of samples taken at each quarter by each RC). For example, around 75% of samples
www.efsa.europa.eu/efsajournal 19Avian influenza surveillance in 2020
collected in Poland and Slovakia over the year were taken during the first quarter. All samples collected
in Malta were reported for the third quarter. Finally, the sampling was most intensive in the fourth
quarter for Denmark, France, Luxembourg and Norway.
Figure 13: Quarterly percentage (bars) and total number (values) of wild birds sampled by passive
surveillance by RC in 2020, with quarter 1 starting in January 2020
3.2.3. Species distribution in wild birds
Among wild birds sampled via passive surveillance, there were:
• 9,905 birds fully identified with a species name. These samples belonged to a total of 259 wild
bird species belonging to 22 orders.
• 2,162 birds for which only the genus was identified but not the species (14 orders).
• 123 birds for which only the family was identified but not the species (7 orders).
• 37 birds for which only the order was identified (5 orders).
• 191 birds for which identification information was completely missing. Birds from this category
are shown under the group name ‘Species unknown’ in Figure 14.
The most sampled order was Anseriformes (n = 3,578), which accounted for 28.8% of the total
number of birds sampled by passive surveillance. The orders Passeriformes, Columbiformes,
Accipitriformes and Charadriiformes were also sampled in high numbers (n > 1,000) (Figure 14).
Active surveillance samples were also mostly taken from birds of the order Anseriformes. A total of
5,153 samples from this order were tested by active surveillance, out of a total of 6,550 samples
tested (78.7%). The distribution of birds sampled by order is shown jointly for active and passive
surveillance in Figure C.1 – Appendix C.
The majority of the species sampled by passive surveillance belonged to the orders Passeriformes
(n = 84 species), Charadriiformes (n = 47), Anseriformes (n = 46) and Accipitriformes (n = 26). In Figure 15,
the 40 species with the most birds sampled in 2020 are shown (out of 259 fully identified species).
The four most sampled species (passive surveillance) were Cygnus olor (mute swan), Anas
platyrhynchos (mallard), Buteo buteo (common buzzard) and Columba livia (common pigeon), similarly
to the 2019 results, albeit with a different ranking. All English common names for the species shown in
Figure 15 are listed in Table D.1 – Appendix D.
www.efsa.europa.eu/efsajournal 20Avian influenza surveillance in 2020
Forty-four out of the 50 recommended target species by EFSA (EFSA, 2017) are included in the 259
species reported (see Table E.1 – Appendix E). Respectively, 34.9% and 49% of the birds sampled by
passive and active surveillance belonged to target species (n = 4,334 and 3,207).
Figure 14: Total number of wild birds of the different orders, sampled by passive surveillance in 2020
(n = 12,418). The Y-axis is presented on a non-linear scale to improve visibility
Figure 15: Total number of birds sampled for the 40 most sampled wild bird species reported by passive
surveillance in 2020 (7,556 birds out of 9,905 fully identified birds). The bar colours refer to
the bird orders. English common names for the species shown are provided in Appendix D
www.efsa.europa.eu/efsajournal 21Avian influenza surveillance in 2020
3.2.4. Avian influenza in wild birds
3.2.4.1. Detection of avian influenza virus in samples
When analysing data from both active and passive surveillance, a total of 1,624 (8.6%) birds, out
of the 18,968 sampled by RCs, tested positive to AI (Table 2). This proportion was about twice as high
as in 2019 (4.7%) or 2018 (3.8%). Of the 1,624 positive birds, 878 were infected with HPAI virus and
746 with LPAI virus.9
Most AI-positive birds were found dead (1,157 birds tested AI positive, including 797 testing
positive for HPAI). In 2020, the majority of AI-positive birds were found by passive surveillance (72%),
a major difference from the previous year (e.g. 7% of AI detections by passive surveillance in 2019).
The proportions of positive birds in active and passive surveillance were 7% and 9%, respectively.
Table 2: Avian influenza diagnostic results for birds sampled by passive (no background) and active
(light grey background) surveillance by all RCs in 2020, by bird status. The column ‘All
positive’ includes all AI positive birds obtained by polymerase chain reaction (PCR) or virus
isolation (VI). All birds with a successful AI virus isolation (column ‘Positive in VI’) had
previously tested positive by PCR
No. of AI positive birds
No. of birds
Bird status All Positive in HPAI LPAI
sampled
positive VI positive positive
Active Hunted with clinical signs 84 33 0 30 3
Hunted without clinical signs 2,403 313 10 31 282
Live without clinical signs 4,063 107 35 9 98
Subtotal 6,550 453 45 70 383
Passive Found dead 11,904 1,157 11 797 360
Live with clinical signs 514 14 1 11 3
Subtotal 12,418 1,171 12 808 363
Total 18,968 1,624 57 878 746
Wild bird sampling was reported for 19 NUTS2 units, 188 NUTS3 units and 9,865 individual
coordinate locations in 2020. Italy reported surveillance results at NUTS2 level, while Czechia, Hungary,
Iceland, Ireland, Latvia, Lithuania, Malta, Netherlands, Poland, Romania and Spain reported results at
NUTS3 level. Norway reported some results at NUTS3 level and some by location coordinates. Other
countries reported results by location coordinates only.
Out of the 18,968 wild birds sampled, 2,792 and 3,440 were reported at NUTS2 and NUTS3 level,
respectively, while 12,736 were reported by location coordinates. Out of the 878 H5 HPAI-positive
birds, 2 and 148 were reported at NUTS2 and NUTS3 level, respectively, while 728 were reported by
location coordinates.
Figure 16 shows the geographical distribution of AI surveillance activities conducted by RCs in wild
birds in 2020. Data are represented at the NUTS level they were reported at (i.e. the maps show a
combination of NUTS2 and NUTS3 units). Data reported with location coordinates were aggregated at
NUTS3 level.
9
For some AI-positive birds, one or more samples tested positive for HPAI while virus pathogenicity results were not available
for one or more of the other positive samples. These birds are considered as HPAI-positive in the present report.
www.efsa.europa.eu/efsajournal 22Avian influenza surveillance in 2020
Figure 16: Sampling density, expressed as the number of wild birds sampled per area of 100 km2
(upper map), and geographical distribution of all AI positive birds (middle map) and HPAI
positive birds (lower map), by administrative unit. Non-reporting countries are shown in
white
www.efsa.europa.eu/efsajournal 23Avian influenza surveillance in 2020
3.2.4.2. High pathogenic avian influenza in wild birds
3.2.4.2.1. HPAI results by neuraminidase type
A total of 878 birds tested positive for HPAI in 2020, more than in 2019 (1 positive bird) and 2018
(163 positive birds). HPAI-positive birds were reported by 14 RCs. All HPAI strains were identified as
H5, and most were identified as H5N8 (84%). Figure 21 summarises the reported N subtypes for
these positive samples.
Figure 17: Virus neuraminidase (N) type identified in HPAI-positive wild birds (all HPAI strains were
identified as H5). Values are provided above the bars. There were no birds with more
than one N antigen identified
3.2.4.2.2. HPAI results by species
A total of 51 wild bird species, birds from 8 genera with unknown species and birds from 2 families
with unknown species were detected as positive for HPAI, as well as 30 birds with no species
identification (no order, family, genus or species). The HPAI infected birds belonged to the 12 orders
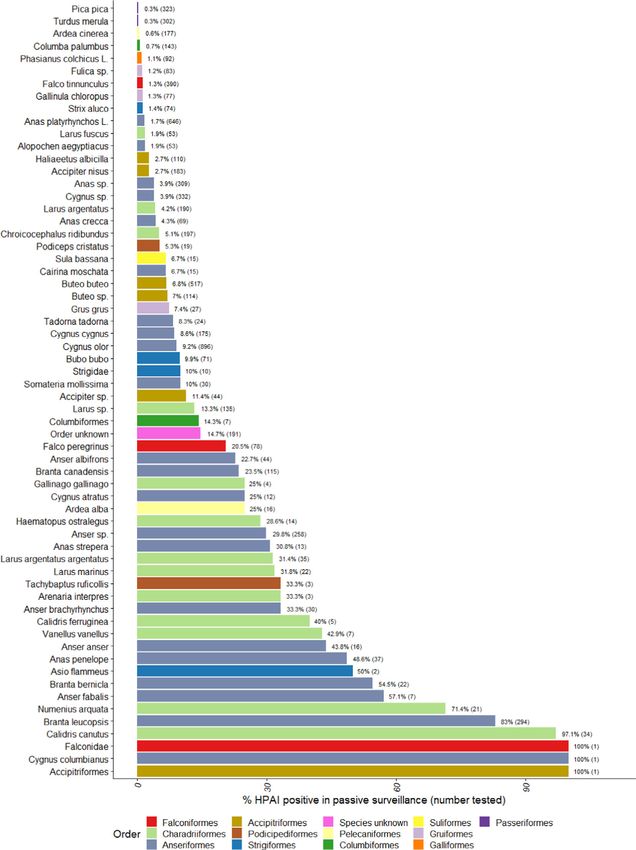
as well as unknown orders, as shown in Figures 18 and 19. These two figures show combined data for
passive and active surveillance. The same data is presented separately by type of surveillance in
Appendices G and H: Figures G.1 and G.2 (passive surveillance), Figures H.1 and H.2 (active
surveillance).
Less than half of the HPAI positive birds belonged to the EFSA target species (n = 337, 38%). In
particular, the species with the largest number of HPAI-positive samples identified in passive
surveillance was barnacle goose (Branta leucopsis, n = 264), which is not listed as a target species
(Figure 18). The two other species with the largest numbers of HPAI-infected birds were Cygnus olor
(n = 83) and Anas penelope (n = 42), while 80 positive birds were identified as geese at the genus
level only (Anser sp.).
The percentage of HPAI-positive birds by species shown in Figure 19 must be interpreted carefully,
as the number of birds sampled for a given species may be very small. For instance, only one Cygnus
columbianus was sampled and tested positive, yielding a percentage of 100% for that species.
www.efsa.europa.eu/efsajournal 24You can also read