On the Doorstep, Rodents in Homesteads and Kitchen Gardens - MDPI
←
→
Page content transcription
If your browser does not render page correctly, please read the page content below
animals
Article
On the Doorstep, Rodents in Homesteads and
Kitchen Gardens
Linas Balčiauskas *        and Laima Balčiauskienė
 Nature Research Centre, Akademijos 2, LT 08412 Vilnius, Lithuania; laima.balciauskiene@gamtc.lt
 * Correspondence: linas.balciauskas@gamtc.lt or linas.balciauskas@gmail.com; Tel.: +370-685-34141

 Received: 25 March 2020; Accepted: 13 May 2020; Published: 15 May 2020

 Simple Summary: Seven species were recorded during a pilot study of small mammals in commensal
 habitats (homesteads and kitchen gardens) in Lithuania. Homestead gardens and outbuildings
 without food availability were dominated by yellow-necked mice, while buildings where food was
 available were dominated by bank voles. The body condition of rodents in these commensal habitats,
 being highest in the homestead gardens, was worse than that in rodents found in other agricultural
 habitats. Breeding failures in the form of disrupted pregnancies were recorded in all of the most
 numerous species of rodents.

 Abstract: Scarcely investigated in terms of small mammals, kitchen gardens and homesteads
 form a subset of environments. Using results of snap trapping, we present the first data on
 small mammal species diversity, gender and age structure, relative abundance, body fitness,
 and reproduction parameters in these commensal habitats (kitchen gardens, homestead gardens,
 houses, and outbuildings). We expected that (i) house mice should be the dominant species in
 buildings, while striped field mice should be dominant in gardens, (ii) body condition should be
 the highest in buildings, (iii) body condition should increase in the autumn, irrespective of the
 habitat, and (iv) breeding failures in the form of disrupted pregnancies should be observed. Not all
 of the predictions were confirmed. From the seven recorded species, gardens and outbuildings
 were dominated by yellow-necked mice, while bank voles dominated in buildings where food was
 available. The number of recorded species and diversity index increased during the autumn months.
 The body condition was highest in rodents that were trapped in gardens. It decreased towards winter,
 with the exception of the striped field mouse. Breeding disturbances were recorded in all of the most
 numerous species, comprising 16.7–100% of all observed pregnancies.

 Keywords: small mammals; commensal habitats; homesteads; diversity; body condition; breeding

1. Introduction
      Rapidly changing environments present new opportunities for interactions between humans
and small mammals. These are not limited to dependency and commensalism, but can also be
“species opportunistically benefitting from humans, without dependence”, this defined as anthropophilic [1].
The indoor biome is currently an expanding habitat [2]. In the urban areas, commensal rodents are the
main vertebrate pests [3], but knowledge relating to them is mostly related to two species—brown rat
(Rattus norvegicus) and house mouse (Mus musculus). Other species are rarely mentioned [4–8]. In the case
of farms, the indoor biome, along with surrounding agricultural habitats, form a subset of environments.
The list of species in this habitat may be quite long, including many larger wild mammals. However,
farms and surrounding agricultural habitats are insufficiently known in terms of small mammals [9].
      The presence and abundance of rodents near human habitats depends on the amount of land
cover, socio-economic conditions, and local variables, including food availability and shelter [10].

Animals 2020, 10, 856; doi:10.3390/ani10050856                                 www.mdpi.com/journal/animals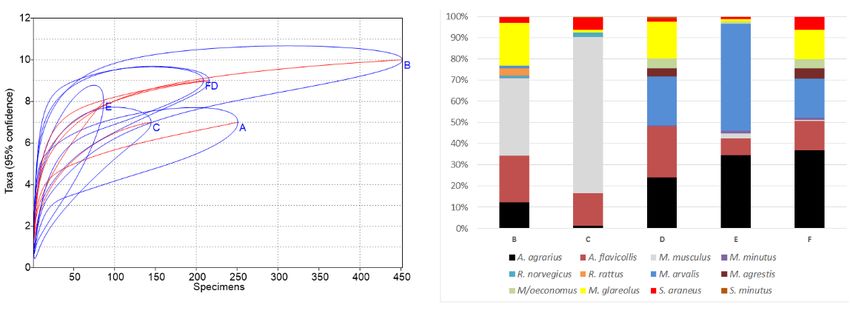
Animals 2020, 10, 856                                                                                2 of 15

Rodents living in agricultural areas are reservoir populations, which could provide sources for
infestation of human dwellings [11]. Commensal and semi-commensal habitats provide food, which is
beneficial, but there are costs in terms of instability in time and space [12].
      Human–wildlife conflict occurs globally [5]. From the human position, rodents in dwellings and
agricultural areas are treated as pests. However, no more than 5–10 percent of rodents are major pests
in agricultural or urban environments [6], and only some species, such as M. musculus, exhibit both
agrophyly and synanthropy [13]. Data of such species of rodents are of interest, but they are rarely
available [10]. In the Baltic countries, there are two publications on small mammals in buildings [14,15],
two studies about urban mammals [16,17], and a pilot study about small mammals in commercial
orchards [18].
      Homesteads and kitchen gardens are in the middle of the urban-rural-natural gradient [19–22].
Under urbanization, natural habitats are transformed or changed, forcing mammals into
synurbization [20]. In addition to damage, other problems can become important, such as integrated
pest management inside and outside buildings [23]. Rodent control should be based on species ecology
and spatiotemporal factors [24]. Finally, with increasing concerns about rodent-based transmission of
ectoparasites, diseases, and pathogens, this new topic is becoming of ever greater importance [25–32].
      Kitchen and community gardening is becoming a natural addition to homesteads and small
farms [33,34]. Studies of the biological content of farms and kitchen gardens are widening [35],
yet still a better understanding of agro-biodiversity in these areas is required [36,37], including of small
mammals [28]. The results of these studies contribute to a better understanding of mammal association
with humans and may provide means for mitigating conflicts [38].
      Our aim was to present the first data on the ecology and biology of rodents in commensal
habitats in Lithuania (homesteads and kitchen gardens, including gardens, food-related buildings,
and outbuildings). We analyzed species diversity, relative abundance, gender and age structure, body
fitness, and reproduction parameters. The tested predictions were that (i) house mice should be the
dominant species in all buildings, while striped field mice, in accordance with [18], should be dominant
in garden habitats, (ii) body condition should be highest in buildings, (iii) body condition should
increase in the autumn, irrespective of the habitat, and (iv) breeding failures should be observed due
to stress and anthropogenic impact. Our results contribute to knowledge related to anthropophilic
rodents and their association with humans. Our results can be useful for country-house owners and for
mitigating conflicts between gardeners and rodents. This was the first such study in the Baltic countries.

2. Material and Methods
     We evaluated small mammal presence, diversity, body condition, litter size (as a proxy of
reproductive output [39]), and the rate of breeding disturbances in homesteads and kitchen gardens
in Lithuania (Tables 1–4). Trapping with snap traps was conducted from June to November 2019.
For comparison of species composition, published data from homestead buildings [14,15] and recently
investigated commercial orchards and berry plantations [18] were used (Tables 5 and 6).

2.1. Study Sites
      Our two study sites were situated in the eastern part of Lithuania (Figure 1). Site 1 was a homestead
territory near a lakeshore (Figure 1a), quite typical for the country. It consisted of a garden, vegetable
garden, orchard, greenhouse, living house with porch and cellar, and outbuildings—a box-room,
a barn (with rests of the hay and straw) and a bathhouse. The vegetable garden was characterized
by a diversity of cultures (lettuce, radish, dill, potato, carrot, beetroot, cabbage, squash, courgette,
cucumber, kohlrabi, spinach, parsley, onion, amaranth, garlic, green peas, legume, various beans,
and strawberries). Tomato and red pepper were grown in a greenhouse. Oaks, fir trees, rowan,
and birch were present in the garden, while apple trees, plum trees, cherry trees, hazels, raspberries,
gooseberries, currants, and quinces were grown in the orchard. The area of this homestead was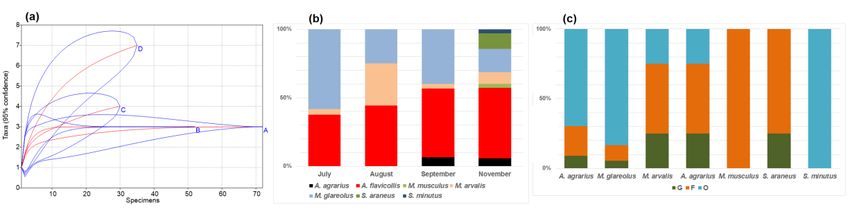
Animals 2019, 9, x FOR PEER REVIEW 3 of 15
young oaks and surrounded by semi-natural meadows. The nearest neighbouring farms were
located2020,
Animals 200–400
10, 856m away. 3 of 15
Site 2 was the territory of a kitchen garden (Figure 1b). Its area was ten times smaller (600 m2)
than the homestead and it was located in proximity with similar kitchen gardens. It consisted of a
6000 m2 , framed
vegetable garden, at summer
the perimeter
house, with
andblack alders and
greenhouse. young oaks and
Outbuildings weresurrounded
limited to by semi-natural
a small outside
meadows. The nearest neighbouring farms were located 200–400 m away.
toolshed. The vegetable garden was characterized by an even greater diversity of cultures in a small
area,Site
with2 was
basil,the territory
sorrel, of a kitchen
tomato, gardengrown
and rhubarb (Figure 1b). Its areatowas
additionally the ten times smaller
vegetables (600
that are m2 )
listed
than
above. the homestead
There were someand apple
it wastrees,
located in proximity
peach with similar
trees, cornelian kitchen
cherries, hazels,gardens.
walnuts,Itbarberry
consistedtrees,
of a
vegetable garden, summer house, and greenhouse. Outbuildings were limited
grapes, and kiwi shrubs, as well as various shrubs (raspberries, brambles, high blueberries, currants, to a small outside
toolshed. The vegetable
quinces, juneberries, andgarden was characterized
black chokeberries) by an eventrees
and decorative greater diversity
(junipers, of cultures
white spruce, in a small
yew-tree,
area, with basil, sorrel, tomato, and rhubarb grown additionally to
lilac, magnolia, Oregon grape, jasmine, honeysuckle, deutzia, Japanese sumac, meadowsweet,the vegetables that are listed
above.
box-tree, There
and were some
shrubby apple trees,
cinquefoil). peachspecies
Many trees, cornelian
of flowerscherries, hazels, walnuts,
were additionally grown. barberry trees,
The nearest
grapes, and kiwi shrubs, as well as various shrubs (raspberries, brambles,
neighbors were similar kitchen gardens, not isolated from the one under investigation. high blueberries, currants,
quinces,
Bothjuneberries,
of the sites and black
are not chokeberries)
inhabited duringand thedecorative trees
winter, while (junipers,
Site 2 is not white spruce, inhabited
permanently yew-tree,
lilac,
even magnolia,
in summer. Oregon
Both grape,
of the jasmine,
sites arehoneysuckle,
examples ofdeutzia, Japanese
ecological sumac,
farming, meadowsweet,
as synthetic box-tree,
fertilizers and
and shrubby cinquefoil). Many species of flowers were additionally grown.
chemicals were applied in only very limited amounts and no heavy machinery was used. All of the The nearest neighbors
were similargrown
production kitchen atgardens,
both sitesnot isolated
is used for from
family theneeds.
one under investigation.
Figure 1. Location of the study sites in Lithuania (a): Site 1, homestead near Davainiai forest, Leliūnai,
Figure 1. Location of the study sites in Lithuania (a): Site 1, homestead near Davainiai forest,
Utena district (55.444 N, 25.464 E), and (b): Site 2, kitchen garden in Brinkiškės, Vilnius district (54.822 N,
Leliūnai, Utena district (55.444 N, 25.464 E), and (b): Site 2, kitchen garden in Brinkiškės, Vilnius
25.104 E).
district (54.822 N, 25.104 E).
Both of the sites are not inhabited during the winter, while Site 2 is not permanently inhabited
We investigated commensal habitats (according [12]) clustered into three groups. From here on,
even in summer. Both of the sites are examples of ecological farming, as synthetic fertilizers and
the gardens, vegetable gardens, and orchard will be referred to as gardens, providing main amount
chemicals were applied in only very limited amounts and no heavy machinery was used. All of the
of the foods for small mammals outside the buildings. The houses, porches, cellars, box-rooms, barn,
production grown at both sites is used for family needs.
and greenhouses will be referred as food-related buildings. The bathhouse and outside toolshed will
We investigated commensal habitats (according [12]) clustered into three groups. From here on,
be referred to as outbuildings, they had no foods available for the small mammals. With some
the gardens, vegetable gardens, and orchard will be referred to as gardens, providing main amount of
country-based specifics, these commensal habitats are similar to home gardens [37], kitchen gardens
the foods for small mammals outside the buildings. The houses, porches, cellars, box-rooms, barn,
[28], urban community gardens [33,34,36], and suburban yards [9].
and greenhouses will be referred as food-related buildings. The bathhouse and outside toolshed
will be referred to as outbuildings, they had no foods available for the small mammals. With some
2.2. Small Mammal Trapping and Evaluation
country-based specifics, these commensal habitats are similar to home gardens [37], kitchen gardens [28],
urbanSmall mammals
community were[33,34,36],
gardens trapped using 20 snap traps
and suburban yards (7 [9].× 14 cm) that were baited with brown
bread crust and raw sunflower oil for each site. Removal trapping was intentionally used by
2.2. Smallowners,
territory Mammalwho Trapping and Evaluation
characterized rodent density as “non-acceptable”. Eight such sessions (25–29
July, Small
07–09mammals
and 24–27were August, 17–18,
trapped and2026–28
using snapSeptember,
traps (7 × 14 01–02,
cm) 11–13, andbaited
that were 15–17 with
November)
brown
bread crust and raw sunflower oil for each site. Removal trapping was intentionally used by 25–26
were used at Site 1, while five sessions (10–11 August, 9–11 September, 08–10, 20–21, and of
territory
October)who
owners, at Site 2. Traps were
characterized set randomly,
rodent density as covering all habitats
“non-acceptable”. of both
Eight suchsites, inside
sessions and outside
(25–29 the
July, 07–09
buildings. The total trapping effort was 720 trap days (500 trap days at Site
and 24–27 August, 17–18, and 26–28 September, 01–02, 11–13, and 15–17 November) were used at 1 and 220 trap days at
Site 2).
Site 1, while five sessions (10–11 August, 9–11 September, 08–10, 20–21, and 25–26 of October) at Site 2.
TrapsSnap-traps were setcovering
were set randomly, for the whole length
all habitats of above-mentioned
of both sessions
sites, inside and outside theand checkedThe
buildings. several
total
times per day. The relative abundance of small mammals (RA) was expressed
trapping effort was 720 trap days (500 trap days at Site 1 and 220 trap days at Site 2). as standard capture
ratesSnap-traps
to number were
of animals/100
set for the trap
wholedays. Theofcorrection
length of relative
above-mentioned abundance
sessions for sprung
and checked trapstimes
several was
not day.
per usedThe
duerelative
to the frequent
abundance trapof
checking and bait change
small mammals (RA) was as expressed
required. as standard capture rates to
number of animals/100 trap days. The correction of relative abundance for sprung traps was not used
due to the frequent trap checking and bait change as required.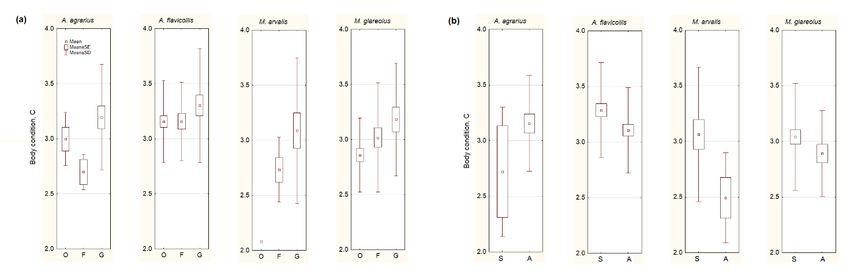
Animals 2020, 10, 856 4 of 15
Species were morphologically identified, with specimens of Microtus voles being identified by their
dental characteristics. We recorded body mass and body length before dissection. During dissection,
age groups (adults, sub-adults and juveniles) were identified based on their body weight, the status of
sex organs, and atrophy of the thymus, the latter of which decreases with animal age [40].
Body condition index C, based on body weight in g (Q) and body length in mm (L), was calculated
according to Moors [41].
C = (Q/L 3 ) × 10 5 (1)
Body condition and its seasonal changes were compared to published data, recalculated if
required [15,18,42–44].
Breeding failures were evaluated as the percentage of pregnancies with non-implanted or resorbed
embryos from all registered pregnancies. The numbers of embryos, corpora lutea and the numbers
of fresh placental scars were counted under dissection. The observed litter size was defined as the
number of viable (non-resorbing) embryos or fresh placental scars, while potential litter size as the
numbers of corpora lutea (as in [40]). We treated the difference between the numbers of corpora lutea
and the numbers of placental scars as non-implantation, while the difference between the numbers of
embryo and corpora lutea as embryo resorption. We also directly counted resorbed embryos, with the
latter being smaller than the rest of the embryos in the uterus, dark in colour, or already partially
disintegrated. The reproductive status of males was judged from the appearance and size of the
genitals; full epididymis show active spermatogenesis. After breeding, the testes and related glands
became slumped, slate-coloured, and diminish in size [40].
The study was conducted in accordance with Lithuanian (the Republic of Lithuania Law on the
Welfare and Protection of Animals No. XI-2271) and European legislation (Directive 2010/63/EU) on the
protection of animals. In Lithuania, there is no need or obligation to obtain permission or approval to
snap trap small mammals. This is especially relevant to the trapping of rodents in the private property,
which was the case.
2.3. Data Analysis
Data from both sites were combined for the analyses. Small mammal diversity was evaluated
while using log2 based on the Shannon–Wiener diversity index (H), dominance using the dominance
index (D) and species richness as the number of trapped species (S) [45,46]. These indices were
compared to the results of the other investigations [14,15,18].
Diversity estimates were calculated in PAST ver. 2.17c (Ø. Hammer, D.A.T. Harper, Oslo,
Norway) [46], using individual-based data to produce species accumulation curves. The rarefaction
approach eliminated the influence of the trapping effort [18]. Differences in community composition
were evaluated while using chi-square statistics in PAST. Differences in relative abundance were tested
using Student’s t statistics. The significance level was set as p < 0.05.
Between-species differences in the body condition index were assessed using ANOVA,
while dependence on season, habitat, age, and gender in most numerous species using GLM main
effects ANOVA. All of these calculations were done in Statistica for Windows, ver. 6.0 (StatSoft, Inc.,
Tulsa, OK, USA) [47].
3. Results
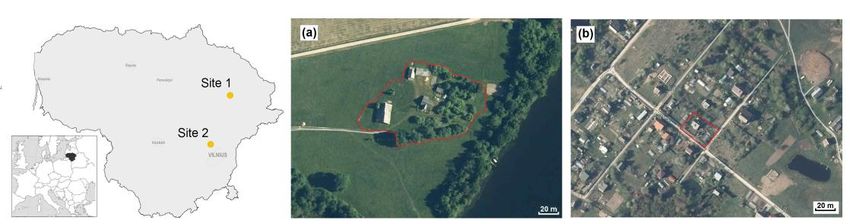
Seven species of small mammals were trapped in commensal habitats (Table 1). The dominant
species was yellow-necked mouse (Apodemus flavicollis), accounting for 43.4% of all trapped individuals.
This was followed by bank vole (Myodes glareolus), with 33.1%, and then striped field mouse
(Apodemus agrarius) and common vole (Microtus arvalis), these each accounting for about 10% of
all trapped individuals. Common shrew (Sorex araneus) and pygmy shrew (Sorex minutus) were not
numerous and only a single house mouse (Mus musculus) individual was trapped.Animals 2020, 10, 856 5 of 15
The highest RA was characteristic to A. flavicollis, averaging 13.4 (range 5.0–27.0) ind. per 100
trap days, significantly exceeding that of A. agrarius (0–16.7 ind. per 100 trap days; t = 3.16, df = 21,
p < 0.005) and M. arvalis (0.00–12.5 ind. per 100 trap days; t = 4.49, df = 21, p < 0.001). M. glareolus was
in second place by RA (on average 9.3 (0–42.0) ind. per 100 trap days), no significant differences with
the other species (Table 1).
Seasonally, the average RA constantly decreased from 72 ind. per 100 trap days in July to 18.3 ind.
per 100 trap days in November (the effect of season being significant, F4,7 = 6.23, p < 0.02).
Gender structure was dominated by males in A. agrarius (χ2 = 4.98, p < 0.05), A. flavicollis,
and M. glareolus (differences not significant). Juveniles dominated the age groups in both vole species
and A. agrarius (Table 1).
Table 1. Composition of the anthropophilic small mammal communities in commensal habitats.
Habitats Total
Species
G F O N (%) ♂♂:♀♀ Ad:Sub:Juv RA ± SE
Apodemus agrarius 21 2 5 28 (11.2) 22:6 7:7:14 4.9 ± 1.8
Apodemus flavicollis 30 24 55 109 (43.4) 63:46 48:48:13 13.4 ± 2.0
Mus musculus 0 1 0 1 (0.4) 0:1 0:1:0 0.2 ± 0.2
Microtus arvalis 17 7 1 25 (10.0) 11:14 6:1:18 2.9 ± 1.2
Myodes glareolus 21 31 31 83 (33.1) 51:32 19:19:45 9.3 ± 3.6
Sorex araneus 1 3 0 4 (1.6) 3:1 1.0 ± 0.8
Sorex minutus 0 0 1 1 (0.4) 0:1 0.3 ± 0.3
Total, N 90 68 93 251
Species number, S 5a 6a 5a 7
Diversity, H 2.02 a 1.82 a,b 1.34 c 1.89
Dominance, D 0.26 a 0.35 b 0.46 c 0.32
G: garden habitats, F: buildings where food is available, O: outbuildings, not related to food sources. Ad: adult,
Sub: subadult, Juv: juvenile animals. RA: the relative abundance of the species, expressed as individuals per 100
trap days. a,b,c Superscripts show the differences in the number of trapped species, diversity, and dominance in the
community (different letter—p < 0.05).
3.1. Diversity and Dominance in Relation to Food Sources (Habitat)
The number of species of small mammals trapped in gardens, food-related buildings, and in
outbuildings did not differ significantly (Table 1). However, species composition was different
(χ2 = 57.08, df = 12, p < 0.001). Diversity was lowest in the outbuildings, while it was significantly
higher in the buildings with food available. The dominance index, being related to differences in the
proportions of species, was different in all three habitat groups at p < 0.05.
Garden habitats were dominated by A. flavicollis (33.3% of all trapped individuals), with A. agrarius,
M. glareolus, and M. arvalis having similar proportions (Table 1). Food-related buildings were dominated
by M. glareolus (45.6%), which, together with A. flavicollis, accounted for over 80% of all catch.
The outbuildings were dominated by A. flavicollis (59.1% of all trapped individuals), which together
with M. glareolus accounted for over 90% of all catch. Thus, our first prediction failed.
3.2. Seasonal Changes in the Small Mammal Community
Towards winter, changes in the small mammal communities in commensal habitats were observed.
The number of trapped species increased in September and further in November (Table 2). A significant
diversity increase was observed in November (as compared to September, t = 2.06, p < 0.05); this was
also supported by rarefaction, thus excluding influence of sample size (Figure 2a). Proportion of
A. flavicollis increased, with a maximum in November (Figure 2b), while the proportion of M. glareolus
decreased, with a minimum in November (Table 2).Animals2020,
Animals 2019,10,
9, x856
FOR PEER REVIEW 6 6ofof1515
Table 2. Changes
Table in the composition
2. Changes in the small
in the composition in themammal community
small mammal in homesteads.
community in homesteads.
Species
Species July
July August
August September
September November
November
Apodemus agrarius
Apodemus agrarius 2 2 2 2
Apodemus flavicollis
Apodemus flavicollis 27
27 2323 15 15 18 18
Mus
Musmusculus
musculus 1 1
Microtus
Microtusarvalis
arvalis 33 1616 1 1 3 3
Myodes glareolus 42 13 12 6
Myodes glareolus 42 13 12 6
Sorex araneus 4
Sorex
Sorex araneus
minutus 4 1
Sorex
Total,minutus
N 72 52 30 1 35
SpeciesTotal,
number,N S 372a 523a 304 a 35 7 b
Diversity, H a b b c
Species number, S 1.183a 1.54
3a 41.45
a 7 b2.12
Dominance, a b b b
Diversity,DH 0.48 a
1.18 0.35b
1.54 0.42
1.45 b 2.120.32
c
a,b,c Differences of Dominance,
the number ofDtrapped species, diversity, and dominance of the community (different
0.48 a 0.35 b 0.42 b 0.32 b
letter—p < 0.05).
Differences of the number of trapped species, diversity, and dominance of the community
a,b,c
(different letter—p < 0.05).
A. flavicollis and M. glareolus in the autumn were both mostly recorded in the outbuildings
(69.7%A.and
flavicollis
83.3% and M.specimens)
of all glareolus inand,
the in
autumn were
smaller both mostly
numbers, in the recorded
buildingsin the food
with outbuildings
available
(69.7% and 83.3% of all specimens) and, in smaller numbers, in the buildings with food
(21.2% and 11.1%). The gardens in the autumn were also not attractive to other species, only one available
(21.2% andof11.1%).
individual both A.The gardens
agrarius and in the autumn
S. araneus werewere alsothere
trapped not attractive to other species, only one
(Figure 2c).
individual of both A. agrarius and S. araneus were trapped there (Figure 2c).
Figure 2.2. Small
Figure Small mammal
mammal species
species accumulation curves (a):
accumulation curves (a): A—July,
A—July, B—August,
B—August,C—September,
C—September,
D—November, seasonal species share (b), and composition by habitats in autumn (c):
D—November, seasonal species share (b), and composition by habitats in autumn (c): G—garden G—garden
habitats, F—buildings where food for animals is available, O—outbuildings, not related
habitats, F—buildings where food for animals is available, O—outbuildings, not related toto food sources.
food
sources.
3.3. Body Condition of Small Mammals
Between-species
3.3. Body differences
Condition of Small of body condition were significant (ANOVA, F6,244 = 4.06, p < 0.001;
Mammals
Table 3). A multivariate test of the cumulative influence of season, habitat, gender, and age on the
Between-species differences of body condition were significant (ANOVA, F6,244 = 4.06, p < 0.001;
body condition of the most abundant species showed that, in A. flavicollis, a significant dependence
Table 3). A multivariate test of the cumulative influence of season, habitat, gender, and age on the
was on the season (F = 8.62, p < 0.001) and age (F = 3.88, p < 0.05), while in M. glareolus on the habitat
body condition of the most abundant species showed that, in A. flavicollis, a significant dependence
(F = 3.47, p < 0.05) and age (F = 10.83, p < 0.001). No differences in body condition between males and
was on the season (F = 8.62, p < 0.001) and age (F = 3.88, p < 0.05), while in M. glareolus on the habitat
females were found in any species. In A. flavicollis and M. glareolus, the highest body condition was
(F = 3.47, p < 0.05) and age (F = 10.83, p < 0.001). No differences in body condition between males and
found in juveniles. Other differences were not significant
females were found in any species. In A. flavicollis and M. glareolus, the highest body condition was
foundIrrespective of Other
in juveniles. species, the bodywere
differences condition of small mammals was the highest in the gardens
not significant
(F2,248 = 3.02, p = 0.05; Figure 3a). However, the univariate test showed significant differences just in
M. glareolus (F2,80 = 3.35, p < 0.05), so our second prediction failed.
A decrease of body condition in the autumn (Figure 3b) was observed in A. flavicollis (F1,107 = 3.31,
p < 0.05), M. arvalis (F1,23 = 3.94, p = 0.06), and, not in a significant trend, in M. glareolus (F1,81 = 1.73,
p = 0.19). A. agrarius showed a different trend, as its body condition increased in autumn, but not
significantly (F1,23 = 1.83, p = 0.19). Thus, the third of our predictions was confirmed in one species,
A. agrarius, but failed in the others.for animal gender and age.
Gender Age
Species N C
Male Female Ad Sub Juv
Apodemus agrarius 28 3.12 ± 0.08 3.09 ± 0.10 a 3.24 ± 0.13 a 3.13 ± 0.19 a 3.32 ± 0.23 a 3.03 ± 0.09 a
Animals 2020, 10, 856
Apodemus flavicollis 109 3.20 ± 0.04 3.15 ± 0.05 a 3.26 ± 0.07 a 3.11 ±0.05 a 3.21 ± 0.06 a 3.48 ± 0.16 b 7 of 15
Mus musculus 1 4.44 4.44 4.44
Microtus arvalis 25 2.95 ± 0.12 2.95 ± 0.19 a 2.95 ± 0.16 a 2.57 ± 0.12 a 3.16 3.06 ± 0.16 a
Table 3. Body
Myodes glareolus
condition (C ± SE) of the
83 3.00 ± 0.05 2.92 ± 0.07
small
a mammals
3.12 ± 0.07
in
a the commensal
2.74 ± 0.07 a habitats
2.80 ± 0.09
and
a breakdown for
3.20 ± 0.07 b
animal gender
Sorex araneus and
4 age.
2.80 ± 0.24 2.98 ± 0.24 2.29
Sorex minutus 1 3.82 3.82
Gender Age
Species N Juv: juvenile
C
Ad: adult, Sub: subadult, animals. a,b Differences between males and females and
Male Female Ad Sub Juv
between age groups (different letter—p < 0.05). a a a a
Apodemus agrarius 28 3.12 ± 0.08 3.09 ± 0.10 3.24 ± 0.13 3.13 ± 0.19 3.32 ± 0.23 3.03 ± 0.09 a
a a a a
Irrespective of species, the body condition of small mammals was the highest in the gardens
Apodemus flavicollis 109 3.20 ± 0.04 3.15 ± 0.05 3.26 ± 0.07 3.11 ±0.05 3.21 ± 0.06 3.48 ± 0.16 b
Mus musculus 1 4.44
(F2,248 = 3.02, p = 0.05; Figure 3a). However, the univariate 4.44 4.44
test showed significant differences just in a
Microtus arvalis 25 2.95 ± 0.12 2.95 ± 0.19 a 2.95 ± 0.16 a 2.57 ± 0.12 a 3.16 3.06 ± 0.16
M. glareolus (F 2,80 = 3.35, p < 0.05), so our second prediction
Myodes glareolus 83 3.00 ± 0.05 2.92 ± 0.07 a failed.
3.12 ± 0.07 a 2.74 ± 0.07 a 2.80 ± 0.09 a 3.20 ± 0.07 b
A decrease of body condition
Sorex araneus 4 2.80in the autumn
± 0.24 (Figure 3b)
2.98 ± 0.24 2.29 was observed in A. flavicollis (F1,107 =
3.31, p < Sorex
0.05),minutus
M. arvalis (F11,23 = 3.94,
3.82
p = 0.06), and, not in a3.82
significant trend, in M. glareolus (F1,81 =
a,b Differences between males and females and between age groups
1.73, pAd:
= 0.19).
adult,A. agrarius
Sub: showed
subadult, a different
Juv: juvenile animals.trend, as its body condition increased in autumn, but
(different letter—p < 0.05).
not significantly (F1,23 = 1.83, p = 0.19). Thus, the third of our predictions was confirmed in one
species, A. agrarius, but failed in the others.
Figure 3. Body condition of the most numerous small mammals depending on the habitat (a):
Figure 3. Body condition of the most numerous small mammals depending on the habitat (a): G
G represents garden habitats, F—buildings where food for animals is available, O—outbuildings,
represents garden habitats, F—buildings where food for animals is available, O—outbuildings, not
not related to food sources, and on season (b): S—summer, A—autumn. Central point shows average
related to food sources, and on season (b): S—summer, A—autumn. Central point shows average
values, box—SE,
values, box—SE, whiskers—SD.
whiskers—SD.
3.4. Breeding of Small Mammals in the Commensal Habitats
3.4. Breeding of Small Mammals in the Commensal Habitats
Out of 50 recorded breeding cases, 80% were in summer: in total, 21 in July, 19 in August, seven in
Out of 50 recorded breeding cases, 80% were in summer: in total, 21 in July, 19 in August, seven
in September, one
September, one inin October,
October,andandtwotwo in in November.
November. Most
Most ofanimals
of the the animals in breeding
in breeding condition
condition were were
trappedinin
trapped thethe outbuildings
outbuildings (21 (21 case),
case), whilewhile 16 cases
16 cases were were in gardens,
in gardens, and 13and
cases13incases in buildings
buildings with with
available food.
available food.
Breeding
Breeding failures
failures (16.7–100%
(16.7–100% ofregistered
of all all registered pregnancies)
pregnancies) were recorded
were recorded in all species,
in all species, thus thethus the
potentiallitter
potential litter size
size was
was larger
larger thanthan
thatthat observed
observed (Table
(Table 4). However,
4). However, these differences
these differences were notwere not
statistically
statisticallysignificant.
significant.Thus, ourour
Thus, fourth prediction
fourth should
prediction be confirmed
should and may
be confirmed andbemay significant with with a
be significant
abigger
bigger sample
sample size.size.
Table 4. Breeding data of the most abundant small mammals from the commensal habitats.
Litter Size, Young ± SE Disturbances,
Species N Males Females
Potential Observed %
Apodemus agrarius 3 2 1 7.0 5.0 100
Apodemus flavicollis 25 14 11 7.5 ± 1.5 6.7 ± 1.1 50.0
Microtus arvalis 5 5 6.0 ± 0.4 5.6 ± 0.7 20.0
Myodes glareolus 17 11 6 5.7 ± 0.8 4.5 ± 0.9 16.7%Animals 2020, 10, 856 8 of 15
4. Discussion
In the situation of intensifying anthropogenic activities worldwide [48], natural habitats are
transformed. Currently, urban development covers ca. 5% of the world, with residential yards covering
much of the area [9]. Anthropogenic changes of habitats create new challenges and pressure on wildlife.
Organisms are exposed to modified environments, which results in a loss of biodiversity, changes
in communities, and at the individual level [49]. Though many mammal species successfully thrive
in this novel environment, it is still not clear which traits enable their survival and persistence [38].
Small mammals referred as pests, such as rats or house mice, exhibit plasticity to sudden changes,
depending on human activity and fluctuation of resources [1]. Moreover, migrations between
agricultural environments and surrounding habitats are characteristic to small mammals [1,18],
buffering anthropogenic pressure.
While the urban environment is being evaluated in terms of anthropogenic disturbance, including
that to small mammals [4,8,10,11,16,20–22,27,50], these groups are not being extensively studied in
farmsteads, homesteads, and kitchen gardens [5,9,14,15,26]. It must be recognized that the homestead
environment is subjected to unpredictable and unseasonal changes, resulting in fluctuating resources [1].
Most species suffer from urbanization and intensification of agriculture, followed by fragmentation
of habitats, declines in gardening, and reduced availability of natural habitats [51,52], though a few may
have no negative effects [53,54]. Our results show that the diversity of small mammals in homesteads
was reduced, breeding disturbances were common, and body condition of most species was worse
than in commercial orchards.
4.1. Species Composition and Diversity of Small Mammal Communities in the Other Homesteads and
Commercial Orchards
A comparison of the obtained results with previously published data from the indoor environment
of homestead buildings (site B, [14] and site C, [15]), as well as commercial fruit orchards (D, data from
several sites pooled), berry plantations (E) and neighboring natural meadows (F) in Lithuania [18],
showed several differences (Figure 4). In these earlier investigated homesteads, small mammals were
trapped in the buildings where food was available—living houses, larders, porches, cellars, box-rooms,
and barns. Fruit orchards, berry plantations, and surrounding meadows were used as the habitats
most similar to the gardens in our investigation.
Species accumulation curves (Figure 4a) showed the poorest diversity in homesteads at sites A
and C and berry plantations (E), while the highest values of the diversity index were found in the
homestead at site B with the longest period of investigations, as well as fruit orchards (D) and meadows
(F). The differences of diversity index B > A, D > A, F > A, and C < A were significant (p < 0.01 and
lower). Similarly, small mammal communities in sites B, D, and F were most polydominant, with the
differences of dominance index between sites B < A, D < A, F < A, C > A, and E > A significant (p < 0.05
and lower).
The number of trapped species (10) was the highest in the homestead buildings of site B with the
longest trapping time (four seasons), significantly exceeding all other sites (p < 0.05) where the number
of small mammal species was similar, 7–9 (Figure 4b). Site B was the only place where two species of
rats, R. norvegicus and R. rattus, were found in numbers.
In the commensal habitats (site A, current investigation), the dominant species was A. flavicollis,
accounting for 43.4% of all trapped individuals, while M. musculus was dominant in the buildings of
sites B and C (36.7% and 73.8%, respectively), M. arvalis in berry plantations (E)—(50.6%), and A. agrarius
in fruit orchards (D) and meadows (F) (24.1% and 36.8%, respectively). M. glareolus (Figure 4b) was
also among best represented species.Animals 2020, 10, 856 9 of 15
Animals 2019, 9, x FOR PEER REVIEW 9 of 15
(a) (b)
Figure 4. Small
Figure Small mammal
mammal species accumulation
species curves
accumulation with confidence
curves intervalsintervals
with confidence (a) and species
(a) and share
species
(b). Sites:
share A—this
(b). Sites: research,
A—this B—homestead
research, B—homesteadbuildings, 1999–2003
buildings, [14], [14],
1999–2003 C—homestead
C—homestead buildings,
buildings,
2012–2014 [15],
2012–2014 [15],D—commercial
D—commercial fruit
fruit orchards,
orchards, 2018 2018 [18], E—berry
[18], E—berry plantations,
plantations, 2018 [18],2018 [18],
F—meadows
F—meadows near orchards and plantations,
near orchards and plantations, 2018 [18]. 2018 [18].
In the
For commensalinhabitats
comparison, UK, four(site A, current
small mammal investigation), the dominant
species, namely species(Apodemus
wood mouse was A. flavicollis,
sylvaticus),
accounting for 43.4% of all trapped individuals, while M. musculus was dominant
field vole (Microtus agrestis) M. musculus and M. glareolus, were recorded in sheep and pig farms in the buildings of [55],
sites B and C (36.7% and 73.8%, respectively), M. arvalis in berry plantations
while a study of residential UK gardens only showed two species, A. sylvaticus and M. glareolus [4]. (E)—(50.6%), and A.
agrarius
An earlierinstudy
fruit orchards
of Dickman (D) [56]
and inmeadows
UK urban (F)environment
(24.1% and 36.8%,
showed respectively). M. glareolus
a low diversity of small(Figure
mammals
4b) was also among best represented species.
in urban allotments and the gardens of semi-detached houses (3–4 species), with higher diversities
For comparison, in UK, four small mammal species, namely wood mouse (Apodemus sylvaticus),
in urban orchards and larger gardens (8–9 species). A limited trapping effort in farms and houses in
field vole (Microtus agrestis) M. musculus and M. glareolus, were recorded in sheep and pig farms [55],
Hungary yielded three species—M. musculus, R. norvegicus, and under-represented M. minutus [27].
while a study of residential UK gardens only showed two species, A. sylvaticus and M. glareolus [4].
Of seven species recorded indoors in Chernogolovka research station in Russia, the dominant was
An earlier study of Dickman [56] in UK urban environment showed a low diversity of small
M. musculus, while out of six species trapped in outside gardens, the dominant was sibling vole
mammals in urban allotments and the gardens of semi-detached houses (3–4 species), with higher
diversitiesrossiaemeridionalis)
(Microtus in urban orchards [7]. andIn general,
larger the most
gardens widely distributed
(8–9 species). synantropic
A limited trapping effort rodent
in farms species
and in
Russia are R. norvegicus, M. musculus, A. agrarius, M rossiaemeridionalis,
houses in Hungary yielded three species—M. musculus, R. norvegicus, and under-represented M. and M. arvalis [13].
Trapping
minutus [27]. Ofin seven
various urbanrecorded
species habitats,indoors
including buildings, yielded
in Chernogolovka 13 rodent
research stationand shrew species
in Russia, the
in Nitra, Slovakia,
dominant dominated
was M. musculus, while M. of
by out arvalis, whichtrapped
six species accounted for 42%
in outside of individuals
gardens, the dominant[22]. was
In Riga,
Latvia,
sibling nine
volerodent
(Microtusspecies were found, being
rossiaemeridionalis) dominated
[7]. In general, bytheA. agrarius,
most widelyaccounted
distributedfor 37.7% in unbuilt
synantropic
zones.
rodentNo shrews
species in were
Russiareported [16], but inM.
are R. norvegicus, downtown
musculus, Chelm in Poland,
A. agrarius, four shrews and
M rossiaemeridionalis, fiveM.voles
and
arvalisM.
(with arvalis being most represented) were reported and three species of Apodemus mice—A. agrarius,
[13].
Trapping
A. flavicollis, andin A.
various urbanrepresenting
sylvaticus, habitats, including
no lessbuildings,
than 93%yielded 13 rodent and
of all individuals shrew species in
[21].
Nitra, Slovakia, dominated by M. arvalis, which accounted
Differences in the small mammal community composition may vary between for 42% of individuals [22]. In localities,
Riga,
Latvia, nine
“reflecting rodenthuman
regional species behaviours,
were found,cultures,
being dominated by A. agrarius,
and technologies” accounted
[1]. Buildings infor
the37.7% in
homesteads
unbuilt zones. No shrews were reported [16], but in downtown Chelm in Poland,
represent novel habitats, related to the degree of human influence, and favoring different small mammal four shrews and
five voles
species (with
[57]. NotM. arvalis
only being most
the intense represented)
competition werefluctuating
for the reported and three species
resource, but alsoofmovements
Apodemus of
mice—A. agrarius, A. flavicollis, and A. sylvaticus, representing no less
so called “occasional commensals” between houses and outdoor habitats constantly changes than 93% of all individuals [21].their
Differences in the small mammal community composition may vary between localities,
communities [1,55]. In some cases, even arboreal small mammals may invade indoor habitats.
“reflecting regional human behaviours, cultures, and technologies” [1]. Buildings in the homesteads
When households are close to the natural habitats of the edible dormouse (Glis glis) and the garden
represent novel habitats, related to the degree of human influence, and favoring different small
dormouse (Eliomys quercinus), these species easily penetrate into the houses, causing problems [58].
mammal species [57]. Not only the intense competition for the fluctuating resource, but also
movements
4.2. of so called
Body Condition of Small “occasional
Mammalscommensals”
in CommensalbetweenHabitats,houses
SeasonalandChanges
outdoorand habitats constantly
Importance
changes their communities [1,55]. In some cases, even arboreal small mammals may invade indoor
For comparison,
habitats. When households published data to
are close [15]
theornatural
recalculated
habitatsdata from
of the [18] on
edible the body(Glis
dormouse condition
glis) andof the
several
small
garden mammal
dormouse species from homesteads
(Eliomys and commercial
quercinus), these species easilyorchards were into
penetrate usedthe(Table 5). The
houses, similarity
causing
of the body[58].
problems condition of the same species between the compared homesteads is obvious (see Table 3).
In more natural habitats (commercial orchards, berry plantations, and neighbouring control meadows),
the body conditions of the rodents were higher, however not significantly.Animals 2020, 10, 856 10 of 15
In general, body condition is considered as a proxy of animal health and fitness [59,60], depending on
the food supply [61] and raising the chances of reproductive success [62]. While a decrease in body
mass might depend on the Bartonella presence [63], it is still not clear whether poor body condition is
a cause or consequence of pathogen infection [64]. In our study, pathogen analysis of the collected
material will follow later.
Table 5. Comparison of the body condition (C ± SE) of small mammals in fruit orchards, buildings and
natural habitats of Lithuania.
HM 1 FO 2 BP 2 NM 2
Species A–W S A S A S A
Apodemus agrarius 2.95 ± 0.42 3.26 ± 0.07 3.94 3.47 ± 0.10# 3.75 ± 0.25 3.30 ± 0.06 #
A. flavicollis 3.17 ± 0.10 3.24 ± 0.06 3.48 ± 0.21 3.55 ± 0.12 3.43 ± 0.13 3.33 ± 0.07
Mus musculus 3.39 ± 0.05 - - 4.02 - - 4.00
Microtus arvalis - 3.28 ± 0.17 3.38 ± 0.08 3.73 ±0.05 3.21 ± 0.08 * 3.80 ± 0.17 3.18 ± 0.11 *
Myodes glareolus 2.99 ± 0.35 3.48 ± 0.14 3.23 ± 0.09 - 2.98 3.09 ± 0.20 3.02 ± 0.11
Habitats: HM—homesteads, FO—fruit orchards, BP—berry plantations, NM—meadows near orchards and
plantations; season: S—summer, A—autumn, W—winter; data sources: 1 [15]; 2 [18]. Significant decreases at p <
0.05 marked with *, trend at p < 0.10 with #.
In the natural habitats, a seasonal decrease of body condition in autumn and winter was
characteristic to A. flavicollis [42], M. glareolus (recalculated from [43]), and M. arvalis (recalculated
from [44]). Significant decreases of body condition towards winter also were observed in rodents that
were trapped in berry plantations and meadows. However, body condition increased in A. flavicollis
and M. arvalis from the commercial fruit orchards (not significantly).
While a decrease of body mass and, consequently, body condition, is a mechanism ensuring better
survival of voles in winter [65,66], this is not the rule. For example, in the short-lived Octodon degus,
adult survival was directly related to body condition in males and females [67].
The decline in small mammal abundance in autumn in the commensal habitats was possibly
influenced by several factors—outweighing natural population growth, the recorded declines were
likely caused by the trapping, and, as available foods decreased sharply immediately after harvest,
possibly by emigration. We have no data on the levels of movement between the gardens and
surrounding territories, but based on the configuration of sites, we presume that some emigration and
immigration of small mammals might have occurred at Site 1, while it was probably limited at Site 2.
4.3. Breeding Failures in Rodents under Anthropogenic Impact
Reproduction in small mammals depends on several factors: the availability of food [68],
population density [59,69], stress [69], and body size [70]. Interspecies and intraspecies variations are
also known and significant [71]. In a period of shortage of acorns, fat dormouse (Glis glis) respond
by increasing resorption rates [68]. However, a larger litter size in M. glareolus was related to life
in risky environments and increasing population densities [69], and with bigger body length in
M. arvalis [70]. Such a multi-sided dependency limits the possibility of multidimensional statistical
analysis (large sample sizes required) and comparisons across habitats, as important factors may be
omitted. According to [39], we expected a higher reproductive output in the habitats with a higher
degree of anthropogenic activities and, consequently, a higher level of disturbance.
In Lithuania, we found that litter sizes in the commercial orchards (Table 6) were lower than those
in homesteads (see Table 4). However, there were no significant differences between potential and
observed litter size in homesteads and in commercial orchards, or between these habitats. Breeding
failures (percentage of the pregnancies with non-implantations or resorptions) were recorded in all
species. The proportions of disturbed pregnancies in mice were higher in the homestead, while those
in voles were higher in commercial orchards. Thus, based on the litter size and breeding failures,
we might expect both food availability and disturbance levels to be higher in the homesteads.Animals 2020, 10, 856 11 of 15
Table 6. Breeding data of most abundant small mammals from commercial orchards (recalculated
from [18]).
Litter Size, Young ± SE
Species Disturbances, %
Potential Observed
Apodemus agrarius 6.57 ± 0.53 6.29 ± 0.52 28.6
Apodemus flavicollis 6.50 ± 0.57 6.33 ± 0.57 14.3
Microtus arvalis 5.51 ± 0.22 5.02 ± 0.22 43.9
Myodes glareolus 5.43 ± 0.53 5.14 ± 0.52 28.6
According to [1], local environments are frequently repopulated after population crashes in
fluctuating environments (both homesteads and commercial gardens in our case). Thus, higher
fecundity gives a definite advantage to anthropo-related taxa, as they must frequently re-start from
low numbers.
4.4. Significance of Small Mammal Studies in Commensal Habitats
The importance of studies of small mammal species composition in homesteads and kitchen gardens
is connected with urban development [19], which in some countries includes the expansion of residential
gardens [53], as well as with rodent damage and development of control measures [55,72], and problems
with pathogen transmission by synantropic, agrophilic and peridomestic rodents [25,27,28,32,73].
For example, M. glareolus, being the second by numbers in the homestead, was found carrying
the human pathogenic Puumala virus in East Lithuania [74]. According to [39], our results will
contribute to an understanding of the ability of small mammals to persist under anthropogenic pressure
(differences between species in the use of resources, adaptation patterns, and selection of traits) and
ensuring cohabitation.
In the future, we plan to evaluate the isotopic niches of rodents from commensal habitats (as a
proxy to their diet) and the accumulation of various chemical elements in their bodies, thereafter
to compare to both the values found in rodents from different habitats. Future studies should seek
to quantify in more detail the availability of food resources, levels of disturbance, and other factors
that may influence small mammals to better understand patterns in their abundance and diversity in
commensal habitats.
5. Conclusions
1. Out of seven small mammal species recorded in the commensal habitats, A. agrarius, A. flavicollis,
M. arvalis, and M. glareolus may be referred as anthropophilic.
2. Gardens and outbuildings were, by numbers and relative abundance, dominated by A. flavicollis,
while buildings with food available by M. glareolus.
3. The number of recorded species and diversity significantly increased in the autumn months.
4. Body condition was the highest in rodents trapped in the homestead gardens, and it decreased in
the autumn (with the exception of A. agrarius).
5. Breeding failures were registered in all of the most numerous species of rodents from homesteads.
Author Contributions: Conceptualization, L.B. (Laima Balčiauskienė); Formal analysis, L.B. (Linas Balčiauskas);
Investigation, L.B. (Linas Balčiauskas) and L.B. (Laima Balčiauskienė); Writing—original draft, L.B. (Linas Balčiauskas)
and L.B. (Laima Balčiauskienė). All authors have read and agreed to the published version of the manuscript.
Funding: This research received no external funding.
Acknowledgments: Our sincere thanks to Ida Šaltenienė, who initialized this project and trapped small mammals
in her property, and to Jos Stratford for checking the language.
Conflicts of Interest: The authors declare no conflict of interests.Animals 2020, 10, 856 12 of 15
References
1. Hulme-Beaman, A.; Dobney, K.; Cucchi, T.; Searle, J.B. An ecological and evolutionary framework for
commensalism in anthropogenic environments. Trends Ecol. Evol. 2016, 31, 633–645. [CrossRef] [PubMed]
2. Martin, L.J.; Adams, R.I.; Bateman, A.; Bik, H.M.; Hawks, J.; Hird, S.M.; Hughes, D.; Kembel, S.W.; Kinney, K.;
Kolokotronis, S.-O.; et al. Evolution of the indoor biome. Trends Ecol. Evol. 2015, 30, 223–232. [CrossRef]
3. Cavia, R.; Muschetto, E.; Cueto, G.R.; Suárez, O.V. Commensal rodents in the City of Buenos Aires: A temporal,
spatial, and environmental analysis at the whole city level. EcoHealth 2015, 12, 468–479. [CrossRef] [PubMed]
4. Baker, P.J.; Ansell, R.J.; Dodds, P.A.A.; Webber, C.E.; Harris, S. Factors affecting the distribution of small
mammals in an urban area. Mammal Rev. 2003, 33, 95–100. [CrossRef]
5. Baker, S.E.; Maw, S.A.; Johnson, P.J.; Macdonald, D.W. Not in My Backyard: Public Perceptions of Wildlife
and ‘Pest Control’ in and around UK Homes, and Local Authority ‘Pest Control’. Animals 2020, 10, 222.
[CrossRef]
6. Stenseth, N.C.; Leirs, H.; Skonhoft, A.; Davis, S.A.; Pech, R.P.; Andreassen, H.P.; Singleton, G.R.; Lima, M.;
Machang’u, R.S.; Makundi, R.H.; et al. Mice, rats, and people: The bio-economics of agricultural rodent
pests. Front. Ecol. Environ. 2003, 1, 367–375. [CrossRef]
7. Tikhonova, G.N.; Tikhonov, I.A.; Bogomolov, P.L.; Davydova, L.V. Certain aspects of interactions between
cohabiting sibling species Microtus arvalis and M. rossiaemeridionalis. Biol. Bull. 2006, 33, 59–64. [CrossRef]
8. Gortat, T.; Barkowska, M.; Gryczyńska-Siemia˛ Tkowska, A.; Pienia˛żek, A.; Kozakiewicz, A.; Kozakiewicz, M.
The Effects of Urbanization—Small Mammal Communities in a Gradient of Human Pressure in Warsaw City,
Poland. Pol. J. Ecol. 2014, 62, 163–172. [CrossRef]
9. Kays, R.; Parsons, A.W. Mammals in and around suburban yards, and the attraction of chicken coops.
Urban Ecosyst. 2014, 17, 691–705. [CrossRef]
10. Lambert, M.; Vial, F.; Pietravalle, S.; Cowan, D. Results of a 15-year systematic survey of commensal rodents
in English dwellings. Sci. Rep. 2017, 7, 1–12. [CrossRef]
11. Langton, S.D.; Cowan, D.P.; Meyer, A.N. The occurrence of commensal rodents in dwellings as revealed by
the 1996 English House Condition Survey. J. Appl. Ecol. 2001, 38, 699–709. [CrossRef]
12. Pocock, M.J.; Searle, J.B.; White, P.C. Adaptations of animals to commensal habitats: Population dynamics of
house mice Mus musculus domesticus on farms. J. Anim. Ecol. 2004, 73, 878–888. [CrossRef]
13. Khlyap, L.A.; Warshavsky, A.A. Synanthropic and agrophilic rodents as invasive alien mammals. Russ. J.
Biol. Invasions 2010, 1, 301–312. [CrossRef]
14. Atkočaitis, O. Small mammals trapped inside farmstead buildings. [Sodybos pastatuose sugauti smulkieji
žinduoliai]. Theriologia Lituanica 2003, 3, 57–61.
15. Balčiauskienė, L.; Balčiauskas, L.; Vitkauskas, V.; Podėnas, S. Indoor small mammals in Lithuania: Some
morphometrical, body condition, and reproductive characteristics. Zool. Ecol. 2015, 25, 305–313. [CrossRef]
16. Zorenko, T.; Leontyeva, T. Species Diversity and Distribution of Mammals in Riga. Acta Zool. Litu. 2003, 13,
78–86. [CrossRef]
17. Balčiauskas, L.; Mažeikytė, R.; Baranauskas, K. Diversity of mammals in the Vilnius city. Acta Biol. Univ.
Daugavp. 2005, 5, 55–66.
18. Balčiauskas, L.; Balčiauskienė, L.; Stirkė, V. Mow the Grass at the Mouse’s Peril: Diversity of Small Mammals
in Commercial Fruit Farms. Animals 2019, 9, 334. [CrossRef]
19. McKinney, M.L. Effects of urbanization on species richness: A review of plants and animals. Urban Ecosyst.
2008, 11, 161–176. [CrossRef]
20. Pienia˛żek, A.; Sokół, M.; Kozakiewicz, M. Ecological characteristics of two closely related rodent species in
urban environment—Permanent inhabitant vs. newcomer. Nat. Resour. 2017, 8, 69–80. [CrossRef]
21. Łopucki, R.; Kitowski, I. How small cities affect the biodiversity of ground-dwelling mammals and the
relevance of this knowledge in planning urban land expansion in terms of urban wildlife. Urban Ecosyst.
2017, 20, 933–943. [CrossRef]
22. Klimant, P.; Klimantová, A.; Baláž, I.; Jakab, I.; Tulis, F.; Rybanský, L’.; Vadel, L’.; Krumpálová, Z. Small
mammals in an urban area: Habitat preferences and urban-rural gradient in Nitra city, Slovakia. Pol. J. Ecol.
2017, 65, 144–157. [CrossRef]
23. Cavia, R.; Guidobono, J.S.; Fraschina, J.; Busch, M. Effects of physical barriers and eradication on recolonization
of rodents in poultry farms. Int. J. Pest Manag. 2019, 65, 370–380. [CrossRef]Animals 2020, 10, 856 13 of 15
24. Krijger, I.M.; Belmain, S.R.; Singleton, G.R.; Groot Koerkamp, P.W.; Meerburg, B.G. The need to implement
the landscape of fear within rodent pest management strategies. Pest Manag. Sci. 2017, 73, 2397–2402.
[CrossRef] [PubMed]
25. Hopkins, A.S.; Whitetail-Eagle, J.; Corneli, A.L.; Person, B.; Ettestad, P.J.; Dimenna, M.; Norstog, J.; Creswell, J.;
Khan, A.S.; Olson, J.G.; et al. Experimental evaluation of rodent exclusion methods to reduce hantavirus
transmission to residents in a Native American community in New Mexico. Vector-Borne Zoonot. 2002, 2,
61–68. [CrossRef]
26. Wahl-Jensen, V.; Radoshitzky, S.R.; de Kok-Mercado, F.; Taylor, S.L.; Bavari, S.; Jahrling, P.B.; Kuhn, J.H. Role
of rodents and bats in human viral hemorrhagic fevers. In Viral Hemorrhagic Fevers; Singh, S.K., Ruzek, D.,
Eds.; CRC Press: Boca Raton, FL, USA, 2013; pp. 99–127.
27. Hornok, S.; Földvári, G.; Rigó, K.; Meli, M.L.; Gönczi, E.; Répási, A.; Farkas, R.; Papp, I.; Kontschán, J.;
Hofmann-Lehmann, R. Synanthropic rodents and their ectoparasites as carriers of a novel haemoplasma and
vector-borne, zoonotic pathogens indoors. Parasites Vectors 2015, 8, 27. [CrossRef]
28. Bastien, M.; Vaniscotte, A.; Combes, B.; Umhang, G.; Germain, E.; Gouley, V.; Pierlet, A.; Quintaine, T.;
Forin-Wiart, M.-A.; Villena, I.; et al. Identifying drivers of fox and cat faecal deposits in kitchen gardens
in order to evaluate measures for reducing contamination of fresh fruit and vegetables. Food Waterborne
Parasitol. 2019, 14, e00034. [CrossRef]
29. Nau, L.H.; Emirhar, D.; Obiegala, A.; Mylius, M.; Runge, M.; Jacob, J.; Bier, N.; Nöckler, K.; Imholt, C.;
Below, D.; et al. Leptospirosis in Germany: Current knowledge on pathogen species, reservoir hosts, and
disease in humans and animals. Bundesgesundheitsblatt, Gesundheitsforschung, Gesundheitsschutz 2019, 62,
1510–1521. [CrossRef]
30. Vanwambeke, S.O.; Zeimes, C.B.; Drewes, S.; Ulrich, R.G.; Reil, D.; Jacob, J. Spatial dynamics of a zoonotic
orthohantavirus disease through heterogenous data on rodents, rodent infections, and human disease. Sci.
Rep. 2019, 9, 2329. [CrossRef]
31. Krawczyk, A.I.; Van Duijvendijk, G.L.; Swart, A.; Heylen, D.; Jaarsma, R.I.; Jacobs, F.H.; Fonville, M.;
Sprong, H.; Takken, W. Effect of rodent density on tick and tick-borne pathogen populations: Consequences
for infectious disease risk. Parasites Vectors 2020, 13, 1–17. [CrossRef]
32. Fischer, S.; Franke, A.; Imholt, C.; Gethmann, J.; Spierling, N.G.; Jacob, J.; Beer, M.; Hoffmann, D.; Ulrich, R.G.
Patchy Occurrence of Cowpox Virus in Voles from Germany. Vector-Borne Zoonotic Dis. 2020. [CrossRef]
[PubMed]
33. Hunter, C.M.; Williamson, D.H.Z.; Pearson, M.; Saikawa, E.; Gribble, M.O.; Kegler, M. Safe community
gardening practices: Focus groups with garden leaders in Atlanta, Georgia. Local Environ. 2020, 25, 18–35.
[CrossRef]
34. Kingsley, J.; Foenander, E.; Bailey, A. “It’s about community”: Exploring social capital in community gardens
across Melbourne, Australia. Urban For. Urban Green. 2020, 49, 126640. [CrossRef]
35. Kimber, C.T. Gardens and dwelling: People in vernacular gardens. Geogr. Rev. 2004, 94, 263–283. [CrossRef]
36. Guitart, D.; Pickering, C.; Byrne, J. Past results and future directions in urban community gardens research.
Urban For. Urban Green. 2012, 11, 364–373. [CrossRef]
37. Ciftcioglu, G.C. Social preference-based valuation of the links between home gardens, ecosystem services,
and human well-being in Lefke Region of North Cyprus. Ecosyst. Serv. 2017, 25, 227–236. [CrossRef]
38. Matteson, K.C.; Langellotto, G. Evaluating Community Gardens as Habitat for an Urban Butterfly.
Cities Environ. 2012, 5, 10. [CrossRef]
39. Santini, L.; González-Suárez, M.; Russo, D.; Gonzalez-Voyer, A.; von Hardenberg, A.; Ancillotto, L.
One strategy does not fit all: Determinants of urban adaptation in mammals. Ecol. Lett. 2019, 22, 365–376.
[CrossRef]
40. Balčiauskas, L.; Balčiauskienė, L.; Janonytė, A. Reproduction of the root vole (Microtus oeconomus) at the edge
of its distribution range. Turk. J. Zool. 2012, 36, 668–675. [CrossRef]
41. Moors, P.J. Norway rats (Rattus norvegicus) on the Noises and Motukawao islands, Hauraki Gulf, New Zealand.
N. Z. J. Ecol. 1985, 8, 37–54. Available online: https://www.jstor.org/stable/24052744 (accessed on 15 April 2010).
42. Balčiauskienė, L.; Balčiauskas, L.; Čepukienė, A. Demographic and morphometric parameters of the
yellow-necked mouse (Apodemus flavicollis) in late autumn-early spring in Lithuania. Acta Biol. Univ. Daugavp.
2009, 9, 25–34.You can also read