British Columbia Community Bat Program Annual Bat Count (2012-2020) - Update: December 2020
←
→
Page content transcription
If your browser does not render page correctly, please read the page content below

British Columbia
Community Bat Program

   Annual Bat Count
     (2012-2020)

                                 J. Saremba, Burke Mountain Naturalists

  Update: December 2020
             Prepared by
      BC Community Bat Program
          December 15, 2020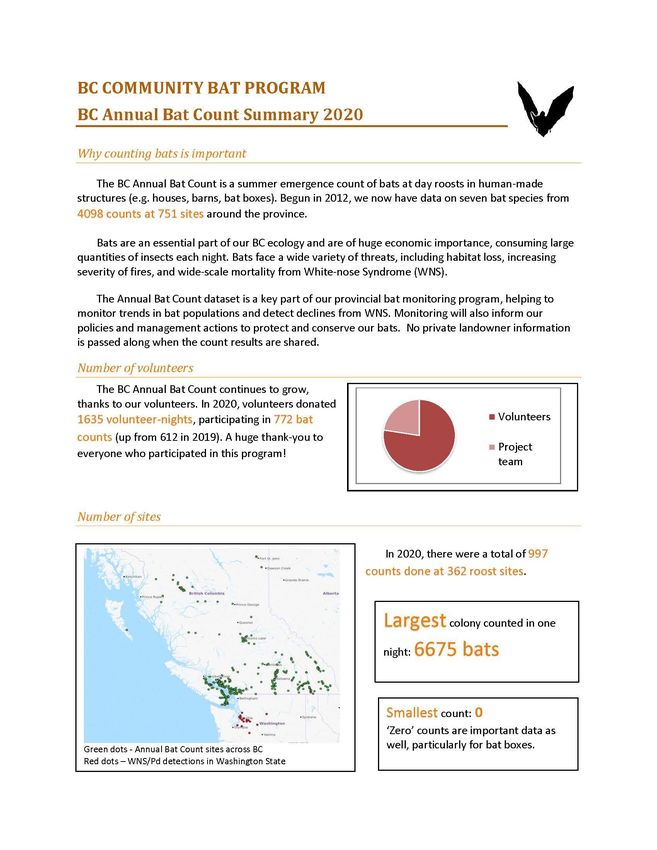
Executive Summary
White-nose syndrome is an emerging fungal disease that results in high mortality of susceptible bat
species. It has not yet been detected in British Columbia but occurs and is spreading in nearby
Washington State. It is expected in BC in the near future. The BC Annual Bat Count is one method to
assist with monitoring the spread of the disease, identify species-specific impacts, and track recovery of
affected species. The BC Annual Bat Count offers good potential for monitoring population trends in
some species of bat that use human structures for roosting, such as the federally-endangered Little
Brown Myotis (Myotis lucifugus) and the widespread Yuma Myotis (Myotis yumanensis).

The Annual Bat Count is currently the only long-term roost-monitoring program in the province. It can
contribute to the North American Bat Monitoring Program, covers much of BC, and is cost-effective due
to the large volunteer component and regional coordinators who implement the Count as part of the BC
Community Bat Program. The BC Annual Bat Count is also invaluable for increasing roost stewardship
and for providing ecological data on bats species in anthropogenic structures. The Annual Bat Count has
been conducted between 2012 – 2020, is growing each year, and has data on seven bat species at 751
sites.

Key successes of the Annual Bat Count in 2020 are:

    1. Contributions to WNS surveillance and population monitoring, specifically:
           • a continued increase in the number of sites monitored in the regions where WNS is
               first expected (Fraser Valley/ Vancouver, Sunshine Coast, Vancouver Island /Gulf
               Islands) and across the province,
           • an increased proportion of sentinel sites where the species of bat has been identified
               by genetics or acoustics, and
           • an increasing network of roost stewards who can monitor for spring mortality events
               associated with WNS.

    2. Increased stewardship and participation - even under COVID-19 restrictions on group sizes and
       site access, specifically:
       • continued increase in hours of volunteer participation, and
       • increased number of roost sites monitored.

    3. Contributions to knowledge of bat ecology across BC, specifically:
       • Contribution to provincial knowledge of species that use anthropogenic structures. For
          example, the Bat Count has confirmed use of anthropogenic roosts by Californian Myotis in
          coastal BC and the Okanagan, and Long-legged Myotis in coastal BC and the Cariboo,
       • Information on the timing of use of structures and dates of first pups across the province,
          and
       • Collection of carcasses from mortalities at roost sites for research into cause of death.
                                      Annual Bat Count 2012-2020
                                                                                                             i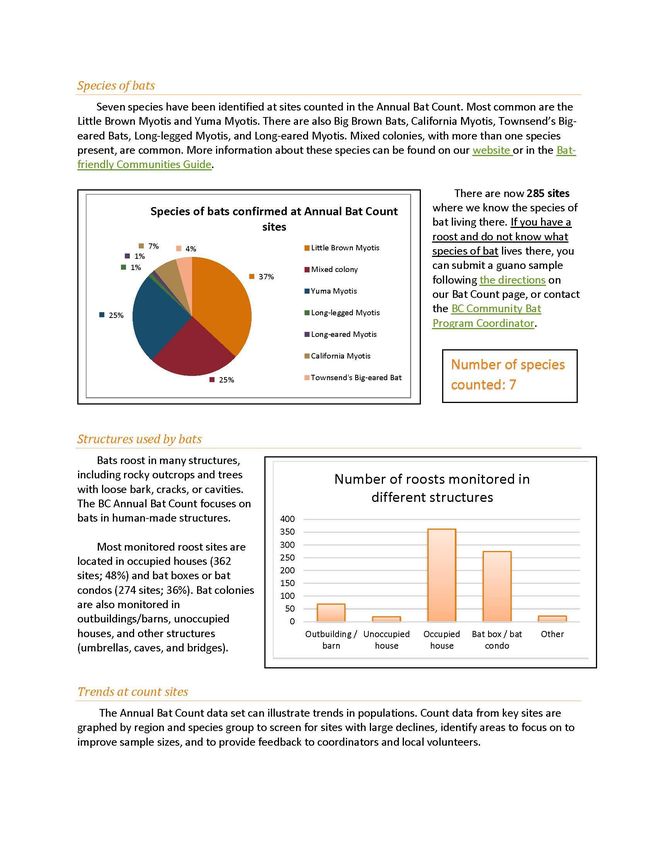
Particular challenges in 2020 were:
        • COVID-19 restrictions affecting number of sites, including access to high-priority sites;
        • Exceedingly wet and rainy weather in May through July made bat counts challenging and
             likely affected roost selection and reproduction.

 This report provides a summary of the data available to-date, to identify gaps and prioritize future data
collection efforts. Review of the data up to 2020 has highlighted the need to continue to emphasize the
same key actions, to ensure that the Annual Bat Count develops into a more effective, robust
monitoring program. These recommendations for 2021 include:
    • improving sample sizes and multi-year data collection first at sentinel sites and then across all
         regions and for all species. To achieve this, we need to:
             o communicate and follow-up (including an early-June check-in) with regional
                  coordinators and volunteers to ensure priority sites are counted and secure other
                  counters if needed,
             o emphasize conducting at least two counts in the pre-pup period especially at sentinel
                  sites, to better estimate maximum colony size, and
             o emphasize annual, multi-year sampling especially at sentinel sites, for data to contribute
                  to trend analysis,
    • identify species, particularly at sentinel sites and other sites with multi-year monitoring, by
         communicating (to regional coordinators and volunteers) where there are data gaps and directly
         encouraging sample collection and submission,
    • improve retention of all interested homeowners and volunteers through communication and
         outreach, to increase the number of multi-year samples,
    • continue to work with the North American Bat Monitoring Program (NABat) and the BC
         government to incorporate count data into NABat and initiate analyses, and
    • develop consistent methodology to flag sites showing potential population declines (e.g.
         significant percent decrease in maximum pre-pup counts) in a timely way for immediate action
         (e.g. swabbing sites for Pd, testing preventions/cures).

To achieve current Annual Bat Count objectives and address the recommendations for 2021, the
Community Bat Program needs ongoing funding for coordination, data management, analysis and
reporting. We also require funding for regional coordinators to conduct counts, engage, train and
coordinate volunteers, communicate and provide feedback to volunteers to encourage retention in the
program, and funds for DNA analysis, acoustic monitoring equipment, and acoustic analysis. The Annual
Bat Count is one component of the BC Community Bat Program. As the Annual Bat Count has grown, it
has required more resources from the CBP, and other funding and partnerships must be secured to
maximize the conservation and research value of this multi-year project.

                                      Annual Bat Count 2012-2020
                                                                                                         ii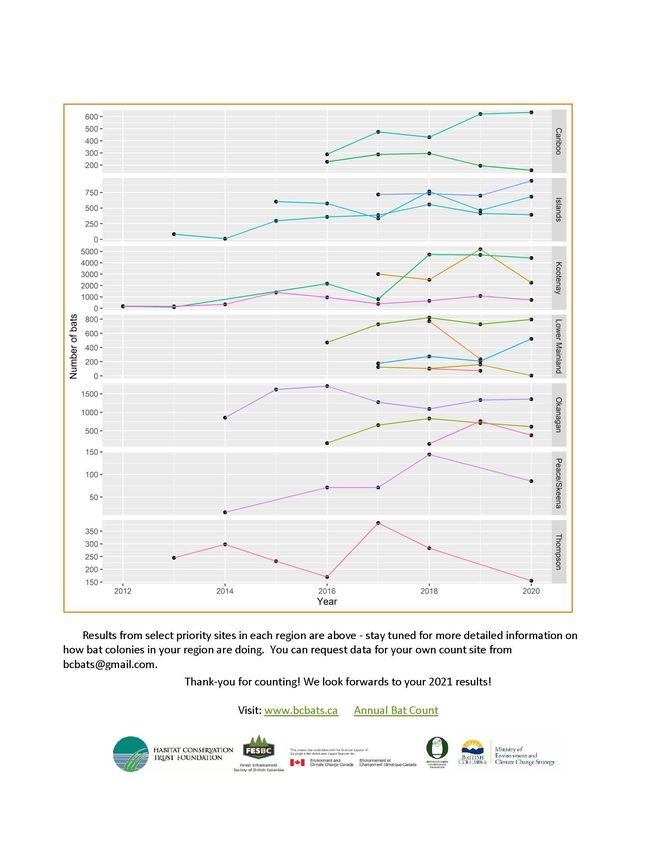
Table of Contents
Executive Summary........................................................................................................................................ i
Introduction .................................................................................................................................................. 0
Acknowledgements....................................................................................................................................... 1
Methods ........................................................................................................................................................ 1
Results ........................................................................................................................................................... 4
   Volunteer involvement ............................................................................................................................. 4
   Number of sites and counts ...................................................................................................................... 5
       Monitoring of high-priority sentinel locations ...................................................................................... 6
   Number of sampling years ........................................................................................................................ 6
   Distribution of sites ................................................................................................................................... 6
   Structure type ........................................................................................................................................... 7
   Bat species ................................................................................................................................................ 8
       Species at sentinel locations ............................................................................................................... 10
   Identification of maternity colonies........................................................................................................ 11
   Variability within count periods .............................................................................................................. 12
   Trends across years ................................................................................................................................. 14
Discussion.................................................................................................................................................... 15
     Participation and support ................................................................................................................... 15
       Species identification .......................................................................................................................... 16
       Potential for monitoring population trends ....................................................................................... 17
       Bat boxes and the Annual Bat Count .................................................................................................. 18
Summary of recommendations and priorities for 2021 ............................................................................. 19
References .................................................................................................................................................. 21
Appendix 1. Sentinel locations for ongoing monitoring ............................................................................. 23
Appendix 2. Yearly trends ........................................................................................................................... 26
Appendix 3. Summary for volunteers ......................................................................................................... 37

List of Tables
Table 1. Number of locations, roost sites, and counts per year. Not all sites from a year were counted in
successive years. ........................................................................................................................................... 5

                                                           Annual Bat Count 2012-2020
                                                                                                                                                                  iii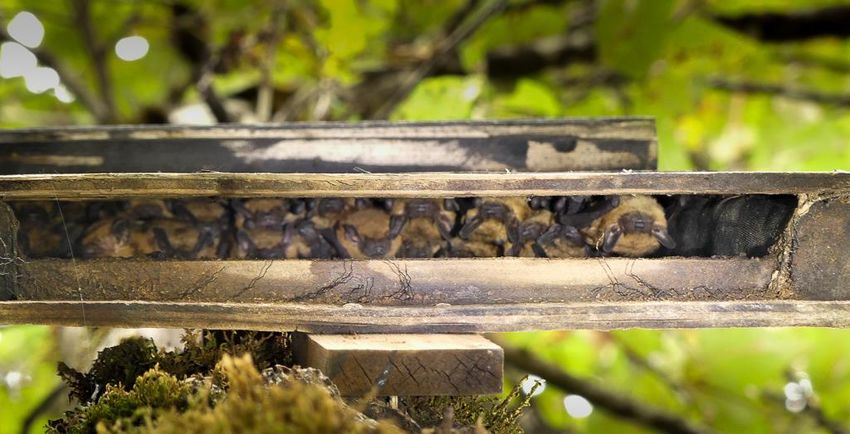
Table 2. Number of roost sites that have from one to nine years of count data, and the percentage of
sites sampled two or more years. Sites with two or more years of data can be used in trend analysis (Bat
Conservation Trust 2019).............................................................................................................................. 6
Table 3. Distribution of roost sites counted in the Annual Bat Count, by region and year .......................... 7
Table 4. Type of structure for each site monitored during the Annual Bat Count, 2012-2020, by region. .. 7
Table 5. Species, number of roost sites monitored for which species has been confirmed, and regions
monitored by the Annual Bat Count. ............................................................................................................ 9
Table 6. Species assemblages and the number of roost sites found for each species and species group, at
751 anthropogenic roost sites in BC. .......................................................................................................... 10
Table 7. Number of sentinel roost locations by species. ............................................................................ 11
Table 8. Summary of roost sites by structure type and colony type for 450 sites with pre-pup and post-
pup counts in the same year, for any year from 2012 to 2020. Maternity colonies were identified based
on an increase in numbers from pre-pup to post-pup counts. .................................................................. 12
Table 9. Number of maternity colonies by species and structure type. Maternity colonies were identified
based on an increase in numbers from pre-pup to post-pup counts. ........................................................ 12
Table 10. Dates of first pup (or lactating female) observed, by Region. .................................................... 14
Table 11. Detail on 29 sites with obvious declines in pre-pup maximum counts in 2020, by region. Grey
bands indicate sites with unexplained decreases....................................................................................... 35
List of Figures
Figure 1. Map of sites sampled in the Annual Bat Count (2012 to 2020). Colour of dot represents the
number of years sampled – red dots have two or more years of data and are useful for trend analyses;
white dots have one year of data. The WNS detection sites in Washington are indicated by red stars; the
red line shows the 200 km buffer around the Washington detections to suggest where WNS might arrive
first for count prioritization. ......................................................................................................................... 2
Figure 2. The number of bat counts done with volunteer involvement, from 2016 to 2020. Counts with
volunteers include those done entirely by volunteers, such as landowners with a colony, and counts with
a CBP coordinator and volunteers. ............................................................................................................... 5
Figure 3. The distribution of 257 maternity roost sites by structure type. Maternity roost sites were
identified through an increase in counts from pre- to post-pup periods. .................................................. 11
Figure 4. Counts for six sites with more than four counts in a year, showing nightly and yearly variation in
count numbers. Horizontal lines indicate Bat Count periods in the pre-pup (Jun 1-22) and post-pup (Jul
22- Aug 15 (pre-2018) / Jul 11- Aug 5 (2018 onwards) count periods........................................................ 13
Figure 5. Vancouver Island Region yearly maximum pre-pup counts. ....................................................... 26
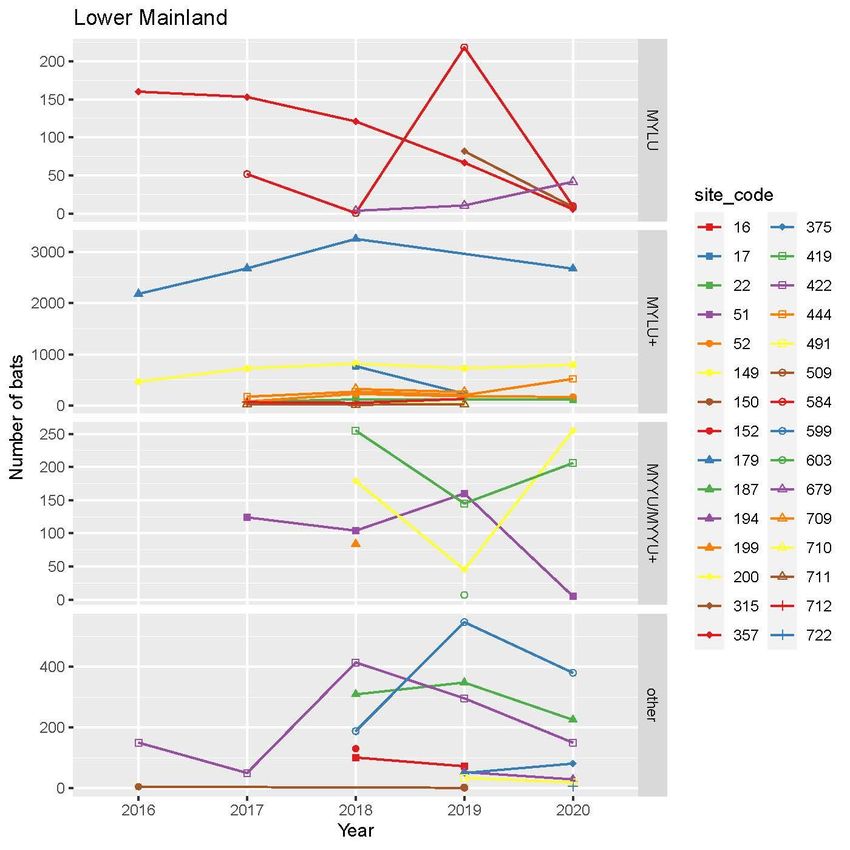
Figure 6. Fraser Valley/Vancouver Region yearly maximum pre-pup counts. ........................................... 27
Figure 7. Sunshine Coast Region yearly maximum pre-pup counts. .......................................................... 28
Figure 8. Okanagan Region yearly maximum pre-pup counts. ................................................................... 29
Figure 9. Kootenay Region yearly maximum pre-pup counts..................................................................... 30
Figure 10. Cariboo Region yearly maximum pre-pup counts. .................................................................... 31
Annual Bat Count 2012-2020
iv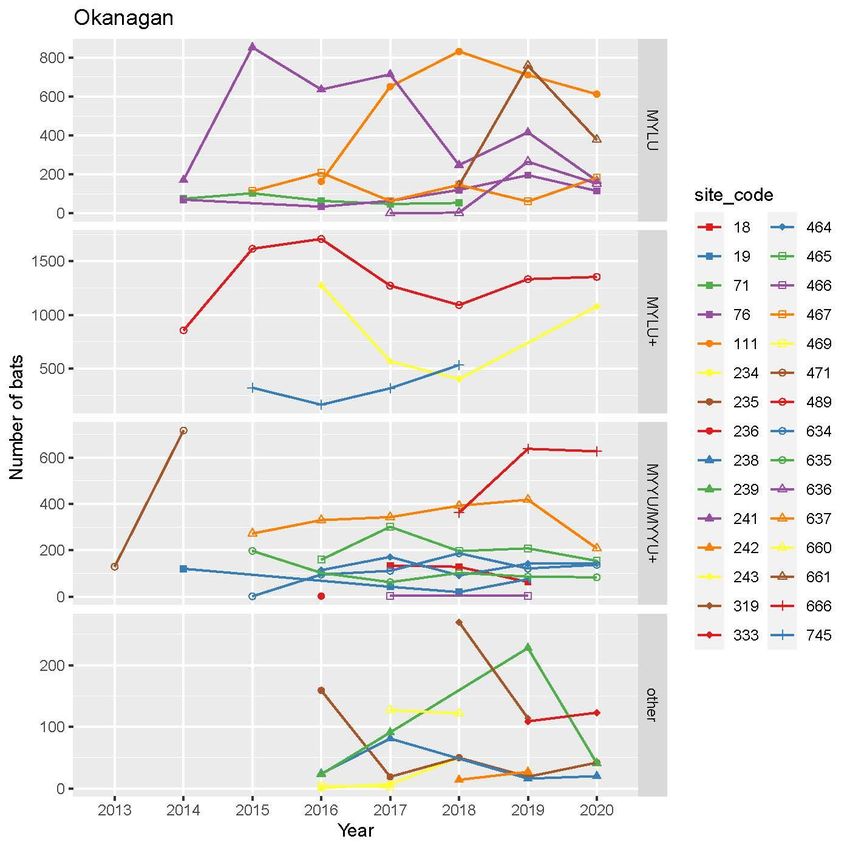
Figure 11. Peace and Skeena Regions yearly maximum pre-pup counts. .................................................. 32
Figure 12. Columbia Shuswap Region yearly maximum pre-pup counts. .................................................. 33
Figure 13. Thompson Region yearly maximum pre-pup counts. ................................................................ 34

Bat box construction, installation, and monitoring can raise awareness of bats and bat conservation
while providing necessary roost sites for some bat species and contributing monitoring data through the
BC Annual Bat Count. Photo: Sunshine Coast Wildlife Project.

                                             Annual Bat Count 2012-2020
                                                                                                                           v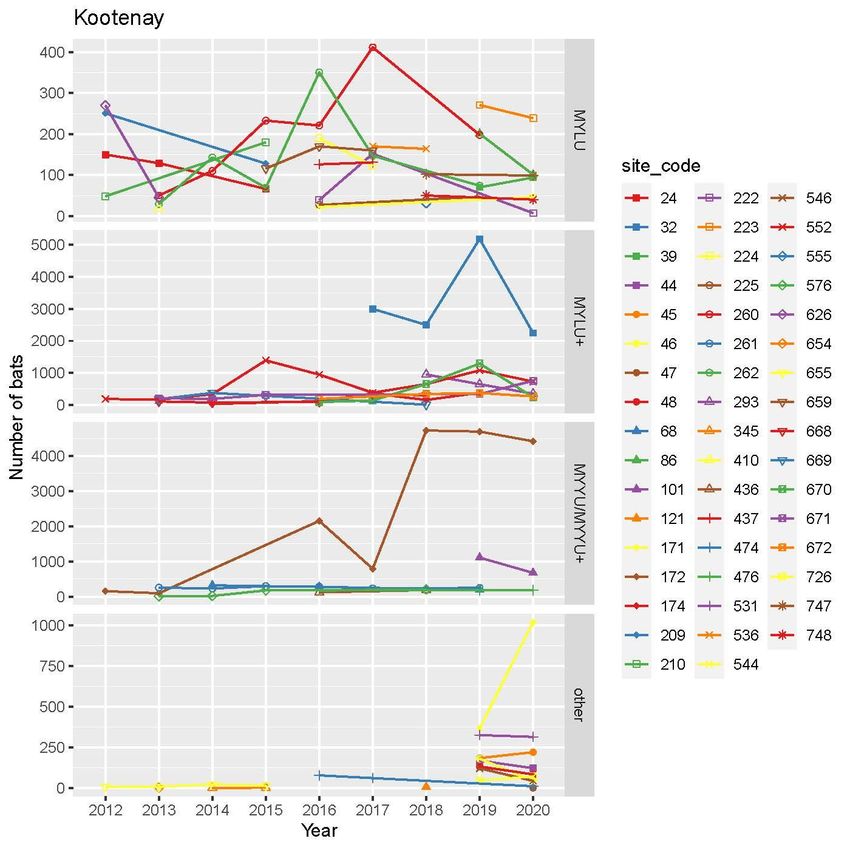
Introduction
White-nose syndrome (WNS) is an emerging, invasive disease of North American bats caused by the
introduced fungus, Pseudogymnoascus destructans (Pd). The disease has killed over six million bats in
eastern North America since 2006. It has nearly extirpated (90% -100% mortality) some previously
abundant species (e.g. Little Brown Myotis (Myotis lucifugus) and Northern Myotis (M. septentrionalis)),
in some areas. These two species are now listed by the Species at Risk Act (SARA) as endangered in
Canada (B.C. Conservation Data Centre 2020). In March 2016, WNS was detected for the first time west
of the Rocky Mountains, in Washington State within 150 km of the British Columbia (BC) border, putting
BC’s bats at extreme risk from the disease. Many of BC’s 15 bat species have not yet been exposed to
WNS, and it is unknown what the full impact of the disease in BC might be.

Bats are important to our environment and our economy, helping to control forest, agricultural, and
urban pests. The endangered Little Brown Myotis can eat 600 mosquitoes per hour (Griffin et al. 1960)
and researchers estimate that bats provide billions of dollars in pest control services annually in the
United States (Kunz et al. 2011, Kasso and Balakrishnan 2013). A rapid response to WNS is required to
understand and mitigate this significant threat, protect our bat populations, and reduce economic
impacts.

One component of WNS response is monitoring the impacts to, and potential recovery of, different
species of bats. The ability to reliably detect trends in bat populations through counts depends on a
number of factors, including years sampled, number of sites counted, number of bats per site, and
annual variation (Walsh et al. 2001). Statistically robust methods for monitoring bat populations have
been developed in several European countries in response to long-term population declines and the
need to determine if recovery targets are reached (e.g. Walsh et al. 2001, Warren and Witter 2002,
Barlow et al. 2015).

The BC Community Bat Program independently conducts the only long-term roost monitoring project in
the province. Beginning in 2012 with the Kootenay Community Bat Project, the BC Community Bat
Program has expanded remarkably quickly across the province. One facet of the Program is the Annual
Bat Count, which involves exit counts conducted at summer day roost sites in anthropogenic structures.
Goals of the Annual Bat Count include raising awareness of bats, promoting stewardship of colonies, and
ultimately providing information on bat species and numbers.

The Annual Bat Count is coordinated at the provincial level, providing consistent methods and
datasheets, plus data management and storage. On the ground, the Annual Bat Count is implemented
by regional coordinators. As part of their contribution to the Program, regional coordinators are
responsible for ensuring that a number of counts occur in their regions. Coordinators usually do several
counts themselves, particularly at strategically important sentinel roost sites. They also recruit, organize,
and train volunteers to assist with counts, as is done in the United Kingdom’s National Bat Monitoring
Program (Barlow et al. 2015).

Volunteer involvement varies by region and depends in part on the direction and goals of the Regional
Community Bat Project. Overall, the program has included diverse volunteers including private
landowners, local stewardship groups, interested citizen-scientists, and government staff (e.g. BC Parks,
FLNRO and ENV biologists, Canadian Wildlife Service).

The Annual Bat Count has a strong potential to provide trend data for those bat species in BC that
regularly use anthropogenic structures. The program has expanded greatly in the past four years, but
continues to need focus on some aspects of the program to obtain statistically robust trends, most
notably on ensuring retention of sites to establish multi-year trends. Specific recommendations to
prioritize and improve data collection have been made prior to past field seasons (Kellner 2019). Several
of these recommendations have been addressed, while new recommendations have also been added
for 2020.

The purposes of this report are to:

    1) update the summary of available BC Annual Bat Counts from across the province to include data
       from 2020,
    2) assess the success of the program in meeting the recommendations made prior to the 2020 field
       season, and
    3) continue to provide recommendations to improve the program in order to make it an effective
       tool for monitoring the arrival, impacts, and response of selected bat populations to WNS and
       other threats.

This report is preliminary in nature and does not include any statistical analyses of the data.

Acknowledgements
The BC Community Bat Program is a joint venture of regional bat projects across the province. It is
funded by Habitat Conservation Trust Foundation, Forest Enhancement Society of BC, Habitat
Stewardship Program, the Province of BC, and many regional funding partners. Thank you to all the
Regional Coordinators who locate roost sites, identify candidate sites for the Annual Bat Count, and
engage, organize, and train volunteers. BC Parks has done an exceptional job of ongoing counts at many
sites over the years. Orville Dyer (BC MoE) has provided valuable guidance and input to the program, as
well as participating in bat counts. We especially thank Juliet Craig and the Kootenay Community Bat
Project, who started the Annual Bat Count in BC. Finally, the Annual Bat Count could not occur without
our many dedicated volunteers, who collect data for the program.

Methods
Count protocol
The Annual Bat Count is a repeated count of bats as they leave a roost site in summer (i.e. emergence
count or exit count). It focusses on day roosts in anthropogenic structures (e.g. houses, barns, bat
houses). These roost sites are usually identified through the work of the BC Community Bat Program.
                                       Annual Bat Count 2012-2020
                                                                                                        1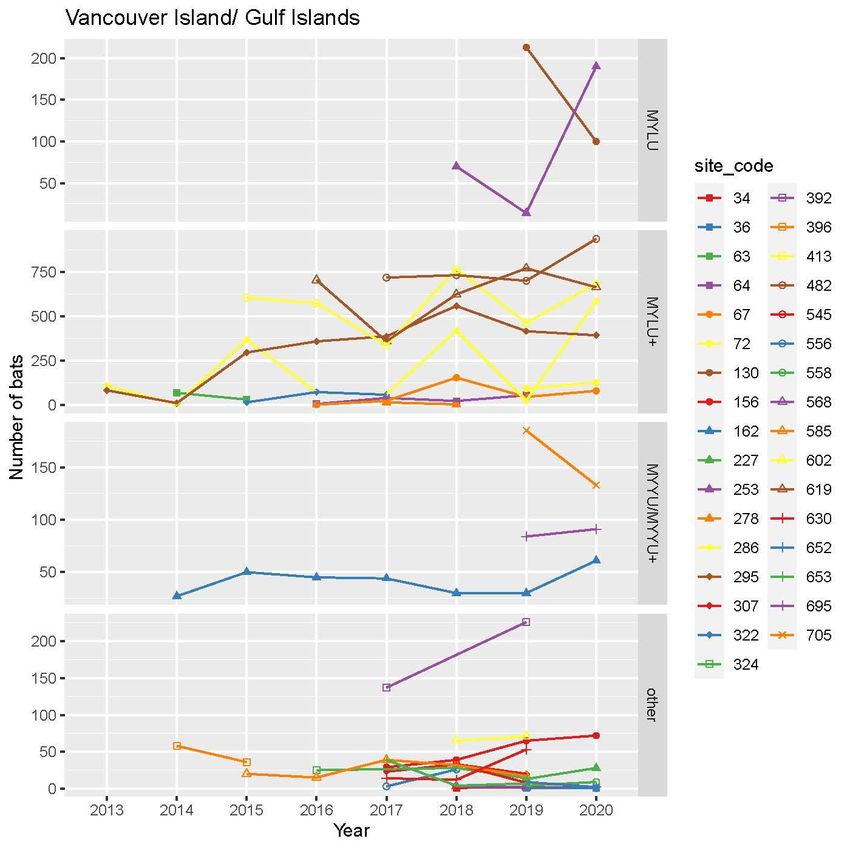
Regional Coordinators conduct and promote volunteer participation in conducting bat exit counts at
roost sites during designated sampling periods. The program covers much of BC, although sites tend to
be clustered where there is a longer history of bat programs or a larger human population (Figure 1).

Counts are done at day roost sites; there are occasionally several sites at one location, with each site
being counted separately and ideally on the same night. For example, a property with an attic roost and
two bat boxes in the yard would be one location with three count sites, and multiple counts are done at
each site. Data are generally analyzed by site, a structural feature with bats exiting (or not), instead of by
location, which is a subjective grouping of known roost sites in an area. Roost sites are classified into ten
structure types: barn, unoccupied house, occupied house, church, outbuilding, bridge, tree, bat
box/condo, other (e.g., cave, woodpile), and unknown.

Figure 1. Map of sites sampled in the Annual Bat Count (2012 to 2020). Colour of dot represents the number of years
sampled – red dots have two or more years of data and are useful for trend analyses; white dots have one year of data. The
WNS detection sites in Washington are indicated by red stars; the red line shows the 200 km buffer around the Washington
detections to suggest where WNS might arrive first for count prioritization.

Coordinators and/or volunteers conduct between one and four visual counts of bats exiting roosts at
dusk. Ideally, two counts occur between June 1 and 21 (the ‘pre-pup period’, i.e. before pups can fly).
These counts are the highest priority, and are consistent with North American Bat Monitoring Program
(NABat) protocols (Loeb et al. 2015). Two more counts are recommended once pups are flying (called
the ‘post-pup period’). In 2018, dates for post-pup counts were switched to July 11 – August 5 (from July
21 – Aug 15 in 2017 and earlier), because of many reports of colonies being vacated by early to mid-
August. We hoped that the earlier count window would facilitate counts before colonies began to
disperse.

                                            Annual Bat Count 2012-2020
                                                                                                                             2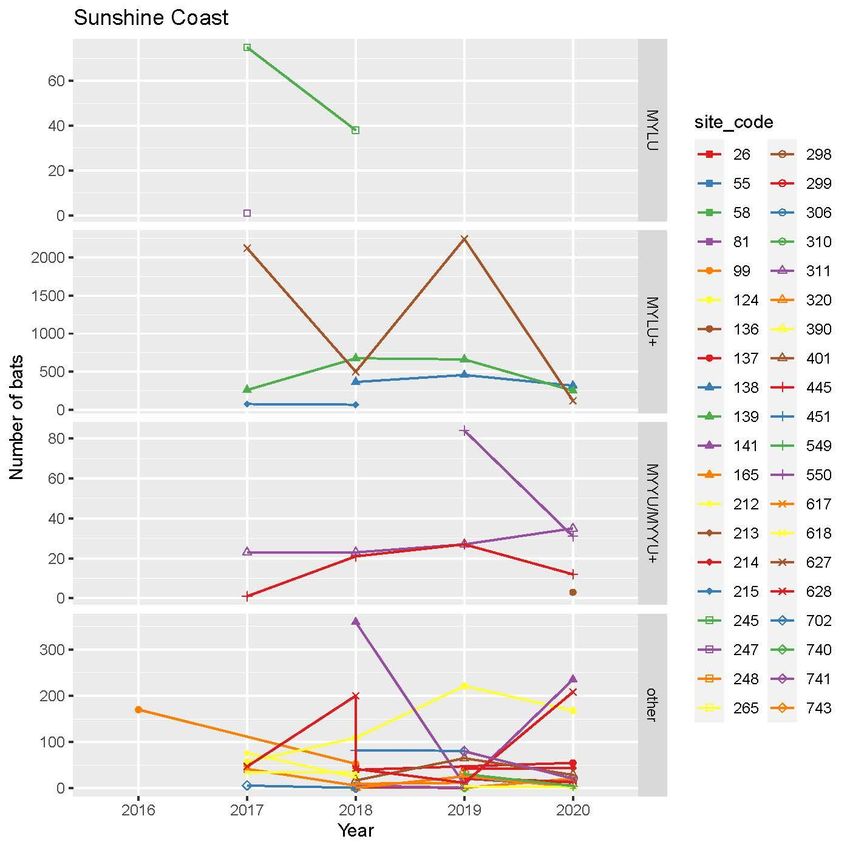
In 2019, we began requesting multiple independent counts on the same night, when possible, given the
constraints of volunteer time / availability. This was based on discussion with the NABAT team and is
intended to provide a measure of observer error and assess variability.

The Annual Bat Count is meant to be repeated yearly for as long as possible, but depends on funding,
access to count sites, and volunteer availability. Data are recorded for each count and submitted to the
regional or provincial coordinator, BC Ministry of Environment and Climate Change Strategy staff or
Ministry of Forests, Lands, Natural Resource Operations and Rural Development staff. Ultimately, count
data are entered into the BC Wildlife Species Inventory database1. Detailed methods can be found on
our website2 .

Species identification
Verification of the species using a roost site may be done through DNA analysis of guano samples. To
date, our DNA analysis has been completed by Wildlife Genetics International, Nelson. Alternatively,
some regional coordinators have access to ultrasonic bat detectors (e.g. Echometer Touch (Wildlife
Acoustics), Anabat Walkabout (Titley Electronics), RoostLogger (Titley Electronics)), which can inform
species identification. Identifications based solely on acoustics are taken as confirmation if the acoustic
files are analyzed by a trained bat biologist. Species identification may also be done by qualified
biologists through identification of dead bats or live capture by mist-netting. Although these three
methods ‘confirm’ species identification for this report, final confirmation of species presence generally
requires genetic verification and is the preferred method, if available.

Criteria for identifying maternity roosts
Two methods of identifying maternity roosts were used. Sightings of pups, including mortalities, can be
used to confidently confirm a site as a maternity roost. However, confirmed pup sightings are not
available for the majority of sites. The second method is to compare the maximum counts from the pre-
pup and post-pup periods. Sites where the maximum count increased between periods were considered
maternity colonies. Rationale was explored in previous reports (Kellner 2019). Potential maternity sites
were identified using both methods, and sites were manually reviewed to ensure that known maternity
colonies were correctly identified.

Sentinel sites
Beginning in 2017, a list of priority ‘sentinel’ sites in BC was created to prioritize monitoring efforts to
promote long-term monitoring sites (Kellner and Dyer 2017). These sites were chosen to be large,
secure colonies with sufficient volunteer or coordinator resources to be counted regularly. To establish
the list of sentinel sites, sites were assigned a rank of zero or one for each of the criteria below and all
ranks were added to provide a total score. The score was sorted to prioritize sites by high score, within
each region. Criteria used for the initial ranking of sites were:

1
    http://a100.gov.bc.ca/pub/siwe/search_reset.do
2
    http://www.bcbats.ca/index.php/get-involved/participate-in-the-bc-bat-count.
                                          Annual Bat Count 2012-2020
                                                                                                               3
• LARGE: colony size greater than 150 bats in at least one count; larger colonies theoretically will
have less % variation between counts. Large colonies are also more likely to be maternity
colonies,
• ACTIVE: counted in the last two years, indicating recent access to the site and availability of
volunteers,
• WITHIN YEAR REPLICATION: multiple counts available within a year,
• BETWEEN YEAR REPLICATION: counts are available from more than one year,
• COSEWIC: are COSEWIC-listed species present (e.g. Little Brown Myotis), and
• KEEN: homeowner/community support (if a landowner is known to be very keen to count and
submit data over the long term).
High-ranked sites are then reviewed yearly by provincial and regional coordinators to confirm
landowner/volunteer interest and identify other sites that could be prioritized. As of 2019, a pre-
populated excel data template was provided to regional coordinators to highlight data collection at
sentinel sites. If a site is no longer functioning as a sentinel site, yearly counts should still be obtained for
long-term monitoring.
Trends across years: screening for declines
Maximum pre-pup counts were graphed for each roost site, and the results visually screened for
declines. Subjective assessment was used to identify sites that needed further follow-up. These sites
were then individually investigated to determine if there were known causes for decline. In 2018,
variation within the pre-pup period and post-pup period were assessed. Methods to quantitatively
assess yearly variation in relation to this within-year variation have not yet been employed.
Results
Volunteer involvement
Volunteer involvement is essential to the Annual Bat Count, providing many or most of the bat counts in
some regions. Volunteers either assist regional coordinators or conducted counts on their own.
Volunteers may have assisted at more than one count, and many counts required multiple volunteers to
ensure all exits were monitored, so the number of unique volunteers is unknown. Recording volunteer
effort began in 2016. Volunteers participated in a minimum of 338/403 counts (84%) in 2016, 418/550
counts (76%) in 2017, 540/809 counts (67%) in 2018, 612/910 (67 %) in 2019, and 772/997 counts (77%)
in 2020 (Figure 2). The number of volunteer-nights was a minimum of 465 in 2016, 430 in 2017, 613 in
2018, 1308 in 2019, and 1635 in 2020, with the very large increase from 2018-2019 likely due to better
tracking of volunteer effort.
Annual Bat Count 2012-2020
41200
1000
Bat counts
800
600
Counts without volunteers
400
200 Counts with volunteers
0
2016 2017 2018 2019 2020
Year
Figure 2. The number of bat counts done with volunteer involvement, from 2016 to 2020. Counts with volunteers include
those done entirely by volunteers, such as landowners with a colony, and counts with a CBP coordinator and volunteers.
Number of sites and counts
Four thousand and ninety-eight (4098) counts have been conducted at 751 sites between 2012 and
2020 (Figure 1; Table 1). Sites counted in one year may not have been counted in subsequent years, and
sites counted for multiple years were often but not always counted in consecutive years. The number of
sites has increased with the expansion of the Community Bat Program across the province and increased
efforts by coordinators to establish count sites and gather baseline pre-WNS data.
In 2019, when we requested multiple counts per site per night when possible, there were 161 counts at
74 sites where observers obtained two or more independent counts on a single night. In 2020, there
were 154 counts at 66 sites where two or more independent counts occurred. In many cases, COVID
restrictions limited volunteer participation and group sizes, and likely reduced the number of
simultaneous counts done.
Table 1. Number of locations, roost sites, and counts per year. Not all sites from a year were counted in successive years.
Year Locations Roost sites Counts
2012 11 11 27
2013 24 31 84
2014 36 45 113
2015 54 77 205
2016 116 157 403
2017 138 189 550
2018 174 230 809
2019 253 342 910
2020 242 362 997
Unique locations, roost 535 751 4098
sites and counts, all years
Annual Bat Count 2012-2020
5Monitoring of high-priority sentinel locations
Ninety-four (95) individual roost sites at 44 locations were identified as sentinel sites with highest
priority for ongoing monitoring in 2020 (see Methods for sentinel sites, Kellner 2020; Appendix 1). In
2020, 72/95 (76 %) roost sites at 39/44 (89 %) sentinel locations were counted. This rate of monitoring is
similar to 2019, when 62/83 (75 %) sentinel sites were counted at 34 locations (34/48 (71 %) locations).
Locations not monitored in 2020 were due lack of interest on the part of landowners or in one case,
COVID-19 restrictions keeping the foreign landowner from accessing their sites.
Number of sampling years
Sites have been monitored for between one and nine years (Table 2), leading to the start of a long-term
dataset. As of 2020, 433 sites have one year of data, 146 sites have two years of data, 53 sites have
three years of data, 53 sites have four years of data, 21 sites have five years of data, 22 sites have six
years of data, four sites have seven years of data, eight sites have eight years of data, and one of the 751
Annual Bat Count sites currently has nine years of data.
Sites that have been monitored for two or more years can be used in trend analysis using the methods
employed in UK’s National Bat Monitoring Programme (Bat Conservation Trust 2019). As of 2020 in BC,
there are 308/751 locations (41 %) with two or more years of data, for all species combined (Table 2).
There are 99 roost sites within 200 km of the 2016 Washington WNS detection site that were monitored
in 2020. Sixty-two (62) have been monitored for at least two of the last three years (2018-2020).
Table 2. Number of roost sites that have from one to nine years of count data, and the percentage of sites sampled two or
more years. Sites with two or more years of data can be used in trend analysis (Bat Conservation Trust 2019).
Number of Number of roost sites as of
years counted 2016 2017 2018 2019 2020
1 136 156 219 344 443
2 34 45 93 113 146
3 12 32 35 52 53
4 7 9 21 33 53
5 1 14 9 19 21
6 1 11 10 22
7 1 8 4
8 1 8
9 1
Total 190 257 389 580 751
Percent with 28 39 44 41 41
2+ years
Distribution of sites
Roost count sites are distributed throughout B.C. but are focused in areas of higher human habitation
and where Community Bat Programs have been established for longer times (Table 3, Figure 1).
Annual Bat Count 2012-2020
6Table 3. Distribution of roost sites counted in the Annual Bat Count, by region and year
Region 201 201 201 201 201 201 201 201 202
2 3 4 5 6 7 8 9 0
Kootenay 10 20 20 31 25 26 29 46 64
Sunshine Coast 31 41 49 105 61
Fraser Valley/ Lower Mainland 1 11 21 28 62 76
Southern Vancouver Island/Gulf 7 7 11 22 35 44 54 54
Islands1
Okanagan 1 3 15 17 31 30 39 28 34
Cariboo 1 1 9 14 18 18 29
Skeena 11 13 8 6 12 13
Northern Vancouver Island 10
Columbia Shuswap 1 6 8 4 7 6
Peace 1 3 3 3 3 2
Thompson 1 1 2 3 2 3 2 3
Other2 1 3 1 7 5 10
All sites 11 31 45 77 157 189 230 342 362
1Includes data from bat programs on Salt Spring, Thetis, Mayne, Gabriola, Denman/Hornby, and Texada Islands.
2 Other includes sites in central Vancouver Island, Lillooet, Haida Gwaii and Omineca/Prince George.
Structure type
Most roost sites that were monitored from 2012 to 2020 were occupied houses (262 sites; 48%) and bat
boxes or bat condos (274 sites; 36%; Table 4).
Table 4. Type of structure for each site monitored during the Annual Bat Count, 2012-2020, by region.
Region Unoccupied Occupied Outbuilding Bat box / Other1 Unk Total
house house / barn bat condo
Sunshine Coast 7 113 21 28 16 3 188
Kootenay 6 49 14 62 131
Southern Vancouver Isl./ Gulf 2
Isl. 62 7 48 119
Fraser Valley/ Lower Mainland 2 58 9 34 3 106
Okanagan 3 25 10 39 2 79
Cariboo 1 12 3 27 43
Skeena 17 2 8 27
Other 6 2 11 1 20
Columbia Shuswap 8 9 17
Northern Vancouver Island 9 1 10
Thompson 2 1 4 7
Peace 1 3 4
Total 19 362 69 274 22 5 751
Percent of all roosts 3 48 9 36 3 1 100
1 ‘Other’ includes ‘Umbrella’ (n=17), ‘Rock/cave’ (n=2), and ‘Bridge’ (n=2).
Annual Bat Count 2012-2020
7Bat species
There are seven species of bats recorded roosting in anthropogenic structures in the Annual Bat Count
data. These are Little Brown Myotis (Myotis lucifugus), Yuma Myotis (M. yumanensis), Big Brown Bat
(Eptesicus fuscus), Californian Myotis (M. californicus), Long-legged Myotis (M. volans), Long-eared
Myotis (M. evotis), and Townsend’s Big-eared Bat (Corynorhinus townsendii; Table 5). DNA identification
from guano, which is used to confirm species, used only one pellet per site so species that rarely use
structures or are a small percentage of the bats using the site are likely under-represented in these data,
especially at sites with large numbers of bats.
For all sites across years, there are 285/751 (38 %) sites that have a confirmed species id, with an
additional 17 sites classified as Myotis species. There are an additional 44 sites with samples submitted
and genetic results pending. If all samples are successful, there will be 301/751 (40 %) total sites with
species id. Many of the unidentified sites have not been visited for several years and it is unlikely that
the bat species using these sites will ever be determined.
For sites counted in 2020, the proportion of sites with species ID is larger. Of the 362 roost sites counted
in 2020, fifty-four (54) sites had a count of 0 bats, so no identification is possible. Of the 308 sites with
bats in 2020, 130 (42 %) have a species ID. There are 43 samples from 2020 pending analysis, for a total
of 173/308 (56%) sites with ID. As in previous years, in 2020 there were many new sites added that did
not yet have any information on species.
Little Brown Myotis are more commonly found in artificial structures than any other bat in BC (Table 6)
and occur alone or with other species at 154/285 (54%) of sites with confirmed species identification.
When multiple species are identified at a roost, Little Brown Myotis are commonly found with Yuma
Myotis, and sometimes co-roost with Big Brown Bat, California Myotis, Long-legged Myotis or Long-
eared Myotis (Table 6).
Yuma Myotis are the second most common bat in anthropogenic structures and are confirmed at
96/224 (43 %) of sites. They often are found in roosts with Little Brown Myotis and occasionally co-roost
with other species including Big Brown Bat, California Myotis and Townsend’s Big-eared Bat (Table 6).
Annual Bat Count 2012-2020
8Table 5. Species, number of roost sites monitored for which species has been confirmed, and regions monitored by the
Annual Bat Count.
Species Number of roost sites with Regions
confirmed species
identification (percent of all
roost sites with an ID)1
Little Brown Myotis 156 (55%) All
Yuma Myotis 119 (42%) All except Peace and interior portion of Skeena
Big Brown Bat 32 (10%) Southern Vancouver Island/Gulf Islands, Fraser
Valley / Lower Mainland, Columbia-Shuswap,
Kootenay, Thompson, Okanagan, Cariboo,
Skeena
California Myotis 26 (11%) Southern Vancouver Island/ Gulf Islands,
Sunshine Coast, Okanagan
Townsend ’s Big- 9 (3%) Fraser Valley / Lower Mainland, Kootenay,
eared Bat Southern Vancouver Island/ Gulf Islands,
Sunshine Coast
Long-eared Myotis 6 (2%) Haida Gwaii, Southern Vancouver Island/Gulf
Islands, Sunshine Coast, Fraser Valley / Lower
Mainland
Long-legged Myotis 4 (1%) Southern Vancouver Island/Gulf Islands, Fraser
Valley / Lower Mainland, Cariboo
Total 2851
1 Note that more than one species can occupy the same roost site.
There are six sites identified as having Long-eared Myotis. One of the sites is a bat box, one is a cave,
and four are occupied buildings. Long-eared Myotis were also confirmed genetically at a bat box roost in
the Skeena Region in 2015. However, this site has been conservatively assigned an identification of Little
Brown Myotis, as the DNA analysis procedure at the time did not include testing for a gene (muc-11) to
positively differentiate Long-eared Myotis from a coastal genotype of Little Brown Myotis. Improved
testing from 2016 onwards allowed differentiation of these species. The confirmed bat box site (in the
Kootenays) was tested genetically in 2017, after the testing method for MYEV was improved.
Confirmation of species in the other three cases involved in-hand identification and acoustics. A
maternity colony in a cave in Haida Gwaii was identified through capture as a mixed colony of Long-
eared Myotis and Little Brown Myotis. A dead bat on-site, paired with acoustics, identified Long-eared
Myotis in a mixed colony in a house on the Sunshine Coast. Acoustic identification was used in 2017 to
identify Long-eared Myotis in a mixed colony at a house on Southern Vancouver Island.
Annual Bat Count 2012-2020
9California Myotis was confirmed genetically or through capture at occupied houses, barns, and bat
boxes on Southern Vancouver Island, the Gulf Islands, and the Sunshine Coast, and in a bat box in the
Okanagan.
Long-legged Myotis was genetically confirmed using four building roosts, two in the Gulf Islands
(including under cedar siding on an occupied house), one in Squamish, and one in the Cariboo (a barn).
Table 6. Species assemblages and the number of roost sites found for each species and species group, at 751 anthropogenic
roost sites in BC.
Species in roost site # roost % of all 751 % of 285 roost sites
sites roost sites with known species ID
Little Brown Myotis 103 14 36
Little Brown Myotis / Yuma Myotis 37 5 13
Little Brown Myotis / Yuma Myotis / Big Brown Bat 2Table 7. Number of sentinel roost locations by species.
Species in roost Sentinel locations
Little Brown Myotis 12
Little Brown / Yuma Myotis 13
Little Brown / Long-legged Myotis 1
Little Brown / Yuma / Big Brown Bat 1
Little Brown / Yuma / California Myotis 1
Yuma Myotis 8
Big Brown Bat 1
Townsend ’s Big-eared Bat 1
California Myotis 1
Long-legged Myotis 1
NoID – no testing has occurred 4
Total 44
Identification of maternity colonies
Nearly two-thirds of all sites monitored to-date are maternity colonies. Counts increased from pre-pup
to post-pup count periods at 257/421 (61 %) roost sites with pre- and post-pup count; these 257 sites
were considered maternity colonies.
Maternity colonies were found in all types of structures monitored (Figure 3). The majority of maternity
colonies were found in occupied houses (127/257 maternity colonies, 49 %) and bat boxes / bat condos
(90/257, 35 %, Table 8). These results are very similar to those for all roost sites monitored including the
sites not flagged as possible maternity roosts (e.g. 48 % in occupied houses, 36 % in bat boxes).
160
roost sites in each structure
140
Percentage of maternity
120
100
80
60
type (%)
40
20
0
Figure 3. The distribution of 257 maternity roost sites by structure type. Maternity roost sites were identified through an
increase in counts from pre- to post-pup periods.
Eighty (92/257, 36 %) of these maternity colony roost sites were confirmed as Little Brown Myotis,
either alone or with other species (Table 9). Little Brown Myotis maternity roost sites were mainly in
occupied houses (45/92, 49 %) but also in bat boxes/ bat condos (30/92, 33 %; Table 9).
Annual Bat Count 2012-2020
11Table 8. Summary of roost sites by structure type and colony type for 450 sites with pre-pup and post-pup counts in the
same year, for any year from 2012 to 2020. Maternity colonies were identified based on an increase in numbers from pre-
pup to post-pup counts.
Structure type Maternity Total % of structure type % of all maternity
sites sites housing a maternity roosts in a given
colony structure type
Unoccupied house 6 11 54 2
Occupied house 127 194 65 49
Outbuilding /barn 30 43 70 12
Bat box/ bat condo1 90 167 541 351
Other 4 6 67 2
Total 257 421 64 100
1 Monitoring
at bat boxes includes both occupied and unoccupied bat boxes. The % structure housing a colony is therefore an
underestimate for this structure type.
Table 9. Number of maternity colonies by species and structure type. Maternity colonies were identified based on an
increase in numbers from pre-pup to post-pup counts.
% of total with Little Brown
Myotis mix, no Little Brown
Townsend’ s / Big Brown
Little Brown mix
Townsend’ s
Little Brown
Long-legged
Myotis spp.
Big Brown
California
Species
Yuma
NoID
Sum
TBD
Unoccupied house 0 4 0 0 0 0 0 1 0 0 0 1 6 67
Occupied house 27 18 15 2 2 8 1 0 4 6 3 41 127 35
Outbuilding/barn 6 5 3 0 0 0 3 0 0 1 0 12 30 37
Bat box/ bat condo 17 13 15 0 0 0 0 0 6 2 2 34 90 33
Other1 1 1 1 0 0 0 0 0 0 0 0 1 4 50
Total 51 41 34 2 2 8 4 1 10 10 5 89 257 36
1 ‘Other’ includes ‘Umbrella’, ‘Rock/cave’, and ‘Other’ categories.
Variability within count periods
There is large variation in count results within a site and within designated count periods. There is also
variation between years in the timing of when colonies reach maximum size and then begin to decline
(Figure 4). The observed variability emphasizes the importance of doing at least two counts, to better
estimate maximum number of bats in the roost and to be able to estimate variability for that site.
Annual Bat Count 2012-2020
12Figure 4. Counts for six sites with more than four counts in a year, showing nightly and yearly variation in count numbers.
Horizontal lines indicate Bat Count periods in the pre-pup (Jun 1-22) and post-pup (Jul 22- Aug 15 (pre-2018) / Jul 11- Aug 5
(2018 onwards) count periods.
Annual Bat Count 2012-2020
13Dates of first pups
Observations of first pups of the year were obtained from several roost sites (Table 10). These
observations show yearly variability in the start of parturition. These dates also suggest that any counts
prior to ~ July 9 would not include volant pups (assuming around three weeks until pups begin flying).
The current pre-pup count period is June 1 – 22 and therefore prior to volancy of pups. The current
post-pup count period is July 11 – August 4.
Table 10. Dates of first pup (or lactating female) observed, by Region.
Region Species Year Date
Vancouver/Fraser Valley MYLU/MYYU 2020 Jun 19
Vancouver/Fraser Valley MYLU/MYYU 2020 Jun 24
Vancouver Island/Gulf Islands MYLU/MYYU 2019 Jun 16
Sunshine Coast (Clowhom) MYLU/MYYU/MYCA 2019 Jun 17
Sunshine Coast (Jervis Inlet) MYLU/MYYU/MYCA 2019 Jul 19
Okanagan MYLU/MYYU 2017 Jun 26
Okanagan MYLU/MYYU 2018 Jun 21
Okanagan MYLU/MYYU 2019 Jun 16
Okanagan MYLU/MYYU 2020 Jun 26
Okanagan COTO 2019 Jun 18
Kootenay MYLU 2016 Jun 16
Kootenay MYYU 2019 Jun 14
Peace MYLU 2017 Jun 30
Peace MYLU 2018 Jun 21
Peace MYLU 2020 Jun 28
Cariboo MYLU 2018 Jun 18
Cariboo UNK 2020 Jul 1
Thompson MYLU/MYYU 2020 Jun 19
Trends across years
Three hundred and eight (308) sites have two or more years of count data. Two hundred and forty-one
(241) of these sites have multiple years of pre-pup count data and were screened for year-to-year
declines in the pre-pup period (Appendix 2).
Visual inspection subjectively identified twenty-nine (29/241; 12%) of these sites as having a ‘large’
decline in maximum pre-pup counts. These sites were investigated individually to determine if there
were obvious causes for declines (excessive heat, bat exclusion, new roost sites nearby, large amount of
variation normally at the site, etc.; Appendix 2, Table 13). Changes in maximum pre-pup counts between
years must be considered in context of the large variation within count periods in a year (see
Variability within count periods, above) and the observed variability between years.
The majority of the sites with potentially large declines were assessed as being affected by other factors,
and not actually having a real trend of declining bat counts. These other factors were:
Annual Bat Count 2012-2020
14• exclusion (1 site),
• low suitability (difficult to monitor or not consistently use by bats in June) (3 sites),
• only two years of sampling and/or no repetition of sampling within 2020, making decline
impossible to tell from expected levels of variability in emergence and use (16 sites),
• probably poor timing of count, with post-pup numbers as expected (1 site), and
• suspected or known movement around a roost complex (all of which may or may not get
counted; 6 sites).
There were only two sites which were not affected by any of these factors to our knowledge, and
appeared to show declines over several years. One site is in the Fraser Valley. Although no alternate
roost is known, the timing of use of this roost, with bats arriving late in the season, suggests that bats
may move around. The other site is in the Cariboo. No alternate roosts are known. Both sites will be
flagged for multiple counts in 2021.
Future assessment of trends will require multiple counts in the pre-pup period, plus efforts to ensure
sites have sufficient counters to get accurate counts.
Discussion
Participation and support
Interest in the Annual Bat Count has steadily increased between 2012 and 2020. Additional volunteer
participation in the project that has allowed for the monitoring of additional sites. As well as more
counts at sites. The increased participation in 2020 came as a surprise as group events were cancelled
due to COVID 19 restrictions. Access to some sites was also severely restricted. In spite of this, the
Annual Bat Count attracted even more participants than in 2019 and continues to develop stewardship
in roost owners across BC.
There are huge benefits of volunteer involvement, including increasing the number of counts done,
increasing the geographic scope of the project, and (we believe) increased local awareness and
stewardship. However, the growth of this component of the Community Bat Program dramatically
increases the number of hours, and associated cost, invested by regional coordinators to train,
coordinate, and follow-up with volunteers.
Continued financial support for Annual Bat Count provincial and regional coordinators is critical to
ensure that sentinel roost sites are counted yearly. Coordination is required at the provincial level to set
program priorities and goals, monitor progress, analyze results and ensure that the results are available
to guide species monitoring and recovery actions. Regional coordinators need to have time to review
data, contribute to or modify the priority site list generated at the provincial-level, organize volunteers
and landowners, assist in conducting counts, and enter data. Without adequate time for planning and
coordinating the many volunteers, sampling is left in the hands of volunteers who may not be trained,
and may or may not participate in the program, and it is unlikely that all targeted sites will be counted.
Annual Bat Count 2012-2020
15Success of this broad-scale monitoring program depends on recruiting and retaining volunteers. The
program currently recruits new colonies and volunteer counters through community presentations,
press releases, and our website. Program evaluation should be done to identify if volunteers are
retained and for how long, what proportion of volunteers are new recruits, and if conducting a bat count
on your own or other property leads to increased conservation actions such as increased interested in
colony protection.
The primary sources of funding to-date for the Annual Bat Count at the provincial level have been from
Habitat Conservation Trust Foundation / Forest Enhancement Society of BC, the BC Ministry of
Environment and Climate Change Strategy. Federally, the support has been primarily from the Habitat
Stewardship Program for Species at Risk. Regional bat projects are encouraged to apply for and access
other funds to support additional counts. As the program has expanded across the province and new
sites are sought out and added to the long-term monitoring program, funding levels for this aspect of
the Community Bat Program have not increased accordingly. Future growth of the program will likely be
hampered by available funding. We need to secure alternate funds at the provincial level, plus
encourage and support regions to apply for region-specific grants. One promising avenue is increasing
partnerships with BC Parks across the province.
Species identification
One ongoing recommendation to improve the Bat Count data has been to increase the number of sites
with confirmed species identification. While the percentage of all sites with species ID has not surpassed
50 % (only 285/751 sites from 2012-2020; 38%), success at getting ID at sentinel locations has been
higher, with 90 % (40/44) of these now identified.
Species identification is necessary to understand the implications of any changes in colony size. Species
identification in 2021 should target:
1. species at all sentinel sites, and
2. sites with 2+ years of monitoring data.
At other roosts, species identification should occur as budget allows. To encourage species
identification at sentinel sites, data gaps will be highlighted with regional coordinators. Coordinators will
be responsible for ensuring sample collection for these sites, or for remote sites, obtaining mailing
addresses to which we can send a DNA collection kit.
Providing identification of the species in a roost also serves to engage landowners and encourage
stewardship. However, many new roost sites are now reported to the CBP yearly. Although the costs
and effort to collect samples are low and volunteers/landowners can easily accomplish collection, DNA
analysis of guano from all sites each year is not financially realistic. Increased reliance on acoustic
monitoring may help identify species at non-sentinel sites. The CBP has bat detectors available for use,
but capturing useful calls for ID usually requires a user with some knowledge of acoustic equipment and
sampling. Acoustic monitoring may be useful when trained regional coordinators can be on-site, but is
not applicable for many volunteers/landowners.
Annual Bat Count 2012-2020
16Potential for monitoring population trends
Number of sites and duration of monitoring
Population trend data are important for monitoring population changes that are expected from white-
nose syndrome. Catastrophic declines are expected for species that are susceptible to WNS – for
example, bat counts at hibernacula of some species in eastern North America declined by 30 – 99 %
yearly after WNS arrived (Frick et al. 2010). Detection of such large declines is easily done and does not
require statistical analyses.
However, the different winter and summer roosting ecology of western bats compared to bats east of
the Rockies may result in a different, perhaps slower, response, which would require more sites and
longer sampling duration to detect. Recovery rates will also obviously be slow and will definitely require
many sites and a long sampling duration to detect trends with high confidence.
Detection of statistically robust trends depends on a number of factors including number of sample
sites, annual replicates, annual variation, etc. (Walsh et al. 2001). Variation within and between years
depends in part on the degree of roost fidelity/switching by that species, with more roost switching
leading to more variable data and a larger number of sites required. In the UK, knowledge of the ecology
of a species is used to identify which of several survey techniques will produce the most reliable trend
(Bat Conservation Trust 2019). Research is needed in BC to investigate roost switching by species in
anthropogenic structures; this would contribute to our understanding of the effectiveness of bat counts
for population monitoring.
Walsh et al. (2001) recommended a minimum of five years of monitoring for trend information for
United Kingdom bats due to annual variations in counts. Two years of monitoring is the minimum for
using sites in trend monitoring analyses (Bat Conservation Trust 2019). Most United Kingdom (UK) bat
species required between five and nine years of counts at 100 sites to detect population changes of 5%
per year (26.2% change over 5 years).
Currently, we have 308 sites with two or more years of monitoring. This suggests there may be enough
sites to provide reliable long-term trend data for some bat species. However, also of concern is
replication within a sampling year. The number of sites required for detecting a trend increases
substantially when there is no replication and only one count is done per year at a site. For example,
Pipistrellus species in the United Kingdom required an additional 72 sites sample size, if only one count
per year was done, compared to two counts per year, to have the same statistical power to detect
change (Walsh et al. 2001). Many BC sites continue to have only one count per year; replication should
continue to be emphasized in 2021.
Species monitored
Bats appear to have different vulnerabilities to WNS, based on patterns of mortality in affected species
(WNS.org 2020) so species-specific trends are needed to monitor impacts and recovery. The Annual Bat
Count focuses on anthropogenic structures so will only be useful for monitoring BC species that
regularly use these structures. The Annual Bat Count has good potential to monitor population trends
Annual Bat Count 2012-2020
17for Little Brown Myotis and Yuma Myotis, which both suffer high mortality rates from WNS in eastern
North America (Environment Canada 2015).Little Brown Myotis has now been counted at 156 Annual
Bat Count sites; and Yuma Myotis at 119 sites. The Big Brown Bat, which is also susceptible to WNS but
does not show catastrophic declines in eastern North America (e.g., Moosman et al. 2013) has been
detected at 32 sites. More sites are likely needed to monitor this species. There are too few roost sites
for other species for them to be effectively monitored at a provincial level using the Annual Bat Count.
Sentinel locations
Forty-four (44) locations (encompassing 83 roost count sites) currently meet most of the criteria for
establishing reliable trends and are identified as ‘sentinel locations.’ However, these locations house five
species of bats. The largest sample size is 28 sentinel locations for Little Brown Myotis. This number of
sentinel locations likely does not provide enough samples for determining a provincial trend, as it does
not reach the recommended targets of 30-50 sites monitored per year per species (Walsh et al 2001).
Additional sentinel locations (tentatively estimated at 25 to 50 sites, based on Walsh et al. 2001) need to
be established in addition to the 44 existing sentinel locations to establish trends - perhaps not to detect
a rapid catastrophic decline from WNS, but certainly to monitor recovery, which would be slower.
Specific recommendations to increase monitoring and identification of species at sentinel locations are
presented below and these tasks will be a target in 2021.
Methods for detecting declines
Yearly variation in pre-pup counts was assessed graphically to identify sites of potential concern. Sites
with subjectively “large” declines were flagged. Four of the twenty sites had small counts and only one
count per session. This process underscored the importance of focussing on larger roost sites to ensure
that declines are biologically relevant.
In future, declines in sites should be quantitatively assessed. One option is to compare the percent
decrease in pre-pup count to the variation observed in pre-pup counts in previous years. Reviewing site-
specific variation over previous years should assist in determining a realistic value for concern (e.g., 20 %
decline). In 2018, the average percent difference in first and second pre-pup counts was assessed as
146 % across all counts (Kellner 2019); this reflects the large range in colony sizes and the need to use
site-specific variation to assess changes at each site.
Additionally, methods to analyze repeated count data should be investigated (e.g. program TRIM -
Trends and Indices for Monitoring data (van Strien et al 2004), Generalized Additive Models (Bat
Conservation Trust 2019), and power analyses should be run to determine if counts have power to
detect a pre-determined level of change. Again, this level of change should be determined in
consultation with provincial biologists and after considering the normal variation seen in counts pre-
WNS.
Bat boxes and the Annual Bat Count
The large number of bat boxes deployed through the Community Bat Program over time has potential to
increase our knowledge about the effectiveness of bat boxes as habitat enhancement and mitigation.
Annual Bat Count 2012-2020
18You can also read