SCHOLARWORKS WALDEN UNIVERSITY
←
→
Page content transcription
If your browser does not render page correctly, please read the page content below

Walden University
                                                                                            ScholarWorks

                                                                Walden Dissertations and Doctoral Studies
Walden Dissertations and Doctoral Studies                                                      Collection

2021

Using Health Navigators to Reduce Readmission Rates Among
Medicaid or Uninsured Female Patients in the Emergency
Department
Susan Renee Ibanez
Walden University

Follow this and additional works at: https://scholarworks.waldenu.edu/dissertations

   Part of the Health and Medical Administration Commons

This Dissertation is brought to you for free and open access by the Walden Dissertations and Doctoral Studies
Collection at ScholarWorks. It has been accepted for inclusion in Walden Dissertations and Doctoral Studies by an
authorized administrator of ScholarWorks. For more information, please contact ScholarWorks@waldenu.edu.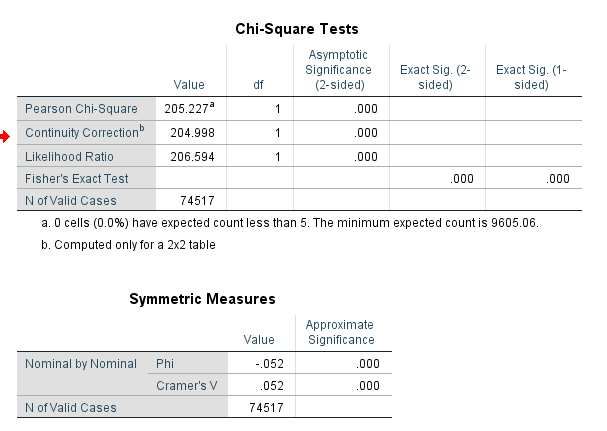
Walden University

                        College of Health Professions

                  This is to certify that the doctoral study by

                                 Susan Ibanez

        has been found to be complete and satisfactory in all respects,
                  and that any and all revisions required by
                   the review committee have been made.

                             Review Committee
Dr. Matt Frederiksen-England, Committee Chairperson, Health Sciences Faculty
        Dr. Rabeh Hijazi, Committee Member, Health Sciences Faculty
        Dr. Miriam Ross, University Reviewer, Health Sciences Faculty

                     Chief Academic Officer and Provost
                             Sue Subocz, Ph.D.

                              Walden University
                                   2021
Abstract

          Using Health Navigators to Reduce Readmission Rates

Among Medicaid or Uninsured Female Patients in the Emergency Department

                                   by

                             Susan R. Ibáñez

                    MHA, Walden University, 2016

              MAIS, University of Houston - Victoria, 2006

                 BAAS, Texas A&M - Kingsville, 1993

             Doctoral Study Submitted in Partial Fulfillment

                  of the Requirements for the Degree of

                  Doctor of Healthcare Administration

                           Walden University

                             February 2021
Abstract

There has not been a significant decrease in hospital readmission rates since the 1980s,

which has impacted staffing, operational, and financial resources. Unnecessary 30-day

readmissions result in penalties in reimbursement, additional costs, and adverse reactions

resulting from the admission for the patient. This quantitative study explored the impact

of using health navigators for an emergency department (ED) patient population. The

theoretical framework was based on the Donabedian model. The study focused on female

patients,some of whom were covered by Medicaid, and some were uninsured. This study

posed research questions targeting reducing readmission for female ED patients with no

insurance or Medicaid coverage. The three research questions sought to determine the

relationship between adding health navigators and reducing unnecessary readmission

rates in the ED for the target population. The study analyzed the correlation between the

use of health navigators assigned to patients discharged from the ED and readmission

rates tracked for 6, 12, and 18 months, and whether health navigators reduced the

readmission rate of female ED patients covered by Medicaid or were uninsured. The

results demonstrated a statistically significant difference in the readmission rates of

female ED patients covered by Medicaid with the use of a health navigator at six months

post intervention. Also, there was a relationship between gender and insurance coverage

and rate of readmission with the use of a health navigator. These findings may be used by

the health care industry to reduce readmissions resulting in positive social change.
Using Health Navigators to Reduce Readmission Rates

Among Medicaid or Uninsured Female Patients in the Emergency Department

                                   by

                             Susan R. Ibáñez

                    MHA, Walden University, 2016

              MAIS, University of Houston - Victoria, 2006

                 BAAS, Texas A&M - Kingsville, 1993

             Doctoral Study Submitted in Partial Fulfillment

                  of the Requirements for the Degree of

                  Doctor of Healthcare Administration

                           Walden University

                             February 2021
Dedication

       This project is dedicated to the person who has inspired me in every area of my

life, especially in my pursuit of education. My grandmother instilled in me the joy of

being a lifetime learner; she taught me by example and word. Her saying, "the time will

go by, and you will either regret not pursuing your goal/dream, or you will be celebrating

the accomplishment, the choice is yours, but the time will go by either way!" This

always inspired me to set the goal, take the chance, live the dream, and relish every

moment of life!
Acknowledgments

       It is with the deepest gratitude that I acknowledge all the support I have had

throughout this journey. It takes a village, and without the love, support, encouragement,

and confidence in my ability from my mother, my daughters, and my loving husband

Vincent, this journey would have been insurmountable. I must thank my brother John. If

he had not pursued his Ph.D., I do not know if I would have had the courage to take this

on. I’d also like to share my love and support for my mother in law Jane Ibanez who

brainstormed with me on dissertation topics. Additionally, I would like to acknowledge

my sincere appreciation and gratitude for support and guidance from Dr. Matt

Frederiksen-England, my Chairperson, through the entire dissertation process.
Table of Contents

List of Tables ..................................................................................................................... iii

List of Figures .................................................................................................................... iv

Section 1: Foundation of the Study and Literature Review .................................................1

           Purpose of the Study ............................................................................................... 4

           Research Question(s) and Hypotheses .................................................................... 5

           Theoretical Foundation for the Study ..................................................................... 6

           Literature Review.................................................................................................... 9

           Definitions............................................................................................................. 17

           Assumptions.......................................................................................................... 18

           Scope and Delimitations ....................................................................................... 19

           Significance........................................................................................................... 20

           Summary and Conclusions ................................................................................... 21

Section 2: Research Design and Data Collection ..............................................................23

           Research Design and Rationale ............................................................................ 23

           Methodology ......................................................................................................... 24

Section 3: Results and Findings .........................................................................................30

     Introduction ..................................................................................................................30

           Review of Research Questions ............................................................................. 30

     Data Handling ..............................................................................................................32

           Data Transfer, Translating, Scrubbing, Coding, and Organizing ......................... 32

           Data Translation ................................................................................................... 33

                                                                   i
Data Scrubbing ..................................................................................................... 33
Dependent Variable Coding ................................................................................. 33
Independent Variable Coding ............................................................................... 33
Results …..................................................................................................................... 34
Inferential Statistics for Primary Variables..................................................................34
Summary ......................................................................................................................48
Section 4: Application to Professional Practice and Implications for Social
Change ...................................................................................................................49
Interpretation of Findings ............................................................................................49
Limitations of the Study...............................................................................................51
Recommendations ........................................................................................................52
Implications for Professional Practice and Positive Social Change ............................52
Conclusions ..................................................................................................................53
References ....................................................................................................................54
Appendix A: Dataset Composition ....................................................................................62
iiList of Tables
Table 1 Descriptive Statistics – Patient Type, Patient Gender, and Insurance ............... 38
Table 2 Descriptive Statistics – Total Population ............................................................ 39
Table 3 Descriptive Statistics – Visit Financial Description ............................................ 40
iiiList of Figures
Figure 1 Mean Patient ED Visits, Pre- and Post navigation at 6 months, 12 months, and
18 months .................................................................................................................. 40
Figure 2 Visit Financial Description ............................................................................... 41
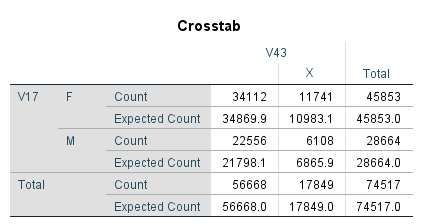
Figure 3 Cross-tabulation Table – Gender and Readmission Rate at 6 Months .............. 41
Figure 4 Cross-tabulation Table – Gender and Readmission Rate at 12 Months ............ 43
Figure 5 Cross-tabulation Table – Gender and Readmission Rate Uninsured ................ 44
Figure 6 Cross-tabulation Table – Gender and Readmission Rate Uninsured ................ 45
Figure 7 Cross-tabulation Table – Gender and Readmission Rate Uninsured ................ 46
iv1
Section 1: Foundation of the Study and Literature Review
Healthcare administrators must be aware of and manage the admissions and
readmission rates of their patient population (Dinerstein, 2018). This study used
secondary research to examine whether health navigators could reduce the readmission
rate and thus reduce Medicare penalties. The results could be used by Healthcare
administrators to understand the impact of health navigators in areas with high
readmission rates among female patients who are uninsured or covered by Medicaid. This
research could contribute to positive social change by increasing the reach of health
navigator programs and thus decreasing patient readmissions. With fewer unnecessary
readmissions, all patients would receive better care and be healthier, which could, in turn,
reduce healthcare expenditures. Reduction in readmission rates would decrease
healthcare systems' cost and thus reduce overall healthcare spending for the country
(American Hospital Association [AHA], 2018).
Section 1 covers the problem statement, purpose, research questions, theoretical
foundation, nature of the study, definitions, assumptions, literature review, significance,
and summary.
Problem Statement
A healthcare operational problem exists in the healthcare industry that involves a
lack of a significant decrease in hospital readmission rates since the 1980s, which has
impacted staffing resources, operational resources, and financial resources (Felix,
Seaberg, Bursac, Thostenson, & Stewart, 2015; Dinerstein, 2018; McIlvennan, Eapen, &
Allen, 2015). Unnecessary readmissions within 30 days of discharge result in penalties in2
reimbursement, additional costs, and adverse reactions for all patients (Dinerstein, 2018).
Current 30-day readmission rates average between 14.9% and 20% (Felix, Seaberg,
Bursac, Thostenson, & Stewart, 2015). Historical Medicare patient readmissions within
30 days averaged 20% (McIlvennan, Eapen, & Allen, 2015). In Harris County, Texas, the
largest county in Texas, ED visits totaled 1,636,187 in 2013, according to research
conducted by Begley, Hamilton, and Jeong (2015). The patient population was comprised
of 56.4% females and 43.6% males (Begley et al., 2015). Medicaid patients comprised
28.9% of ED visits, and uninsured patients made up 32.2% of the ED patients during
2015 (Begley, Courtney, Abbass, Ahmed & Burau, 2013). Nationally, 12.2% of ED
patients are uninsured, while 29.3% are covered by Medicaid (Zhou, Baicker, Taubman,
& Finkelstein, A. N. (2017). The Hospital Readmission Reduction Program (HRRP),
established in 2012 as part of the Affordable Care Act (ACA), financially penalizes
hospitals if they have a higher-than-expected risk-standardized 30-day readmissions rate
(MedPAC, 2018).
Medicare groups readmissions into three categories: all-cause, unplanned, and
potentially preventable (Centers for Medicare & Medicaid Services, 2018). According to
the Medicare Payment Advisory Commission (MedPAC) in 2014, up to 12% of
readmissions are potentially avoidable (McIlvennan, Eapen, & Allen, 2015). The New
England Journal of Medicine (2018) reported that in 2011, 3.3 million hospital
readmissions cost $41.3 billion. Since the inception of the HRRP) in 2012, CMS has
penalized hospitals $1.9 billion for excess readmissions (AHA, 2018). Readmissions can
be caused by multiple factors, including (a) instability in the patient upon discharge, (b)3
insufficient support for the patient’s recovery at discharge location, and (c) recurrence or
an advance of the original disease because of poor compliance and inadequate
supervision or follow-up (Dinerstein, 2018). There is no financial assistance component
in the HRRP for healthcare providers (CMS, 2018). The addition of the Community-
based Care Transitions Program (CCTP) created by the ACA tests models for improving
care transitions from hospital to other settings and seeks to reduce readmissions for high-
risk Medicare patients. CCTP provides for over $500 million in financial assistance to
hospitals that have applied and are approved for the program (McIlvennan, Eapen, &
Allen, 2015). Health navigators can provide transitional care, or care from hospital to
other care settings, to patients post-discharge. In this study, health navigators are
identified as case managers (inpatient) and care managers (outpatient). The CCTP can
provide funding for transitional care efforts. This service is tracked by current procedural
terminology (CPT) codes, which can further incentivize the coordination of inpatient and
outpatient care (McIlvennan, Eapen, & Allen, 2015).
Reducing potentially preventable readmissions is essential for hospital
administrators due to the substantial financial impact and critical to the patient from a
health perspective. Research has been conducted to demonstrate the value of using health
navigators for a variety of patients, including elderly patients, oncology patients, and ED
patients in general. However, there is a gap in evaluating health navigators who support
female patients—whether covered by Medicaid or uninsured—and in connecting them
with community benefit, which includes programs that provide treatment and/or promote4
health and healing, to reduce the continued high 30-, 60-, 90-day readmission rates
(Felix, Seaberg, Bursac, Thostenson, & Stewart, 2015).
Purpose of the Study
This study sought to explore the use of health navigators for female ED patients,
whether covered by Medicaid or uninsured. The research considered four dependent
variables: the rate of readmission at 6, 12, and 18 months and coverage by Medicaid and
no insurance coverage.
This study assessed the use of health navigators in the transition of care for
patients from hospital to home to reduce 30-day readmission rates, which result in
financial penalties from CMS and other payers. While this study focused on specific
CMS penalty-sensitive conditions, navigator services are applicable across other services
that may be relevant in reducing 30-day readmission rates (Prieto-Centurion et al., 2019).
This research determined how health navigators' use potentially affects the
readmission rate for female patients accessing care in the ED with no insurance and
female patients covered by Medicaid. Among the key contributing factors to unnecessary
30-day readmissions are (a) communication among care teams, (b) communication
between patient and provider, and (c) better support for patient self-management
(Auerbach, et al., 2016). The dataset used for this research contained observations of over
27,412 ED patients, from December 2013 through July 2019, from a health system in
Houston, Texas.5
Research Question(s) and Hypotheses
This study posed three research questions to determine the relationship between
the process change of adding health navigators and the desired result of reducing
unnecessary readmissions rates in the ED for the target population.
RQ1 –What is the relationship between the use of health navigators and the rate of
readmissions for female ED patients who have Medicaid at six months post-
discharge for a patient population of ED patients treated at a health system in
Houston, Texas for the period of December 2013 – July 2019?
H01 – There is no statistically significant difference in the rate of readmission
for female ED patients who have Medicaid with the use of a health navigator
at six months post intervention for a patient population of ED patients treated
at a health system in Houston, Texas.
H1- There is a statistically significant difference in the readmission rate for
female ED patients who have Medicaid with the use of a health navigator at
six months post intervention for a patient population of ED patients treated at
a health system in Houston, Texas.
RQ2 –What is the relationship between the use of a health navigator and the rate
of readmissions for female ED patients who have Medicaid at 12 months post
intervention for a patient population of ED patients treated at a health system in
Houston, Texas for the period of December 2013 – July 2019?
H01 – There is no statistically significant difference in the rate of readmission
for female ED patients who have Medicaid with the use of a health navigator6
at 12 months post intervention for a patient population of ED patients treated
at a health system in Houston, Texas.
H1- There is a statistically significant difference in the readmission rate for
female ED patients who have Medicaid with the use of a health navigator at
12 months post intervention for a patient population of ED patients treated at a
health system in Houston, Texas.
RQ3 – What is the relationship between the use of a health navigator and the
readmission rates for uninsured female ED patients for a patient population of ED
patients treated at a health system in Houston, Texas for the period of December
2013 – July 2019?
H01 – There is not a statistically significant difference in the readmission rates
of female ED patients who are uninsured with the use of a health navigator for
a patient population of ED patients treated at a health system in Houston,
Texas.
H1- There is a statistically significant difference in the readmission rates of
female ED patients who are uninsured with the use of a health navigator for a
patient population of ED patients treated at a health system in Houston, Texas.
Theoretical Foundation for the Study
The theoretical framework used for this study was the Donabedian model, which
was developed by Avedis Donabedian (2005) to evaluate the quality of care and to
measure improvement in care. The theory uses three components—structure, process, and
outcomes, along with a balancing measure—to measure quality and improvement in care.7
The structure of care component identifies the context in which the care occurs and other
elements, such as the healthcare professional's training, in this case, the health navigator.
The Donabedian theoretical model is well aligned with this research to analyze
improvement projects and provide process, outcome, and structure and balancing
measures (NHSI ACT Academy, 2008). The process measures demonstrate how the
process and system work to produce the outcome or demonstrate whether there is a
relationship between the implementation of health navigators and a reduction in
readmissions. The process component determines what takes place in the interaction
between health navigator and patient. The outcome measures indicate the impact on the
patient (NHSI ACT Academy, 2008). In this study, the outcome component identifies the
impact on the health of the patient with the health navigator's service. It reveals whether
there is a relationship between the interaction of the navigator and the readmission rate.
The structure measure shows the service attributes, in this case, the health navigator and
the tasks and services provided (NHSI ACT Academy, 2008). Finally, the balancing
measure in the Donabedian model shows the relationship or consequences of the change
implemented; in this study, the introduction of health navigators in the ED (NHSI ACT
Academy, 2008). In this study, the balancing measure is the monitoring and measuring
ED readmission rates following the workflow change of adding the navigators.
Nature of the Study
This study used correlational, quantitative research methods with secondary data
from a dataset provided by a health system in Houston, Texas. This study also used data
from the Agency for Healthcare Research and Quality (AHRQ), specifically from the8
Healthcare Cost and Use Project (H-CUP-US) of the National Readmission Database
(NRD). The NRD enables analyses of national readmission rates for all types of payers
and the uninsured (AHRQ, 2018). This database is limited to inpatient admissions and
discharges, which aligned with this study.
The study analyzed the correlation between the use of health navigators at a
health system in Houston, Texas, who were assigned to patients discharged from the ED;
their readmission rates tracked for 6, 12, and 18 months. Health navigators for this study
were identified as case managers (inpatient) and care managers (outpatient). SPSS
software was used to analyze the data. Statistical decomposition methods were applied to
the data to determine whether the use of health navigators reduced the readmission rate of
female ED patients, whether covered by Medicaid or uninsured.
Secondary datasets were accessed from a health system in Houston, Texas, and
AHRQ, specifically H-CUP-US (2017). The health system dataset contained 27,412
patients identified as assigned a health navigator post-discharge from the ED. Patients
were tracked at intervals of 6, 12, and 18 months. The AHRQ dataset contained
discharge-level information on inpatient, ambulatory surgery, or ED care in U.S.
hospitals. The AHRQ dataset included the following elements: national readmission rates
by diagnosis, procedure, patient demographics, expected payment source, costs
associated with readmissions, reasons for readmissions, the impact of health policy
changes, and readmissions by special populations (AHRQ, 2019).9
Literature Review
In the following literature review, I explored peer-reviewed articles centered on
ED use and payer mix in Houston, Texas—including uninsured, commercially insured,
and government payers (Medicaid/Medicare), national statistics were included as well.
Sociodemographic factors affecting healthcare selection and utilization were also
included in this research. Significant research was conducted in the literature presented
by the AHA, H-CUP, AHRQ, and the National Readmission Database. Research also
focused on Health Navigators in various care scenarios, including geriatric, oncology,
and cardiology. Specific research was conducted in the area of health disparities and
women. This study's primary dataset was derived from a health system in Houston,
Texas, and H-CUP data.
The following two databases were used, EBSCO and CINAHL (Cumulative
Index to Nursing & Allied Health Literature). The following keywords were used: health
navigators, patient navigation, readmission rates, 30-day readmissions, emergency
department, uninsured, and avoidable readmissions.
A healthcare operational problem exists in the healthcare industry that involves a
lack of a significant decrease in hospital readmission rates since the 1980s, which has
impacted staffing resources, operational resources, and financial resources (Felix,
Seaberg, Bursac, Thostenson, & Stewart, 2014, Dinnerstein, 2018; McIlvenan, Eapean, &
Allen, 2015). Unnecessary readmissions within 30 days of discharge results in penalties
in reimbursement from Medicare, additional costs, and adverse reactions for the patient.10
Reducing potentially preventable readmissions is essential for hospital administrators due
to the substantial financial impact and critical to the patient from a health perspective.
Factors Influencing Readmissions
Understanding the cause of readmissions is important in determining successful
strategies in reducing unnecessary 30 day readmissions. According to research
conducted by Nagasako, Reidhead, Waterman and Dunagan (2014), hospital
readmissions are identified as costly and an all too common occurrence. This is especially
true among patients covered by Medicare. Social factors including race, gender and
education level are cited as potential determinants of readmissions and patient outcomes.
Herrin, St Andre, Kenward, Joshi, Audet, and Hines (2015) present research that
examines the influence of community characteristics and health system characteristics at
a county level on 30 day readmission rates. While previous research had been conducted
examining the relationship between sociodemographic charcteristics, the connection of
the health system and community or county component had not had substantial research.
Specifically, access to care within a community is cited as a factor in the likelihood of
readmission. Additionally, number of Medicare beneficiaries per capita is cited as a
demographic factor that has impact upon the 30 day readmission rate. The number of
primary care practitioners and specialists were also associated with the readmission rate.
The number of primary care practitioners can influence access to care and provide
patients with limited options for care other than emergency department care.
Impact of Readmissions11
Hospitals are incentivized to reduce readmission rates for a variety of factors.
Upadhyay, Stephenson and Smit (2019) cite transparency of quality of indicators as an
important incentive. Patients have increasing access to hospital quality data and quality
scores based on readmission rates can impact patient choices of health care systems.
Quality scores are linked to profitability and market share for health systems.
Additionally, the penalties associated with unnecessary readmissions based on the CMS
Readmission Reduction Program is a strong financial incentive for health care
administrators to focus on reducing readmission rates.
According to Felix, Seaberg, Bursa, Thostenson, and Steward (2015), unnecessary
30-day readmissions negatively impact healthcare providers' costs, health systems and
negatively impact patient outcomes. Poor care coordination upon discharge is an
indicator, along with multiple clinical factors that can determine readmission rates.
According to the New England Journal of Medicine (2018), in 2011, there were 3.3
million hospital readmissions in the United States, which resulted in $41.3 billion in
associated costs. In a study presented as part of the HCUP (Healthcare Cost and
Utilization Project), Bailey, Weiss, Barrett, and Jiang (2019) reported that for any
diagnosis, the average cost of readmission is $14,400 for readmissions between the years
2010-2016.
Hospitals see a substantial financial impact on unnecessary readmissions when
patients readmit within 30-days of discharge (Upadhyay, Stephenson, & Smit, 2019). The
Hospital Readmission Reduction Program (HRRP) is a Medicare value-based purchasing
program that decreases payment to hospitals that do not meet performance indicators in12
six conditions (Upadhyay, Stephenson, & Smit, 2019). In a study presented as part of the
HCUP (Healthcare Cost and Utilization Project), Bailey, Weiss, Barrett, and Jiang (2019)
reported that for any diagnosis, the average cost of readmission is $14,400 for
readmissions between the years 2010-2016. With the Affordable Care Act's
implementation, readmission rates are required to be released and are considered a
critical quality metric for healthcare systems (Upadhyay, Stephenson, & Smith, 2019).
Consequently, increased readmission rates cause higher use of resources and decreased
margins, but they may ultimately deter prospective patients as readmission rates are
published quality metrics (Upadhyay, Stephenson, & Smit, 2019).
While readmission rates overall fell 7% for patients covered by Medicare from
2010-2016, they increased for uninsured patients by 14% (Bailey, Weiss, Barrett, and
Jiang, 2019). During this time period, patients covered by Medicare were the highest for
30-day readmissions, followed by Medicaid and uninsured patients (2019). According to
Dinnerstein (2018), readmissions can result from a variety of factors, including
discharging the patient too early, before stabilization; discharge to a location that cannot
support recovery; recurrence or worsening of original disease because of poor patient
compliance or inadequate supervision.
ED Utilization
ED visits are among the highest costs of treatment resources, with the average
cost of an ED visit $1,016 in 2017 (Consumer Health Ratings, 2020). ED use can result
in high-cost services to individuals with an average cost of treatment in the ED estimated
at $2,032, which is approximately 12 times higher than a physician's office visit for13
similar conditions (LaPointe, 2019). In Harris County during 2007, there were 1,060,825
total ED visits (Begley, Courtney, Abbass, Ahmed, & Burau 2013). Uninsured patients
comprised 30.6% of all ED visits, and Medicaid patients comprised 18.6% of ED visits
(Begley, Courtney, Abbass, Ahmed, & Burau 2013). Female patients made up 52.5% of
all ED visits (Begley, Courtney, Abbass, Ahmed, & Burau 2013).
In research conducted by McCormack, Jones and Coulter (2017), demographic
factors are examined as factors in ED utilization. Factors included age, gender,
race/ethnicity, urbanicity and federal poverty level (FPL). Females were 41% more likely
to have a nonurgent ED visit and patients age 50-65 represented the lowest utilization of
ED visits. Between 30-50% of all ED visits are classified as nonurgent care needs which
could be serviced by lower level of care providers.
In Houston, Texas, 26 emergency departments provide services to the general
public (Begley, Courtney, Abbass, Ahmed, & Burau, 2013). A large not for profit health
system in Houston, Texas, which was the focus of this study as of 2013, made up 9 of the
hospitals with ED services included in this research. Medicaid patients utilize the ED at
higher rates than patients covered by commercial insurance or private insurance (Kim,
McConnell, & Sun, 2017). A variety of factors may contribute to the higher use rates,
including lower copayments or limited access to primary care services (Kim, McConnell,
& Sun, 2017). Research conducted by Kim, McConnell, and Sun (2017) reported that
approximately 44.5% of Medicaid patients visit the ED at least once per year, which is
four times higher than commercially insured patients. The research also showed that
Medicaid patients utilized ED care in significantly higher numbers than Medicaid14
patients who accessed other care services such as mental health and inpatient care (Kim,
McConnell, & Sun, 2017).
The Texas Medicaid program is the third largest Medicaid program in the
country. Delcher, Yang, Ranka, Tyndall, Vogel and Shenkman (2017), conducted
research on the Texas Medicaid program population. The Texas Medicaid population
proportionally utilize the ED at a rate of more than twice what non-Medicaid populations
do. According to this research, females utilized ED services at 79.10% for ED visits
between five to six times and at a rate of 67.48% for 15 or more ED visits in a year in
2014. Females represented extremely high utilization of ED services, those with 15 or
more visits at a rate of 75%. Within the population of Texas Medicaid patients, 31%
utilized ED services at least one time per year. Extremely frequent ED utilization,
measured as greater than 10 ED visits within one year was reported as less than 1% of all
Texas Medicaid patients. However, the extremely frequent utilization represented 17.4%
of total ED costs. Medicaid costs make up between $27 billion to $47 billion annually of
national health care expenditures. Approximately $64.4 billion is spent on potentially
avoidable ED visits including all ED patients.
Health Navigator Program
Health navigation services have developed in response to healthcare delivery
services' complexity and have been implemented in various patient care settings (Carter,
Valaitis, Lam, Fether, Nicholl, & Cleghorn, 2018). Patient navigation services assist
patients with a variety of services intended to break down barriers of care, bridge gaps of15
service, and assist patients with complex care needs by assisting with needed resource
connections (Carter, Valaitis, Lam, Fether, Nicholl & Cleghorn, 2018).
Health navigators may be referred to under different titles, including community
health worker, community health liaison, case manager, or health advocate (Carter,
Valaitis, Lam, Fether, Nicholl, & Cleghorn, 2018). Barriers to care can include access to
health care, insurance, poor health literacy, transportation, childcare, and more, according
to research conducted by the Colorado Department of Public Health and Environment
(2019).
According to Wells, Valverde, Ustjanauskas, Calhoun, and Risendal (2019),
health navigators used in healthcare systems may possess a variety of skills, including
care coordination and referral services. Patient navigators' various skillsets are presented
and analyzed. This research defined the essential qualification for health navigators as
being a "cultural broker and interpreter" (p. 9). It is not necessarily a requirement for
health navigators to hold a clinical degree, depending on the services they provide. In
roles where navigators provide expanded services such as screening, diagnostic, and
treatment services, they would require clinical qualifications and licensure. Correlations
identified include services provided by navigators to uninsured or Medicaid patients
frequently involved in providing basic navigation and care coordination and referrals to
services. Health navigators' services are suggested to reduce some health disparities
identified in uninsured patients and Medicaid patients.
Healthcare disparities exist across the country and can be impacted by
geographical location, gender, age, race, ethnicity, and disability (Natale-Pereira, Enard,16
Nevarez, & Jones, 2011). Health disparities can impact access to care and the use of care,
but according to research by Carter, Valaitis, Lam, Fether, Nicholl, and Cleghorn (2018),
it can also impact patient outcomes. Navigators are a crucial component in assisting
patients in overcoming barriers and coordinating access to comprehensive services.
Patients may face challenges such as language barriers, cultural beliefs, transportation,
and child care. The authors also propose that distrust of healthcare services and
perception of disrespect may be an area that Navigators can assist with addressing.
Prieto-Centurion, et al. (2019) conducted and presented the Patient Navigator to
Reduce Readmissions (PARTNER) study. This study assessed the use of Navigators in
the transition of care for patients from hospital to home to reduce 30-day readmission
rates, resulting in financial penalties from CMS and other payers. While this study
focused on specific CMS penalty sensitive conditions, it is acknowledged that navigators’
services are applicable across other services and may be relevant in reducing 30-day
readmission rates (Prieto-Centurion, et al., 2019).
The ACA did not allocate any direct funding to provide health navigator services.
The offset that providers should consider when implementing a navigation program is a
potential reduction in Medicare penalties for 30-day readmissions. Shommu, Ahmed,
Rumana, Barron, McBrien, and Turin (2016) reported that while cost-effectiveness is an
important consideration for communities when considering this type of program, the
quality-adjusted life years gained present the benefit in health navigator use.
Additional research conducted by Wang, et al. (2015) suggested that personal
contact between patients and health navigators helps patients stay engaged and navigate17
the healthcare system. This study also demonstrated higher compliance rates by patients
and engagement in their healthcare (Wang, et al., 2015). This study reported that direct
contact between the health navigators and patients improves patient outcomes and
management of healthcare issues, thus potentially reducing readmissions.
Vargas (2016) presented research that suggests that uninsured patients may have a
distrust or misunderstanding of the health care system in general. Health navigators may
help this patient population that fosters a distrust of the system. Health navigators may
assist this population by building rapport with patients, addressing some negative
perception of the health care system. Vargas suggests that the navigators unlike typical
health care workers such as physicians and nurses, may present a more trustworthy
partner in accessing health resources.
Definitions
Emergency department admission: An ED admission is defined as a patient with a
disposition from ED to "admitted as an inpatient" or "transfer to a short-term hospital"
(Venkatesh, Dai, Ross, Schuur, Capp & Krumholz, 2015, p.4).
30-Day unplanned readmissions: According to the Centers for Medicare and
Medicaid, readmission and death rates are measured within 30 days because it is less
likely that readmissions and deaths after that period or after a more extended period
would have an association with the care received in the hospital and potentially would be
related to other illnesses, the behavior of the patient, or care received after discharge
(CMS, 2020).18
Health Navigator: For this study, a health navigator is a member of the healthcare
team who helps individuals overcome barriers to quality care. Health navigators are
identified as Case Managers (Inpatient) and Care Managers (Outpatient). These barriers
can include access to health care, insurance, poor health literacy, transportation,
childcare, and more, according to research conducted by the Colorado Department of
Public Health and Environment (2019). In this study, health navigators are identified as
Case Managers (Inpatient) and Care Managers (Outpatient).
Payer: Payer is the expected payer for the hospital stay (Sun, Karaca, & Wong,
2017). Payer grouping by HCUP data sources and for this research include: Medicare,
which includes patients covered by fee-for-service and managed care Medicare;
Medicaid, which includes patients covered by fee-for-service and managed care
Medicaid; Private Insurance which includes commercial carriers and private health
maintenance organizations (HMOs) and preferred provider organizations (PPOs); and
Uninsured, which includes the status of self-pay and no charge.
Assumptions
Assumptions in this study included the assignment, and the use of health
navigators may reduce the readmission rate. An additional assumption is that gender and
financial status, that is, uninsured or government insurance coverage status, does not
correlate with the readmission rate impacted using health navigators. Additional
assumptions are that the use of health navigators in the ED care location is in alignment
with other use cases such as geriatrics and oncology. Assumptions in this study also
included the accuracy of the secondary data.19
Limitations
This study was limited to a health system in Houston, Texas. The scope included
female ED patients that had presented to the health system for the period of 2013 – 2019
and tracked their subsequent ED use post intervention of a health navigator.
The study intended to identify the impact of health navigators on this patient
population. The data analyses focused on recurring readmission rates for this patient
population. The results cannot conclude that the use of health navigators improved any
clinical outcomes or health status. There may be financial limitations to the adoption of
health navigator programs as funding is typically the responsibility of the health system.
Currently, limited funding at the state or national level exists.
Scope and Delimitations
This research focused on gender and insurance as a predetermination of avoidable
readmission rates. The percentage of the patient population contained in the data set
represents an opportunity to have a significant positive impact on the research problem.
The dataset used for this research contains observations of 27,412 ED patients
from December 2013 through July 2019 at a health system in Houston, Texas. In the
population, patients were observed at 6, 12, and 18 months of pre-/post-intervention
Patients included in the study received health navigation services post-ED intervention.
This research faced limitations due to the use of secondary data sources, which
can include incomplete datasets and variances in data formatting. Additionally, the
primary dataset used includes patients assigned health navigator services at a Houston,20
Texas health system. While the patient population consists of 27,412 patients, the single
health system and single geographic location may limit the application of these results in
other healthcare markets due to differences in community benefits available to patients.
The H-CUP-US dataset used annual discharge data.
Consequently, the annual file included patients admitted in the year prior and
discharged in the current year but excluded patients admitted in the current year but
discharged in the next year. This resulted in the chance of 30- or 60-day readmissions for
patients admitted in the latter part of the year not being captured if the subsequent
admission crossed into the next year (AHRQ, 2018). Because of the annual file structure,
2010-2016, NRD data cannot be combined across data years to create a multiyear
database. Access to data, the cost for dataset access, and data storage requirements also
created barriers.
Significance
Healthcare administrators must be aware of and manage admissions and
readmission rates for their patient population (Dinnerstein, 2018). This study examined
the potential for the use of health navigators assigned to patients to assist in navigating
the healthcare system and identifying and using community benefits to reduce
readmission rates and potential penalties charged to health systems resulting from
unnecessary readmissions.
This research has implications for positive social change. The results could be
used to analyze the effectiveness of health navigator programs and propose guidelines for
their expansion to help patients identify and use community benefits. Patient outcomes21
may be improved, and patient well-being may be increased. Reduction in readmission
rates will decrease healthcare systems' costs, thus reducing overall healthcare spending
for the country (AHA, 2018).
Summary and Conclusions
This study used secondary data to determine whether the use of health navigator
services reduces readmission rates for the population of 27,412 Emergency Department
patients at a health system in Houston, Texas. The research was designed to analyze the
effectiveness of and propose guidelines for ease of adoption and use of health navigators
in other health systems for Medicaid and uninsured female patients. Healthcare
administration can use the results to understand the impact of health navigators in patient
care areas with high readmission rates.
The literature review indicated that barriers to access and resources can increase
readmission rates. Many factors can affect how to access care and follow-up on care, and
compliance is addressed by patients discharged from the emergency department.
Research has been conducted in various use cases, and this study focused on gender and
insurance status as potential factors increasing the readmission rate.
Governmental and policy changes are imposing penalties on healthcare systems
when readmission rates exceed specified limits. Quality standards identify readmission
rates as a factor in disease management and patient safety and quality. Research in this
area indicates that health navigators have proven to have a positive impact on care
transition in oncology patients, cardiology patients, and geriatric patients. Gender and
insurance coverage status has not been researched significantly from an ED discharge22
perspective. Therefore, this study provided some insight into those factors and the
relationship to readmission rates.
In Section 2, I present an overview of the research design and data collection
utilized in this study. Section 3, I summarized the results and findings of the study.
Section 4 I present information on the implications of the study results and presented
opportunities to apply these findings in healthcare systems.23
Section 2: Research Design and Data Collection
This study sought to explore the impact of using health navigators for ED
patients, focusing on female patients covered by Medicaid or uninsured. The research
considered four dependent variables: rate of readmission at intervals of 6 and 12 and 18
months and coverage by Medicaid or no insurance coverage. The independent variables
were health navigator engagement, patient care location of the ED, and patient gender.
In Section 2, I cover the following: an introduction of the research design and
rationale, a discussion of the methodology, a review of the secondary data types and
sources of information, threats to validity, and ethical procedures. This section offered
support for the research methodology used. It covered the following topics: research
design and rationale, methodology, sampling and sampling process, quantitative data,
instrumentation, data analysis, threats to validity (external and internal), and ethical
procedures.
Research Design and Rationale
This study used a correlational quantitative research method and used secondary
data in the dataset provided by a health system in Houston, Texas (2019). Additionally,
this study used data from the Agency for Healthcare Research and Quality (AHRQ), and
specifically from the Healthcare Cost and Utilization Project (H-CUP-US) National
Readmission Database (Barrett & Bailey, 2018). The National Readmissions Database
(NRD) enables analyses of national readmission rates for all types of payers as well as
the uninsured (AHRQ, 2018). The NRD database data is drawn from the H-CUP State
Inpatient Database (SID) program with verified patient linkage numbers that can be used24
to track readmissions across hospitals within a state. The NRD is the only nationally
representative database dedicated to the study of hospital readmissions. This database is
limited to inpatient admissions and discharges, which will align with this study. The
NRD allowed for a comparison of readmission rates.
The study analyzed the correlation between the use of health navigators at a
health system in Houston, Texas, assigned to patients discharged from the ED and the
readmission rates tracked for 6, 12, and 18 months. The study compared the readmission
rates to those patients without navigational services as reported in AHRQ statistical data.
Statistical decomposition methods were applied to the data to determine whether the use
of health navigators had a positive impact on reducing the readmission rate of female ED
patients covered by Medicaid or uninsured.
This study's design was selected as a quantitative study to determine if there are
quality of care and readmission rate improvements. Additionally, the design is used to
provide a statistical evaluation of the potential impact based on gender and insurance
coverage or lack of insurance coverage.
Methodology
Power Analysis. The dataset used for this secondary data analysis contained
observations of 27,412 ED patients, from December 2013 through July 2019, at a health
system in Houston, Texas. I used SPSS to conduct a (post hoc) power analysis on this
secondary dataset. A priori power analysis was appropriate for this study, where α = .05
and power (1 – β error probability) = .8. The effect size was set at a medium effect size, f
2
= .15. The sample size was N = 27,412, which reflected the secondary dataset (filtered25
for ED patient location, a date range of December 1, 2013, through July 31, 2019, and
all-payer/financial classes). Females comprised 16,176 patients or 59.0% of the total
sample size; 22,224 or 81.1% of patients were self-pay/uninsured and Medicaid patients
made up 3,974 or 14.5% of the population (see Appendix C). Data were collected via the
NOMAD reporting system, which contains Cerner EMR (electronic medical record) and
Allscripts Health Quest Patient Registration and Patient Accounting System records. All
ED patients during the 2013–2019 period were included in the population. Patients were
observed at 6, 12, and 18 months pre and post-intervention. Patients included in the study
received health navigation services post-ED intervention.
This study posed three research questions involving quality improvement
processes that targeted the reduction of readmission for female ED patients with no
insurance or with Medicaid coverage. The research questions sought to compare patients
in the target population who got help from health navigators (and any resulting reduction
of unnecessary readmission rates in the ED) to patients who did not receive navigational
services.
RQ1 –What is the relationship between the use of health navigators and the rate of
readmissions for female ED patients who have Medicaid at six months post-
discharge for a patient population of ED patients treated at a health system in
Houston, Texas for the period of December 2013 – July 2019?
H01 – There is no statistically significant difference in the rate of readmission
for female ED patients who have Medicaid with the use of a health navigator26 at six months post intervention for a patient population of ED patients treated at a health system in Houston, Texas. H1- There is a statistically significant difference in the readmission rate for female ED patients who have Medicaid with the use of a health navigator at six months post intervention for a patient population of ED patients treated at a health system in Houston, Texas. RQ2 –What is the relationship between the use of a health navigator and the rate of readmissions for female ED patients who have Medicaid at 12 months post intervention for a patient population of ED patients treated at a health system in Houston, Texas for the period of December 2013 – July 2019? H01 – There is no statistically significant difference in the rate of readmission for female ED patients who have Medicaid with the use of a health navigator at 12 months post intervention for a patient population of ED patients treated at a health system in Houston, Texas. H1- There is a statistically significant difference in the readmission rate for female ED patients who have Medicaid with the use of a health navigator at 12 months post intervention for a patient population of ED patients treated at a health system in Houston, Texas. RQ3 – What is the relationship between the use of a health navigator and the readmission rates for uninsured female ED patients for a patient population of ED patients treated at a health system in Houston, Texas for the period of December 2013 – July 2019?
27
           H01 – There is not a statistically significant difference in the readmission rates

           of female ED patients who are uninsured with the use of a health navigator for

           a patient population of ED patients treated at a health system in Houston,

           Texas.

           H1- There is a statistically significant difference in the readmission rates of

           female ED patients who are uninsured with the use of a health navigator for a

           patient population of ED patients treated at a health system in Houston, Texas.

Secondary Data Types and Sources of Information

       Secondary datasets used were accessed from a health system in (2019) and the

(AHRQ), specifically the (H-CUP-US) (2017). The dataset contains 27,412 patients

identified as those assigned a health navigator post-discharge from the emergency

department. Patients are tracked at intervals of 6, 12, and 18 months. The AHRQ dataset

contains discharge-level information on inpatient, ambulatory surgery, or ED care in U.S.

hospitals. The AHRQ dataset includes the following data elements: national readmission

rates by diagnosis, procedure, patient demographics, or expected payment source, costs

associated with readmissions, reasons for readmissions, the impact of health policy

changes, and readmissions by special populations (AHRQ, 2019). Access to this dataset

was requested and approved through the System Director, Clinical Research Operations

at a health system in Houston, Texas – Texas Medical Center IRB process. Walden

University IRB study number 11-12-20-0522850.

Threats to Validity
28
This research faced limitations due to the use of secondary data sources, which
can include incomplete datasets and variances in the formatting of data. Additionally, the
primary dataset used included patients assigned health navigator services at a Houston,
Texas health system. While the patient population includes over 27,412 patients, the
single health system and single geographic location may limit the application of these
results in other healthcare markets due to differences in community benefits available to
patients. The H-CUP-US dataset uses annual discharge data.
Consequently, the annual file included patients admitted in the year prior and
discharged in the current year but excludes patients admitted to a hospital in the current
year but discharged in the next year. This will result in 30, or 60-day readmissions for
patients admitted in the latter part of the year, potentially not being captured if the
subsequent admission crosses into the next year (Agency for Healthcare Research and
Quality, 2018). Because of the annual file structure, 2010-2016, NRD data cannot be
combined across data years to create a multiyear database. Access to data, the cost for
dataset access, and data storage requirements may also create barriers.
Ethical Procedures
Patient data for this study were de-identified patient data. The dataset for this
study would be destroyed upon completion of the research and presentation of the
findings. Original data used for the compilation of the dataset is maintained and
destroyed based on a health system's regulatory and organizational policies in Houston,
Texas.
SummaryYou can also read