OSCEOLA COUNTY 2017 2020 - Florida ...
←
→
Page content transcription
If your browser does not render page correctly, please read the page content below
O SCEOLA
                         C OUNTY

COMMUNITY HEALTH IMPROVEMENT PLAN

                        2017‐2020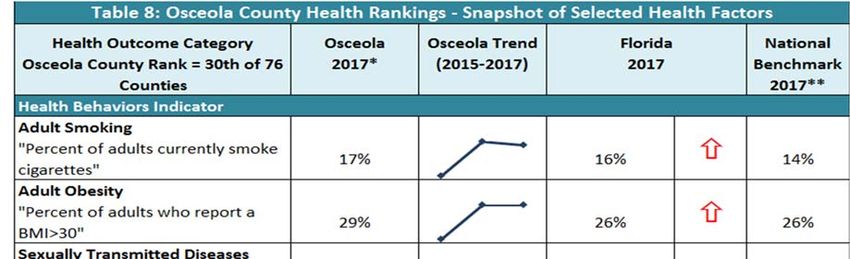
Vision Statement

  “Osceola County will be a community where uninsured
 and underinsured residents have full access to the health
                care services they need.”

A vision was created through the work of the Osceola Health Leadership Council and the
Osceola Health Summit participants. The revised vision created a narrower focus needed for
the Community Balanced Scorecard to target specific issues.

                                       2017‐2020 Community Health Improvement Plan    i
Table of Contents

Introduction to the Community Health Improvement Plan .......................................................................... 1
Osceola County – Community Profile “At‐a‐Glance” ................................................................................... 5
Building Community Capacity Utilizing the SEM Model................................................................................ 7
Osceola County’s Health Rankings Report……………………………………………………………………………………………... 13
Osceola County Chronic Diseases “At‐a‐Glance” …………………………………………………………………………………….15
Preventable Hospital Stays and Inappropriate ER Utilization “At a Glance”.…………………………………………...18
Fetal and Infant Mortality “At a Glance” ………………………………………………………………………………………………. 19
Overview of the Osceola County Community Health Improvement Plan…………………………………………………22
How to Use This Community Health Improvement Plan………………………………………………………………………... 28

APPENDICES
      Appendix A: Osceola County Health Leadership Council Membership Roster 2017…………………. 30
      Appendix B: Osceola County Community Balanced Scorecard ..................................................... 31
      Appendix C: Rationale & Resources to Support Community Health Improvement Action
      Plans. ............................................................................................................................................. 32
      Appendix D: The 10 Essentials of Public Health Services ............................................................... 33
      Appendix E: 2017 Osceola Business of Health Summit Participants. ........................................... 36

                                                                 2017‐2020 Community Health Improvement Plan                                    ii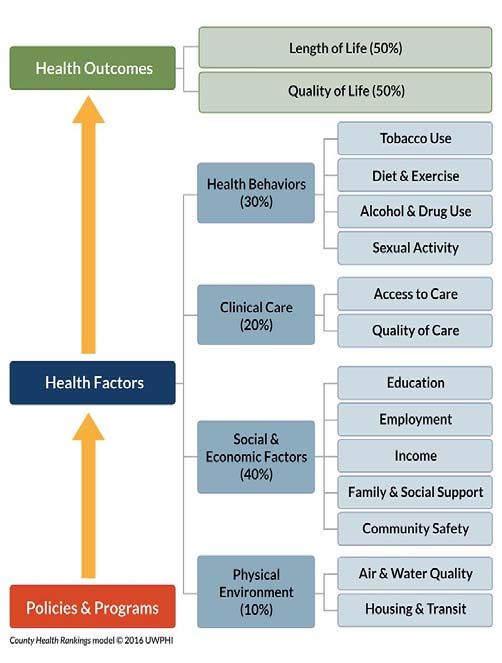
Introduction to the Community Health Improvement Plan
_________________________________________________________________________________________________________
PUBLIC HEALTH BELONGS TO THE COMMUNITY
Public health is “what we as a society do collectively to assure the
conditions in which people can be healthy.” 1
Health has been defined as being more than the absence of illness; rather, health is a “dynamic
state of complete physical, mental, spiritual, and social well‐being.”2
The health of a community depends on many factors, many outside of health care. Interwoven
are demographic, social, economic, and environmental factors. Also, health outcomes and how
healthcare services are utilized can vary widely between different populations groups such as
age, race, ethnicity, and gender, as well as education and income.
MOBILIZING THE COMMUNITY
While Public Health does belong to the community, improving health requires partners. Osceola
County is a community with an impressive history of coming together to address the public’s
health. The community has greatly benefited from the tangible results that have occurred.
Based on the needs identified through the Community Health Needs Assessment (CHNA) 2016
Osceola County will move forward in improving the lives and health of its residents.
Under the umbrella of the Osceola Health Leadership Council, the combined effort of
stakeholders such as government, healthcare, social services, non‐profits, grass‐roots, faith‐
based, business, and an involved citizenry has enhanced our community’s ability to address the
public’s health. As the keynote speaker at the Osceola Summit on Health 2017, Belinda
Johnson‐Cornett, Administrator of Department of Health in Osceola and Jim Shanks, CEO Park
Place Behavioral Health Center, laid the foundation for key discussions on how we can join
forces to address our community’s health. Mrs. Johnson‐Cornett focused on Asthma and the
statistics associated with it. She concluded her speech by stating that:
“Controlling Asthma requires broader action which will require us to work together to develop and
institute effective program and policy solutions that will improve”:
Self‐management support
Care coordination and case management
Outreach and community education
Surveillance of disparities
Control of environmental factors that affect asthma
Housing quality
Ambient air quality
Community capacity to control asthma
The quality of medical care”
2017‐2020 Community Health Improvement Plan 1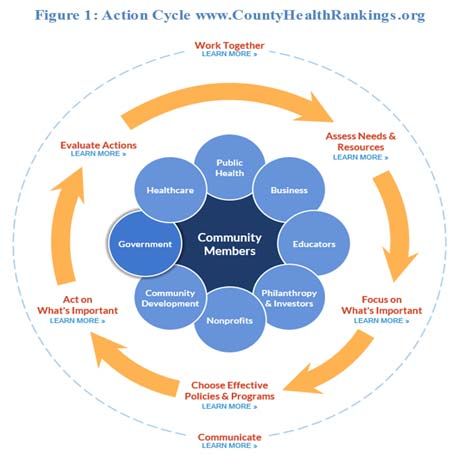
By utilizing our community’s resources, we can make Osceola County a healthier place to live,
learn, work, and play.

1
    Institute of Medicine: Committee for the Study of the Future of Public Health (1998)
2
    World Health Organization (1998), Resolution EB101.R2., Geneva

                                                   2017‐2020 Community Health Improvement Plan   2
INTRODUCTION TO THE COMMUNITY HEALTH IMPROVEMENT PLAN ‐ CONTINUED
_________________________________________________________________________________________________________

This document, the 2017‐2020 Osceola Community Health Improvement Plan, was developed
based on the collaborative efforts of many members from our community’s public health system.
Under the guidance of the Osceola Health Leadership Council and championed by the Florida
Department of Health in Osceola the process of assessing, prioritizing, and addressing health
needs in our community resulted in this Plan and its companion document, the 2016
Community Health Needs Assessment. Together, these two documented processes provide
clear strategic direction for achieving improvements in our community’s health.

One of the major tools used in the 2016 Community Health Needs Assessment was the Social‐
Ecological Model of Health (SEM) developed by the Center for Disease Control and Prevention
(CDC), which helped identify opportunities for improvement and gaps in the
community resources and helped set measurable targets to move our community forward
in improving health. Both the 2016 Community Health Needs Assessment and the Community
Balanced Scorecard provide the foundation for this Community Health Improvement Plan (CHIP).

The purpose of the CHIP is to describe the short‐ and long‐term strategies and activities that
will help achieve improvements in our community’s health. The CHIP includes a brief
description of why these strategies and activities are important. Our community health priorities
are centered on the Community Balanced Scorecard’s four “Perspectives,” which are shown
along with our strategic objectives in the table below.

                            Table 1: 2017‐2020 Strategic Objectives
 Perspective (Public Health Priority)                       Strategic Objectives
1.0 R e c r u i t a n d R e t a i n a s k i l l e d     Ensure competitive advantage by becoming the
and diverse workforce                                   organization of choice for patients and employees

                                                        Develop industry recognition of Core Public Health
2.0 M a r k e t i n g
                                                        Services

                                                        Develop a system of care that addresses the needs
3.0 Growth and Expansion                                of the community

                                                        Promote a culture of outreach and community
                                                        engagement.
4.0 Community Engagement

Osceola County’s vision statement for health was created through the work of the Osceola
Health Leadership Council and the Osceola Health Summit participants:

 “Osceola County will be a community where uninsured and underinsured
     residents have full access to the health care services they need.”

                                                2017‐2020 Community Health Improvement Plan       3
INTRODUCTION TO THE COMMUNITY HEALTH IMPROVEMENT PLAN ‐ CONTINUED
Targets and measures outlined in this CHIP are aligned with the national Healthy People 2020
goals and objectives. This national initiative, produced by the U.S. Department of Health &
Human Services, provides science‐based benchmarks that our community can track and
monitor. The Healthy People 2020 initiative also provides evidence‐based interventions and
information to guide health promotion and disease prevention efforts that can help improve
the health of our community.

NEXT STEPS
During the next three years, members of the Osceola Health Leadership Council (HLC) and key
stakeholders will continue to work together to find creative and effective ways to address
Osceola County’s community health priorities and strategic objectives. Work has already begun
to address these objectives.

THE REVIEW PROCESS
This CHIP is an active document that will be
reviewed and adjusted regularly to most
effectively address our community’s health
improvement. The CHIP’s Community Balanced
Scorecard will serve as the tool for measuring
progress against targets, which the HLC will
review quarterly. There will be an annual review
and evaluation scheduled in June of each year.
This will include documentation of performance
measures and description of progress. The CHIP
will be revised annually as indicated based on
evaluation results.

IN SUMMARY
Improving the health of our community is a shared responsibility. This effort takes not only
health care providers and public health officials; it also takes a variety of others helping to
contribute to the well‐being of our residents and visitors.

It is important to recognize that no single organization has the depth or resources needed to
raise our community’s health to a level of sustained excellence without the strong partnerships
such as with the Osceola Health Leadership Council and key stakeholders. It is our goal to
successfully leverage resources to address broad community health concerns, to have the
greatest impact on improving health outcomes.

All our community partners and others who are interested in helping make Osceola County a
healthier community are invited to review this CHIP, find an area or topic of interest, and ask:

           “How can I help?”
                                        2017‐2020 Community Health Improvement Plan     4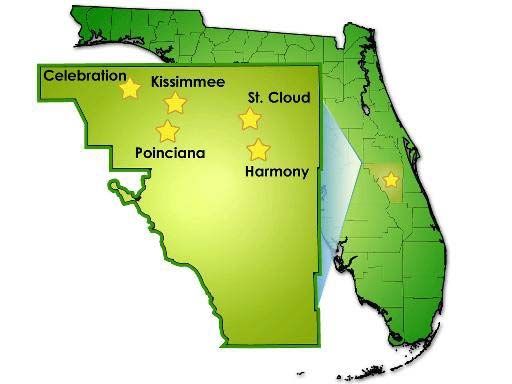
Osceola County – Community Profile – At‐a‐Glance
_________________________________________________________________________________________________________

                              Osceola County is a 1,506‐square mile area that serves as the
                              south/central boundary of the Central Florida greater metropolitan area.
                              It is the sixth largest county in land mass in the state of Florida. While
                              Osceola County is home to an estimated 323, 9 93 in 2015 3, it hosts over
                              six million overnight visitors each year, with over 100,000 visitors staying
                              in the county on any given night. This large number of visitors has the
                              potential to greatly impact the local public health system in times of an
                              emergency.

While much of the county is a vast, sparsely
populated rural expanse, much of the
population is in the urban/suburban areas in
the northwest quadrant of the county which
includes Kissimmee, founded in 1883 (with
Poinciana and Celebration in its municipality)
and St. Cloud founded in 1909.

Osceola County experienced a 5 6 % growth in
population from 2000‐2014. Osceola is
Florida’s 19 t h most populated county.
With 1.6% of the population.

The following section provides a brief, “At‐a‐Glance” overview of Osceola County facts. More
detailed information is provided in the CHIP’s companion document, the 2016 Community
Health Assessment.
Table 2: Race & Ethnicity Characteristics – 2010                                Within Osceola County
                              US        Florida                 Osceola   Kissimmee Poinciana St. Cloud
   White (non‐Hispanic)      63.4%         57.5%                  39.6%        26.2%      22.6%       62.1%
Black / African American     13.1%         16.5%                  12.8%        12.4%      24.5%        5.8%
                   Asian       5.0%         2.6%                   3.0%         3.4%       0.4%        1.7%
       Hispanic Ethnicity    16.7%         22.9%                  46.3%        58.9%      51.2%       29.2%
Data Source: US Census Bureau, 2010

Osceola County has a greater Hispanic population subset as compared to the state and nation.
Within Osceola County, both Kissimmee and Poinciana’s majority population is of Hispanic
ethnicity. Osceola County’s Black/African American population is lower than both the state and
nation. However, when combined, the Hispanic and Black/African American population
represents the majority population for both Kissimmee and Poinciana (71% and 76%
respectively). This is of importance in this Community Health Improvement Plan in that these
are population subsets considered to be at risk for suffering greater health disparities.
3
    https://datausa‐io/profile/geo/osceola‐county‐fl/
4
    US Census Bureau, 2010

                                                        2017‐2020 Community Health Improvement Plan   5
OSCEOLA COUNTY – COMMUNITY PROFILE ‐ CONTINUED
_________________________________________________________________________________________________________
Primary socio‐economic factors that have the potential to affect health are presented in the
three tables below.
Table 3: Socio‐Economic Snapshot – 2015
Osceola Florida US
Per capita income $29,911 $44,487 $55,775
Mean (average) household income $56,647 $67,975 $75,558
Median household income $44,254 $47,507 $53,889
Persons living below poverty 16.2% 16.5% 15.5%
Persons > 25 yrs. with high school diploma 34.3% 29.5% 28%
College graduates (Bachelor’s or higher) 18.0% 27.3% 29.7%
Mean (average) travel time to work in minutes 30.9 26.4 25.2
Data Source: 2011‐2015 American Community Survey Estimated https://factfinder.census.gov
Individuals in poverty are at greater risk of not having health insurance, not being able to pay
for medical care, and not being able to afford healthy food, safe housing, or access to other
basic goods.
Table 4: Percentage of Families & People Whose Income in Past 12
Months is Below Poverty Level
All families w/ Families w/ female
All people > 65
All families children < 5 yrs. head of household All people
yrs. of age
of age (no husband present)
Osceola County 10.7% 13.6% 23.7 19.5% 9.9%
Florida 12.0% 19.0% 29.0 16.5% 6.2%
United States 10.1% 17.1% 30.6 15.5% 5.3%
Data Source:2011‐2015 American Community Survey Estimated https://factfinder.census.gov
As documented in the national 2016 County Health Rankings report, the magnitude of
education’s effect on health outcomes is substantive and statistically significant. An individual’s
educational attainment has a strong correlation with their future health status.
Table 5: Educational Attainment
Percent of Population 25 Years & Older
Graduate or
High Some college, Associate’s Bachelor’s professional
School no degree degree degree degree
Osceola County 34.3% 23.4% 9.6% 12.7 5.3
Metro Statistical Area* 24.8% 19.6% 10.8 22.8 11.5%
Florida 29.5% 20.7% 9.4% 17.5% 9.8
United States 27.8% 21.1% 8.1% 18.5% 11.2%
Data Source:2011‐2015 American Community Survey Estimated https://factfinder.census.gov
Orlando, Florida
2017‐2020 Community Health Improvement Plan 6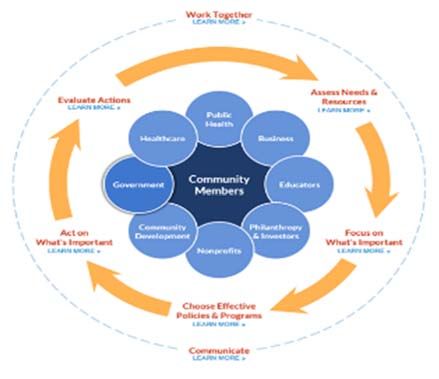
Building Community Capacity by Utilizing the SEM Model
  _________________________________________________________________________________________________________

  Community capacity building improves the ability of individuals, organizations, businesses, and
  government to come together; learn; make well‐reasoned decisions about the community’s
  present and future, and work together to carry out those decisions.5 Communities that have
  the ways and means to undertake challenges...have “capacity.”

  Osceola County is a community that has that “capacity” and has had a successful track record
  of turning plans into results. Regardless of past successes, it is important to continue to assess
  and build upon community capacity. Osceola County’s capacity was re‐assessed in the 2016
  Community Health Needs Assessment (CHNA) process that included the Social‐Ecological Model
  of Health (SEM) from the Centers for Disease Control and Prevention (CDC). SEM is a public health
  framework used to holistically describe four social levels of influence that explain the complex
  interaction between individuals and the social context in which they live and work. These
  assessments yielded important information for improving the local public health system and
  community health. As a review, SEM is described below:

       1. Individual. Influences: Attitudes and beliefs that support unhealthy behaviors.
       2. Relationships. Influences: Association with friends, family, co‐workers and social
          networks.
       3. Community. Influences: Social norms as well as the interactions and relationships
          among organizations.
       4. Societal. Influences: Health, Economic, Educational and Societal policies.

The Community Health Needs Assessment (CHNA) report serves as the foundation for improving
health, wellness and the quality of life in Osceola County. By utilizing SEM in the CHNA, the
likelihood of developing sustainable interventions with the broadest impact on health and wellness
is increased. With this model a specific health problem can be closely examined in a specific context
or setting.
The SEM helps identify factors that influence behavior by considering the complex interplay among
individual, interpersonal, community and public policy factors. It shows how the changes and
interactions between these four levels over the course of one’s lice greatly affect health and
wellness.

                                             2017‐2020 Community Health Improvement Plan           7
_________________________________________________________________________________________________________
Built Environment
Population with park access, the north central portion of Kissimmee, small patch of
population with access, a good portion has no access.
Recreation and Fitness Facilities, are within the northeastern portion of the county and
become sparse in other portions
Food Deserts, a handful of food desert area in the same areas as those tracts with high
proportions of Supplemental Nutrition Assistance Program (SNAP) recipients.
Modified Retail Food Environment (MRFE), low access, poor access or no access to
healthy retail food outlets. Score is below 15 for MRFE.
Family Households receiving SNAP, 80, 919 per Osceola Council on Aging report in 2015
Homelessness, 1600 families are homeless, with over 5, 000 homeless children per Osceola
Council on Aging report in 2015
Food insecurity, 42, 00 residents report food insecurities per Osceola Council on Aging
report in 2015
Low income population living near a Farmer’s Market, most resident living in Kissimmee
have access to a Farmer’s Market.
Fruit and Vegetables Expenditure, fall into the fourth and fifth quintiles (low end).
Insurance Issues Perspective
More than 20% of Osceola residents were uninsured in 2015. Ages 18-34- 26%, ages 35-
44-18%, ages 45-54- 18% and ages 55-64- 15%.
Hispanic residents were least likely to be insured
Non-Hispanic whites have the highest insured rates
Top Five Causes of Death
Heart Disease
Cancer
Unintentional Injury
Chronic Lower Respiratory Disease
Cerebrovascular Disease
*Diabetes has a high rate of death within the Black population
Key findings from data from the Community Conversations, Consumer Surveys and
Stakeholder Interviews conducted for the CHNA:
Need for/Access to mental health services
Affordability of healthcare
Homelessness
Affordable housing
Food Insecurity‐access to quality/nutritious foods
Poverty
Low wages
Substance abuse
2017‐2020 Community Health Improvement Plan 8_________________________________________________________________________________________________________
Transportation
Lack of family support
Water quality
Inactivity
Need more/better bike‐and pedestrian friendly infrastructure
Chronic conditions of concern: diabetes and obesity – low levels of preventative
care/screenings
Maternal and child health
STI/HIV
Inappropriate use of the Emergency room
ISSUES, PERCEPTIONS, AND ASSETS
In addition to surveying the community at large for the CHNA, the next approach was to gather
input from a wide sector of the local public health system. Over 65 participants from a wide
variety of healthcare, government, community agencies, faith‐based, grass‐roots, business,
citizens, and other partners came together at the Osceola Summit on Health – 2017.
Facilitated by the Florida Department of Health in Osceola and Community Vision, attendees at the
Summit participated in Breakout Work Sessions that gathered input and shared creative ideas for
strategic solutions to the issues arising from the four following topics:
1. Cultural Impacts on Health
2. Healthy Babies/Fetal Infant Mortality
3. “Transporting” Health
4. The Cycle of Poverty
2017‐2020 Community Health Improvement Plan 9_________________________________________________________________________________________________________
ISSUES, PERCEPTIONS, AND ASSETS – THEMES THAT EMERGED
Building upon the work from the Osceola Summit on Health 2017, where Community Vision
took advantage of printed invitations, flyers and social media to bring health partners
and other community members together to review the social determinants of health and
discuss their impact on our community’s health outcomes. The intent was to identify
forces that affect the context in which Osceola County’s public health system operates.
The top four social determinants identified that would determine success on long‐ range
goals to support the Osceola County’s vision were:
1. Cultural
2. Economic
3. Transportation Access
4. Infant Mortality
These issues are factored into the development of the Community Balanced Scorecard.
SUMMARY OF COMMUNITY HEALTH STATUS ‐ AT‐A‐GLANCE
(NOTE: The Community Health Status data presented in this section provide a brief overview
for the CHIP. More detailed Community Health Status information is presented in CHIP’s
companion document, the 2016 Community Health Assessment report).
Mortality rates are key indicators of a community’s “State of Health.” Some deaths are
considered premature and preventable through behavior modification and risk reduction. This
concept particularly applies to those deaths attributable to heart disease, stroke, diabetes,
some cancers, and motor vehicle accidents. Individuals may reduce their risk and improve the
length and quality of their lives by leading healthier lifestyles and receiving preventive health
care services.
The figure below summarizes age‐adjusted rates for the leading causes of death in Osceola
County in 2015. Heart disease, 27.6%, was the leading cause of all deaths, with cancer, 21.9%,
as the second leading cause. When heart disease is combined with stroke, these cardiovascular
diseases were responsible for 30% of all deaths in Osceola County. Chronic Lower Respiratory
Disease (including emphysema, chronic bronchitis, and asthma), 5.3%, and diabetes, 2.1%, are
the other chronic diseases responsible for leading causes of death.
2017‐2020 Community Health Improvement Plan 10_________________________________________________________________________________________________________
Leading Causes of Death Osceola County ‐2016
Influenza and Pneumonia 1.8
Septecmia 1.9
Diabetes 2.1
Alzeheimer's Disease 2.4
Nephritis, Nephrotic syndrome 2.8
Unintentional Injuries 5.2
Stroke 5.3
Chronic Lower Respiratory Disease 5.3
Cancer 21.9
Heart Disease 27.6
0 5 10 15 20 25 30
Figure 2: Leading Causes of
Death: Florida Charts 2016
2017‐2020 Community Health Improvement Plan 11_________________________________________________________________________________________________________
THE NATIONAL COUNTY HEALTH RANKINGS REPORT
The national County Health Rankings report is produced
by the Robert Wood Johnson Foundation in collaboration
with the University of Wisconsin Population Health
Institute. The County Health Rankings shows that where
we live, learn, work, and play...matters to our health
and that much of what influences our health happens
outside the doctor’s office – from access to healthy food
or opportunities for physical activity to education and
jobs.
The County Health Rankings allow counties to compare themselves with others within their
state and compare to national benchmarks. Counties can see where they are doing well and
where they are not, so they can make changes to improve health. The report was one of the
tools used to help Osceola Health Leadership Council and the health collaborative partnership
focus on areas where public health needs were identified.
http://www.countyhealthrankings.org/
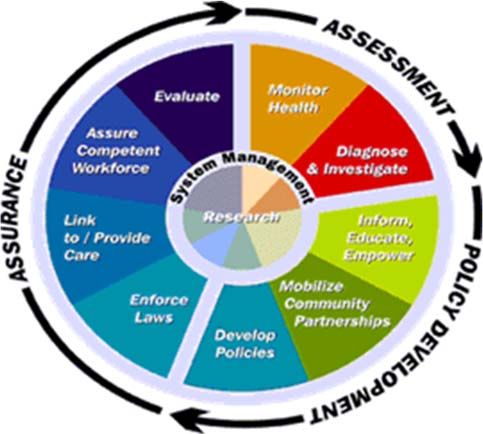
The County Health Rankings provide two overall measurement categories to help determine how
healthy a community is:
1. Health Outcomes: “Today’s health”
(green boxes) represents how healthy a
county is‐‐how long people live (mortality)
and how healthy people feel (morbidity). In
2016, Osceola County ranked 30th out of
Florida’s 67 counties.
2. Health Factors: “Tomorrow’s health” (blue
boxes) are the factors that shape a
community’s health outcomes, including
health behaviors; clinical care; social and
economic factors; and the physical
environment. These factors are based on
several measures, some of which the Osceola
Health Leadership Council has addressed
(those in the following bold font) in this
CHIP—tobacco use; diet and exercise;
alcohol use; access to care; quality of care;
family and social support; and the built
environment.
2017‐2020 Community Health Improvement Plan 12_________________________________________________________________________________________________________
OSCEOLA’S COUNTY HEALTH RANKINGS REPORT
Osceola County’s three‐year overall rankings, out of Florida’s 67 counties, are presented below:
Table 6: Osceola County Health Rankings by Category
2015 Ranking 2016 Ranking 2017 Ranking
3‐Year
Category out of 67 out of 67 out of 67
Trend*
Counties Counties Counties
Health Outcomes
(Mortality and Morbidity)
14th 32nd 30th
Health Factors
(Health behavior; Clinical access;
Socio‐economic; Environment)
45th 40th 34th
Data Source: 2017 County Health Rankings
*About 3‐Year Trend:
Green upward arrow indicates positive (improving) 3‐year trend.
Red downward arrow indicates negative (worsening) 3‐year trend.
Table 7 shows Osceola County results segmented for the Health Outcomes category:
Table 7: Osceola County Health Rankings ‐ Snapshot of Health Outcomes
Health Outcome Category Osceola Osceola Trend Florida Benchmark
Osceola County Rank = 30th of 76 2017* (2015‐2017) 2017 2017**
Counties
Mortality Indicator
Premature Death
"Years of potential life lost before
6,000 6,700 5,200
age 75 per 100,000 population"
Morbidity Indicators
Poor or Fair Health
"Percent of adults reporting fair or
23% 17% 12%
poor health (age‐adjusted)"
Poor Physical Health Days
"Average number of physically
unhealthy days reported in past 30 4.6 4.2 3
days (age‐adjusted)"
Poor Mental Health Days
"Average number of mentally
unhealthy days reported in past 30 4.3 4.2 3
days (age‐adjusted)"
Low Birth Weight
"Percent live births with low birth
8% 9% 6%
weight (_________________________________________________________________________________________________________
**About the National Benchmark:
Set at the 90th percentile. Only 10% of counties nationwide are better than the measure.
The arrows indicate the direction Osceola County needs to go to achieve improvement in the
health outcome indicator in comparison with National Benchmark.
OSCEOLA’S COUNTY HEALTH RANKINGS REPORT ‐ CONTINUED
Table 8 shows Osceola County results segmented for the Health Factors category:
*About Osceola 2017 rate:
Green highlight indicates Osceola compares favorably (or better) than the Florida rate.
Red highlight indicates Osceola compares unfavorably (or worse) than the Florida rate.
**About the National Benchmark:
Set at the 90th percentile. Only 10% of counties nationwide are better than the measure.
The arrows indicate the direction Osceola County needs to go to achieve improvement in the
health outcome indicator in comparison with National Benchmark.
2017‐2020 Community Health Improvement Plan 14_________________________________________________________________________________________________________
OSCEOLA COUNTY CHRONIC DISEASES – AT‐A‐GLANCE
DIABETES PREVALENCE
In terms of potential health
disparity, the prevalence of
diabetes is higher in the Hispanic
populations than the White (Non‐
Hispanic and Black (Non‐
Hispanic).
Osceola’s diabetes rate is worse
than the state for Hispanic
population than White and Black
populations.
Figure 3: Diabetes Prevalence by Race & Ethnicity
Osceola County’s measure, i.e., rate of diabetes prevalence, is not the
same as the HP 2020 national health target measure, which is the annual
number of new cases of diagnosed diabetes. It is interesting to note that
the HP 2020 target is to reduce the annual number of new cases of
diagnosed diabetes from 8.0 to 7.2 per 1,000 population.
OBESITY
Osceola’s obesity prevalence is
slightly better for the Hispanic and
Black populations than the White.
Osceola’s rate for each population
subset is about the same or slightly
worse than the state averages.
Figure 4: Obesity Prevalence by Race & Ethnicity
The HP 2020 national health target is to reduce the proportion of adults
who are obese to 30.6%. While Osceola County’s Hispanic and Black
populations are b e l o w t he HP 2020 target, the White population of 32.5
% is slightly worse.
2017‐2020 Community Health Improvement Plan 15_________________________________________________________________________________________________________
OSCEOLA COUNTY CHRONIC DISEASES – AT‐A‐GLANCE
CARDIOVASCULAR
Osceola’s cardiovascular disease
prevalence rate is slightly better in
the Hispanic and Black populations
than the White.
Osceola’s rate for each population
subset is better than the state
averages.
Figure 5: Cardiovascular Prevalence by Race & Ethnicity
One of the HP 2020 national health targets hypertension. This target is 26.9%.
Currently 29.9% of adults aged 18 years had high blood pressure.
Osceola’s rate of hypertension has
improved greatly in the Black
population; the rate remains
about the same for the Hispanic
and White populations.
Although Osceola’s rate is close to
the state average for the Hispanic
population, the rate is slightly
better than the state Black and
White average.
2017‐2020 Community Health Improvement Plan 16_________________________________________________________________________________________________________
The HP 2020 national health target is to reduce the proportion of adults
18 years and older with hypertension to 26.9%. Osceola County’s rate for
all population subsets is slightly below the HP 2020 target at 28.2%.
OSCEOLA COUNTY CHRONIC DISEASES – AT‐A‐GLANCE
STROKE
Osceola’s incidence of stroke is
worse in the White population when
compared to the Hispanic and Black.
Osceola’s rate for each population
subset is better than the state
averages.
Of note, Osceola’s Hispanic and
Black rate is significantly better
than the state average for White
population.
Figure 7: Stroke by Race & Ethnicity
PHYSICAL ACTIVITY
Osceola’s rate of adults getting
enough physical activity is better in
Hispanic and Black populations in all
population subsets when compared to
the state averages.
The White populations show a slightly
higher percentage of physical activity
compared to the White population state
average.
Figure 8: Moderate Physical Activity Recommendations
2017‐2020 Community Health Improvement Plan 17_________________________________________________________________________________________________________
The HP 2020 national health target is to increase the proportion of adults
who engage in aerobic physical activity of at least moderate intensity to
47.9%. Moderate intensity is defined as at least 150 minutes/week, or
75 minutes/week of vigorous intensity, or an equivalent combination. Osceola County’s rate for
all population subsets is worse than the HP 2020 goal, particularly in the Hispanic and Black
populations.
Note: About the data presented in the following sections for Preventable Hospital Stays and
Fetal/Infant Mortality:
*Peer Average, as determined by proximity to Osceola County with similar demographics.
www.flhealthcharts.com
PREVENTABLE HOSPITAL STAYS & INAPPROPRIATE ER UTILIZATION – AT‐A‐GLANCE
Figure 9: Preventable Hospital Stays
The priority areas identified in Osceola County’s CHNA included growing numbers of uninsured, lack of
primary care services, lack of chronic care services, and inappropriate emergency room (ER) utilization.
CHNA’s findings are clearly validated by the data on primary care provider shortages and preventable
hospital stays. Between 2012 and 2015 the 578 uninsured visits to Florida Hospital Kissimmee cost nearly
$2 million and accounted for 1% of all visits per the CHNA.
Top five primary diagnoses and costs were:
Fever and other physiologic disturbances of temperature regulation - cost $2, 382 per visit
Headache - cost $3, 829 per visit
Urinary Tract infection – cost $2, 676 per visit
Chest Pain - $11, 082 per visit
Abdominal pain - $5, 940 per visit
2017‐2020 Community Health Improvement Plan 18_________________________________________________________________________________________________________
Age distribution of visits:
0-18 = 8%
19-29 = 30%
30-39 = 28%
40-49 = 18%
50-59 = 13%
60-69 = 3 %
70-79 = 1%
80+ = 0%
FETAL AND INFANT MORTALITY – AT‐A‐GLANCE
Improving the well‐being of mothers, infants, and children is an important public health goal
that has a tremendous impact on the current and future health of a community. A community
can help reduce the risk of maternal and infant mortality and pregnancy‐related complications
by increasing access to quality health care before and between pregnancies. Healthy birth
outcomes and early identification and treatment of health conditions among infants can prevent
death or disability and enable children to reach their full potential.
Fetal mortality is defined as
death occurring > 20 weeks’
gestation until the absence of
life at delivery.
Osceola’s trend has
decreased (improved) slightly
over the three measurement
periods. It has remained about
the same as the state averages.
And better than the peer
county.
2017‐2020 Community Health Improvement Plan 19_________________________________________________________________________________________________________
The HP 2020 target is to reduce fetal deaths to 5.6 per 1,000 live births.
Osceola’s rate is higher (worse) than the HP 2020 goal.
Neonatal mortality is
defined as death from the time
of birth through the first 28
completed days of life.
Osceola’s neonatal death
rate trend has improved over
the three measurement periods
and has improved more than the
regional and county peer
averages and the state average.
The HP 2020 national health target is to reduce
the neonatal death rate to 4.1 deaths per 1,000 live births. Osceola’s 2013‐
2015 rate of 3.3 is better than the HP 2020 target.
2017‐2020 Community Health Improvement Plan 20_________________________________________________________________________________________________________
FETAL AND INFANT MORTALITY – AT‐A‐GLANCE
Infant mortality is defined
as death from the time of birth
through the first year of life.
Osceola’s infant death rate
trend has improved slightly
over the three measurement
periods; it has remained lower
(better) than the regional peer
average and the state average.
The HP 2020 national health target is to reduce the infant death rate to 6.0
deaths per 1,000 live births. Osceola County’s 2009‐2011 rate of 6.3 is
slightly worse than the HP 2020 target.
Osceola’s premature birth
rate is close to the state
averages and slightly better
than the peer county average.
Osceola’s rate has remained
level over the three
measurement periods.
The HP 2020 national health target is to reduce the preterm births to
11.4%. Osceola County’s rate of 9.3% is better than the HP 2020 target.
2017‐2020 Community Health Improvement Plan 21Overview of the Osceola County Community Health Improvement Plan
_________________________________________________________________________________________________________
Osceola County’s 2017‐2020 Community Health Improvement Plan (CHIP) has been developed
through a collaborative effort involving a multitude of community stakeholders and key
partners. Community Health Priorities, also called “Perspectives,” are listed in this CHIP along
with specific goals. It is important to note that this CHIP does not address every strength and
weakness identified in the 2016 Community Health Assessment (the companion document to
this CHIP). It does, however, set a strategic path to follow for Osceola County’s key health
priorities.
APPROACH TO IDENTIFYING STRATEGIC ISSUES
Based on the results of the O sceola Summit on Health in 2017 and the S E M ‐ C H N A , including
an analysis of health statistical data and community feedback, the collaborative partnership,
under the umbrella of the Osceola Health Leadership Council, drafted a list of strategic priorities.
The selection process was based on:
Whether the health status statistical data were trending up or down and comparison
with State, Regional, and Peer County averages, and the National average. The
Healthy People 2020 goals also were considered.
Consideration was given to the fact that Osceola’s population segments considered
at greater risk for health disparities, Black / African American and Hispanic,
represent the majority population.
Community perception of health and related socio‐economic issues in Osceola
County.
Given our available resources and capacity within Osceola’s public health system,
what improvement opportunities have the potential to have the greatest impact
during the next three years?
The following criteria also were used to assist in the determination of the most
important strategic objectives:
1. Must move toward addressing a strategic issue.
2. Must be realistic.
3. Should be attainable in 1‐3 years
4. Must be measurable.
2017‐2020 Community Health Improvement Plan 22OVERVIEW OF THE OSCEOLA COUNTY COMMUNITY HEALTH IMPROVEMENT PLAN (CHIP) ‐ CONTINUED
_________________________________________________________________________________________________________
The drafted strategic priorities from the 2017 Community Health Assessment were presented for
review and vetting during our latest Community Gathering at the 2017 Osceola Business of Health
Summit. This latest in the series was organized and facilitated by Community Vision, Inc.
under the umbrella of the Osceola Health Leadership Council.
The Summit was held May 5, 2017 at the Osceola Council on Aging Center. There were
approximately 90 representatives from health care (local public health, hospitals, and health
providers); businesses; service organizations; Osceola County government and elected officials;
faith‐based; university system; Osceola County School District; Kissimmee and St. Cloud Chambers
of Commerce; and citizens of Osceola County.
The Summit included an overview of the State of Osceola’s Economic, Physical, and Mental
Health. Attendees then participated in smaller, interactive breakout sessions that included:
1. “Coming to America” Cultural Impacts on Health
2. Healthy Babies/Fetal Infant Mortality
3. “Transporting” Health – How Transportation Impacts Access & Delivery
4. Project OPEN – Breaking the Cycle of Poverty
2017‐2020 Community Health Improvement Plan 23OVERVIEW OF THE OSCEOLA COUNTY COMMUNITY HEALTH IMPROVEMENT PLAN (CHIP) ‐ CONTINUED
_________________________________________________________________________________________________________
Strategies that emerged from the breakout sessions served to affirm and further support the
work done in the prior Summits, the 2016 Community Health Assessment, and the Community
Balanced Scorecard.
Formulating Goals & Strategies.
Strategy suggestions included:
1. Employee surveys to ensure employee engagement in the workplace.
2. Community surveys to assess the needs.
3. Engagement with community partners to ensure needs of community is being met.
4. Developing a marketing plan that involves community partners
The Strategic Objectives from the Public Health Priorities and the rational for including each are
discussed in Table 9: 2017‐2020 Strategic Objectives for Osceola County (on the following
pages).
.
2017‐2020 Community Health Improvement Plan 24OVERVIEW OF THE OSCEOLA COUNTY COMMUNITY HEALTH IMPROVEMENT PLAN (CHIP) ‐ CONTINUED
_________________________________________________________________________________________________________
Table 9: 2017‐2020
Strategic Objectives for Osceola County
Public Health Priorities
‐Strategic Objectives‐ Rationale
A skilled and diverse workforce enable us to bring the
Ensure Competitive
best care to the community through excellence of
advantage by becoming the
service
organization of choice for
patients and employees
As the dynamics of healthcare changes and evolves, FDOH
Osceola can educate the community about core Public
Develop Industry
Health services.
recognition of Core Public
Health Services
As a community partner, FDOH Osceola can be a leader in
Develop a system of care that developing and expanding core Public Health Services in
addresses the needs of the Osceola County.
community
Engaging the community in self‐awareness and what
Promote a culture of outreach and they can do to improve their health and the health of
community engagement those around them will ensure a community is on the
way to being healthier to allow us to become the
healthiest state in the US.
2017‐2020 Community Health Improvement Plan 25OVERVIEW OF THE OSCEOLA COUNTY COMMUNITY HEALTH IMPROVEMENT PLAN (CHIP) ‐ CONTINUED
_________________________________________________________________________________________________________
Alignment with the 10 Essential Pubic Health Services:
Osceola’s priorities, goals, targets, and measures outlined in this CHIP are aligned with Public
Health 10 Essential Services. The national Healthy People 2020 goals and objectives were used
wherever applicable. These are the best available evidence‐based knowledge and are
applicable at the national, state, and local levels. Healthy People has established benchmarks
and monitored progress over time to empower individuals toward making informed health
decisions, measure the impact of prevention activities, and identify health improvement
priorities.
As with Healthy People 2020, the overarching goal of utilizing evidence‐based goals and
strategies is to ensure that Osceola County sustains its journey toward:
Promoting quality of life, healthy development, and healthy behaviors across all life
cycles.
Achieving health equity, eliminating disparities, and improving the health of all groups.
Creating social and physical environments that promote good health for all.
Supporting programs or policies recommended in both the national health plans and
Florida’s State Health Improvement Plan.
ACTION CYCLE: PLAN, IMPLEMENT, EVALUATE
Participants plan for action, implement, and evaluate. This continuous and interactive process
ensures the success of the CHIP activities. This phase is a three‐year cycle that will end with the
completion of the next Community Health Assessment done in 2019, at which point the next
three‐year cycle will begin.
HOW IMPLEMENTATION PROGRESS WILL BE MONITORED
Goal Assignment:
The success of each goal is based on outcome measurements that track progress and project
impact. Each goal has an assigned owner and, for some, a task force and/or additional work
groups who are or will be working together to develop coordinated Action and Evaluation
plans. Progress will be monitored by each owner as well as by the Health Leadership Council.
Evaluation:
Evaluation will remain important throughout the remainder of the three‐year cycle so that
progress toward our CHIP goals is both meaningful and measurable. Continual progress
updates will regularly occur and will be based on feedback to the Health Leadership Council.
Lessons learned from what actions were taken will help guide further actions. An annual
evaluation scheduled for June of each year will help to inform key decision makers to decide
whether the right strategies were implemented, as well as whether the desired outcomes are
being achieved.
2017‐2020 Community Health Improvement Plan 26OVERVIEW OF THE OSCEOLA COUNTY COMMUNITY HEALTH IMPROVEMENT PLAN (CHIP) ‐ CONTINUED
_________________________________________________________________________________________________________
It is important to remember that while this CHIP is a three‐year document, it is an active
document that will be re‐evaluated and revised on a routine basis to ensure Osceola County’s
public health system stays current with community needs and to ensure the mission:
gÉ ÑÜÉàxvà? ÑÜÉÅÉàx 9 |ÅÑÜÉäx à{x {xtÄà{ Éy tÄÄ ÑxÉÑÄx |Ç
YÄÉÜ|wt à{ÜÉâz{ |ÇàxzÜtàxw áàtàx? vÉâÇàç 9 vÉÅÅâÇ|àç xyyÉÜàá.
2017‐2020 Community Health Improvement Plan 27How to Use This Community Health Improvement Plan
_________________________________________________________________________________________________________
Each of us can play an important role in the improvement of Osceola’s community health, whether
in our homes, schools, workplaces, faith based, or other places. Encouraging and supporting
healthy behaviors is more effective than altering
unhealthy habits. Below are some simple ways to
use this Community Health Improvement Plan to
help improve where Osceola County citizens live,
learn, work, and play.
Source: Action Cycle; www.County HealthRankings.org
Employers education, and other preventive services in
Understand priority health issues within the alignment with identified health needs of the
community and use this CHIP and Osceola community.
recommended resources to help make your
business a healthy place to work. Educators
Educate your staff about the link between Understand priority health issues within the
employee health and productivity. community and use this CHIP and
recommended resources to integrate topics of
Community Residents h e a l t h and health factors into lesson plans
Understand priority health issues within the across all subject areas such as math,
community and use this CHIP to help science, social studies, and history.
improve the health of your community. Create a healthier school environment by
Use information from this CHIP to start a aligning this CHIP with school wellness
conversation with community leaders about plans/policies. Engage the support of
health issues important to you. leadership, teachers, parents, and students.
Get involved by volunteering your time or
expertise for an event or activity, or Government Officials
financially help support initiatives related to Understand priority health issues within the
health topics discussed in this CHIP. community.
Identify the barriers to good health in your
Health Care Professionals communities and mobilize community leaders
Understand priority health issues within the to take action by investing in programs
community and use this CHIP to remove and policy changes that help members of our
barriers and create solutions for identified community lead healthier lives.
health priorities.
Share information from this CHIP with your
colleagues, staff, and patients.
Offer your time and expertise to local
improvement efforts.
Offer your patients relevant counseling,
2017‐2020 Community Health Improvement Plan 28How to Use This Community Health Improvement Plan
_________________________________________________________________________________________________________
State and Local Public Health Professionals
Understand priority health issues within
the community and use this CHIP to
improve the health of this community.
Understand how the Osceola County
community compares with Peer Counties,
Regional Peers, Florida, and the national
population.
Faith‐based Organizations
Understand priority health issues
within the community and talk with
members about the importance of
overall wellness (mind, body, and
spirit) and local community health
improvement initiatives that support
wellness.
Identify opportunities that your
organization or individual members
may be able to support and encourage
participation.
2017‐2020 Community Health Improvement Plan 29APPENDIX A:
Osceola County Health Leadership Council
Membership Roster
2017
First Last Agency
Lisa Barkley MD UCF College of Medicine
Brent Burish St. Cloud Regional Medical Center
Bakari Burns Healthcare for the Homeless
Mike Capranice Osceola County EMS & Fire Rescue
Chris Falkowski The Transition House
Wes Fischer The Health Insurance Store
Sharon Dillard Poinciana Medical Center
Beverly Hougland Osceola County Council on Aging
Warren Hougland Osceola Council on Aging
Belinda Johnson-Cornett Primary Care Medical Services of Poinciana, Inc.
Amanda Kraft Osceola County District Schools
Bryan Lee Osceola Regional Medical Center
Nurez Madhany American Cancer Society
Celestia McCloud Osceola County Human Services
Patty McWhirter Healthy Start of Osceola
Grisel Negron UF/IFAS Osceola Co Extension
Ken Peach Health Council East Central Florida
Debra Perleberg The Health Insurance Store
Vilma Quintana Florida Blue
Deborah Randall Deborah Randall Consulting
JoEllen Revell Victim Services Center
Sue Ring Community Vision
Jim Shanks Park Place Behavioral Health Care
Donna Sines Community Vision
Bret Smith FDOH-Osceola
Margie Sweeney Osceola Council on Aging
Wendy Roman Humana
Bernardo Gil Family Physician Group
Jill Slaff Florida Hospital
Jennifer Stephenson Catholic Charities of Central Florida
Jordan Williams Florida Hospital Kissimmee
2017‐2020 Community Health Improvement Plan 30Appendix B: Osceola County Community Balanced Scorecard
F l o r id a D ep ar t ment o f Healt h i n O sceo l a C o unt y
O ver all Q 14 O ver all Q 15 O ver all Over al l O ver all O ver all Over al l Q 16 O ver al l O ver al l O ver al l Over al l
C li ni cal Per f o r mance D at a 2 0 16 2 0 17 2020
A ver ag e A ver ag e A ver ag e
Heal t hy Pr o p o se
I nd ex So ur ce Peo p l e 2 0 2 0 1st Q 16 2 nd Q 16 3 r d Q 16 4 t h Q 16 T ar g et 1st Q17 2 nd Q 17 3 r d Q 17 4 t h Q 17 T ar g et d T ar g et
A . C A N C ER
A 1. Pap Smear s
%of women 21-64 years of age who received
A1a. one or more Pap test s during t he measurement QI Review > 93% 83% 75% 80% 8 1% 70 % 68% 75% > 93% 51% > 93% > 93%
year or prior 2 years.
B . C HI LD HEA LT H
B 1. Immuni z at i o ns R at es f o r chil d r en
%of children who have received aged
B1a. appropriat e vaccines on or bef ore t heir 2nd FL SHOTS > 80% 92% 88% 84% 84% 8 7% > 9 5% 9 7% > 9 5% > 9 5%
birt hday during measurement year.
%of children who have received aged
B1b. appropriat e vaccines on or bef ore t heir 3rd FL SHOTS 93% 93% Dat a Changed 8 7% 84% 84% 8 5. 0 0 % > 9 5% 9 7.2 0 % > 9 5%
birt hday during measurement year
C . B EHA V IO R A L HEA LT H
C 1. D o mest i c V i o lence
%of f emales ages 18-64 (or any pat ient
younger seen in FP / Prenat al) screened for
C1a. QI Review > 9 5% 9 7% 98% 10 0 % 10 0 % 10 0 % 10 0 % 10 0 % > 98% 10 0 % > 98% 10 0 %
domestic violence during t he measurement
year.
C2. D ep r essio n Scr eeni ng
Pat ient s aged 12 or over who were (1) screened
for depression wit h a st andardized t ool and
C2. QI Review 57% 58 % 80% 75% 10 0 % 94% 8 7% > 75% 93% > 75% > 8 5%
had a f ollow-up plan document ed, if the
pat ient s were considered depressed.
D . B O D Y M A SS I N D EX ( B M I )
%of pat ient s adult patient s 18 years or older
D1. who had BM I calculat ed at last visit or wit hin QI Review 93% 10 0 % 10 0 % 10 0 % 90% 10 0 % 98% > 70 % 10 0 % > 70 % >90%
last 6 months.
If t hey are overweight or underweight, had a
D2. QI Review 94% 9 1% 90% 90% 92% 92% 9 1% > 70 % 90% > 70 % >90%
follow-up plan document ed.
E. T O B A C C O
%of pat ient s age 18 years & older who were
E1. screened re: tobacco use 1 or more times wit hin QI Review > 69% 10 0 % 10 0 % 10 0 % 10 0 % 10 0 % 89% 9 7% 10 0 % 10 0 % 10 0 % 10 0 %
24 mont hs (Assessment ).
%of pat ient s adult patient s 18 years or older
E2. who are users of tobacco & who were advised QI Review > 2 1% 77% 98% 10 0 % 10 0 % 10 0 % 10 0 % 10 0 % 10 0 % 10 0 % 10 0 % 10 0 %
to quit (Counseling / medication).
C o mp l i ance Leg end
M eet s T ar g et
R e: N ew measur es w er e ad d ed in 2 0 16 W it hin 5% t ar g et
C l ar i f i cat i o ns >5% b el o w t ar g et
1.
Appropriat e immunizat ions include: 4 DTP/ DTaP; 3 IPV; 1 M M R; 3 Hib; 3 HepB; 1
VZV (Varicella) & 4 Pneumococcal conjugat e,1 Hep A ; 2 o r 3 R o t avi r us; 2
inf luenz a( f l u) vacci nes p r i o r t o 2 nd b i r t hd ay.
2 . Percent of women 21-64 years of age who received1 or more Paps t est s. Universe 23-
64 years of age. D o no t i ncl ud e co ncur r ent HPV . eC Q M d o es no t
incl ud e 2 visit ever .
Prepared by: Qualit y M anagement R evised C l ini cal Sco r ecar d . 8 / 2 / 2 0 17
Status will be reviewed using a stoplight approach
2017‐2020 Community Health Improvement Plan 31Appendix C: Rationale & Resources to Support Community Health Improvement Action Plans
Rationale & Resources to Support the Community Health Improvement Action Plans ‐ 2017‐2020 Action Plan Cycle
Public Health Priorities & Alignment Strategic Objective Why is this important to our community Available Resources
A skilled and diverse workforce enable us to bring the best Florida Department of Health Human Resources
1.0 Recruit and Retain a skilled and diverse care to the community through excellence of service
1.1 Ensure competitive
workforce
advantage by becoming
Alignment with 10 Essential Public Health
the organization of choice
Services: #8 Assure competent public and
for citizens and staff
personal health care workforce
As the dynamics of healthcare changes and evolves, FDOH As an accredited and integrated State of Florida
Osceola can educate the community about core Public Health Public Health Department, FDOH‐Osceola can rely
2.0 Marketing 2.1 Develop industry services. on other Central Florida Counties (Orange, Lake,
Alignment with all 10 Essential Services of recognition for Core Seminole) as well as all Florida Departments of
Public Health Public Health Services Health to assist with expanding and developing
Public Health Programs.
As a community partner, FDOH Osceola can be a leader in
3.0 Growth and Expansion 3.1 Develop a system of developing and expanding core Public Health Services in Community Partners as listed in the Osceola
Alignment with 10 Essential Services of Public care that address the Osceola County. County Health Leadership Council Membership
Health: #1 Monitor Health status to identify needs of the community Roster (Appendix A)
and solve community health problems, #7 Link
people to needed personal health services
and assure the provision of health care when
otherwise unavailable.
______________________________________ ______________________ _________________________________________________ _________________________________________
Community Partners as listed in the Osceola
4.0 Community Engagement 4.1 Promote a Culture of Engaging the community in self‐awareness and what they can County Health Leadership Council Membership
Alignment with all 10 Essential Services of outreach and community do to improve their health and the health of those around Roster (Appendix A)
Public Health engagement them will ensure a community is on the way to being healthier
to allow us to become the healthiest state in the US.
2017‐2020 Community Health Improvement Plan 32You can also read