2020 in brief Australia's health - Australian Institute of Health and ...
←
→
Page content transcription
If your browser does not render page correctly, please read the page content below
Australian Institute of
                                     Health and Welfare
Australia’s health 2020: in brief
presents highlights from the
Australian Institute of Health
and Welfare’s 17th biennial

                                                               Australia’s
report on the nation’s health.

                                    Australia’s health 2020:
                                                               health 2020

                                            in brief
                                                                    in brief
Australia’s
health 2020
     in brief
The Australian Institute of Health and Welfare is a major national agency whose purpose is
       to create authoritative and accessible information and statistics that inform decisions
                        and improve the health and welfare of all Australians.

© Australian Institute of Health and Welfare 2020

This product, excluding the AIHW logo, Commonwealth Coat of Arms and any material owned by
a third party or protected by a trademark, has been released under a Creative Commons BY 3.0
(CC BY 3.0) licence. Excluded material owned by third parties may include, for example, design
and layout, images obtained under licence from third parties and signatures. We have made all
reasonable efforts to identify and label material owned by third parties.
You may distribute, remix and build upon this work. However, you must attribute the AIHW as
the copyright holder of the work in compliance with our attribution policy available at
www.aihw.gov.au/copyright/. The full terms and conditions of this licence are available at
http://creativecommons.org/licenses/by/3.0/au/.

This publication is part of the Australian Institute of Health and Welfare’s Australia’s health series.
A complete list of the Institute’s publications is available from the Institute’s website
www.aihw.gov.au.

ISSN 2651-9488

ISBN 978-1-76054-691-5 (Online)
ISBN 978-1-76054-692-2 (Print)

Suggested citation
Australian Institute of Health and Welfare 2020. Australia’s health 2020: in brief.
Australia’s health series no. 17 Cat. no. AUS 232. Canberra: AIHW.

Australian Institute of Health and Welfare
Board Chair		              Chief Executive Officer
Mrs Louise Markus          Mr Barry Sandison

Any enquiries relating to copyright or comments on this publication should be directed to:

Australian Institute of Health and Welfare
GPO Box 570
Canberra ACT 2601

Tel: (02) 6244 1000
Email: info@aihw.gov.au

Published by the Australian Institute of Health and Welfare.

           Please note that there is the potential for minor revisions of data in this report.
              Please check the online version at www.aihw.gov.au for any amendments.
Contents
  How healthy are we?         1

  Australia’s health system   33

  All is not equal            47

                                    iii

                                   Australia’s health 2020: in brief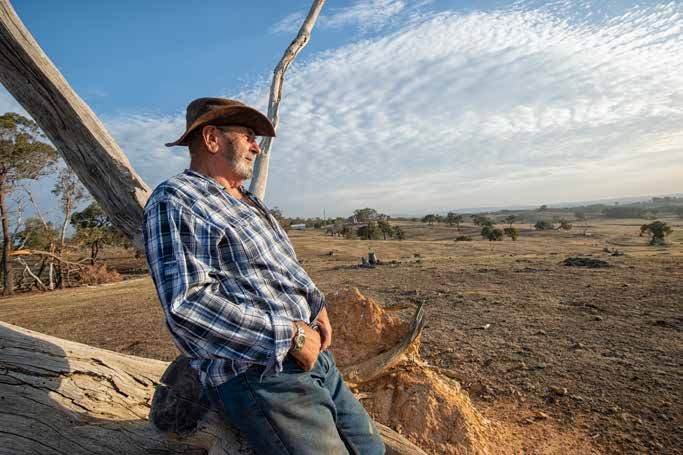
About Australia’s health 2020
                                    This edition of the AIHW’s biennial flagship report on health introduces a new format
                                    and an expanded product suite:

                                                                     Australia’s health 2020: data insights
                                                                     This is a collection of topical, in-depth articles on
                                                                     selected health issues, including a picture of
                                                                     health data in Australia. It is available online and
                                                                     as a print report.

                                                                     Australia’s health snapshots
  iv
                                                                     These are web pages that present key information
                                                                     and data on the health system, health of
Australia’s health 2020: in brief

                                                                     Australians and factors that can influence our
                                                                     health. The 71 snapshots are available online in
                                                                     HTML and as a PDF.

                                                                     Australia’s health 2020: in brief
                                                                     This is a short, visual report summarising key findings
                                                                     and concepts from the snapshots to provide a
                                                                     holistic picture of health in Australia. It is available
                                                                     online and as a print report.

                                    All products can be viewed or downloaded at www.aihw.gov.au/australias-health

                                     For information on COVID-19, see Australia’s health 2020: data insights which includes
                                     an article on what is known in Australia, four months on from the first confirmed case.


1
    HOW
    HEALTHY
    ARE WE?
On an average day

                                                              830
                                                              babies are born
                                                                                                                      430
                                                                                                                      people die
HOW HEALTHY ARE WE?

                                                          400
                                                          people are diagnosed
                                                                                                  14
                                                                                                  people are newly
                                                          with cancer                             diagnosed with
                                                                                                  end-stage kidney disease
       2

                                            100                                                   7
Australia’s health 2020: in brief

                                            people have                                           new cases of
                                            a stroke                                              type 1 diabetes
                                                                                                  are diagnosed

                                                                                      there are

                                                                                     1,460
                                                                                     hospitalised injury cases

                                                     13
                                                      women and
                                                                                          5
                                                                                          men
                                                                                                      are hospitalised as a result of
                                                                                                      family and domestic violence

                                    Note: The ‘average day’ value is the year total divided by 365.
From infancy to old age
Babies
9 in 10 babies born are born at term
Infants
94.3% of 1-year-olds and 91.6% of 2-year-olds are
immunised
HOW HEALTHY ARE WE?
Children
Asthma is the leading cause of disease burden for
children aged 5–14
Young people 3
Almost all (97%) young people aged 14–17 have never
Australia’s health 2020: in brief
smoked tobacco and two-thirds (66%) have never had
a full serve of alcohol
Adults
Fewer than1 in 20 men (aged 19 and over) and
around 1 in 10 women meet the recommendations for
daily vegetable consumption
Older people
Around 4 in 10 people aged 65 and over
say they are in excellent or very good healthWe are living more years in good health
Australians are living longer—with more of those years lived in good health—and
generally rate their health well.
Life expectancy at birth in Australia is continuing to rise.
Life expectancy measures how long, on average, a person is expected to live
based on current age and sex-specific death rates.
Life expectancy for males born in 2016–2018 was 80.7 years, up from 55.2 years
for those born in 1901–1910. Life expectancy was 84.9 years for females born in
2016–2018, up from 58.8.
HOW HEALTHY ARE WE?
Life expectancy at birth, 1886 to 2018
Years
90
Females
80
4 70 Males
Australia’s health 2020: in brief
60
50
40
0
1880 1890 1900 1910 1920 1930 1940 1950 1960 1970 1980 1990 2000 2010 2020
We are living longer and have more years in good health:
Males born in 2015 were expected to have When asked about our own health,
2.0 more years of healthy life than males the majority of us think we're
born in 2003, and females born in 2015 doing well.
could expect 1.3 more years of healthy life.
56%
More than half of Australians aged
2.0 1.3 15 and over self-rated their health as
more years more years ‘excellent’ or ‘very good’ in 2017–18.How do we compare?
Australia performs as well as or better than many other comparable countries on
selected measures of health. However, there are some areas where improvement
can be made.
Compared with the other 35 members of the Organisation for Economic Co-operation
and Development (OECD) in 2017, Australia had the:
• 7th lowest rate of daily smoking for people aged 15 and over
• 9th highest life expectancy for males and the 7th highest for females
• 5th highest obesity rate (out of 23 countries) for people aged 15 and over.
HOW HEALTHY ARE WE?
Australia’s ranking among OECD countries for selected health measures,
2017
Less desirable rank More desirable rank
Alcohol consumption
Colon cancer survival
5
Coronary heart disease mortality
Australia’s health 2020: in brief
Daily smoking
Dementia prevalence
Health expenditure
Life expectancy at birth, females
Life expectancy at birth, males
Obesity
Practising doctors
Practising nurses
Other OECD country OECD average Australia
Find out more: International comparisons of health dataCauses of death vary by age
Leading cause of death differs by age. Chronic diseases feature more prominently
among people aged 45 and over, while external causes, such as accidents and
suicides, are the leading causes for people aged 1–44.
Top 5 leading causes of death, 2016–18
Age group
Rank Under 1 1–14 15–24 25–44 45–64 65–74 75+
Perinatal and Land transport Coronary heart Coronary heart
1st congenital
accidents
Suicide Suicide
disease
Lung cancer
disease
conditions
HOW HEALTHY ARE WE?
Perinatal and Dementia
Other ill-defined Land transport Accidental Coronary heart including
2nd causes
congenital
accidents poisoning
Lung cancer
disease Alzheimer's
conditions
disease
Chronic
Sudden infant Accidental Land transport obstructive Cerebrovascular
3rd death syndrome
Brain cancer
poisoning accidents
Suicide
pulmonary disease
disease
Chronic
Accidental Accidental
Coronary heart Colorectal Colorectal obstructive
4th threats to drowning and Assault
disease cancer cancer pulmonary
6 breathing submersion
disease
Other ill-defined Cerebrovascular
Australia’s health 2020: in brief
5th Cardiomyopathy Suicide
causes
Breast cancer Breast cancer
disease
Lung cancer
Disease group Cancer Ill-defined Injuries Respiratory
Cardiovascular Infant & congenital Neurological
Land transport accidents were the most common cause of death among children
aged 1–14 (11% of all deaths in this age group). Suicide was the leading cause of
death among people aged 15–44. Coronary heart disease and lung cancer were
the leading causes of death for people aged 45–74. Dementia including Alzheimer’s
disease was the second leading cause of death among people aged 75 and over
(12%), behind coronary heart disease (13%).
Find out more: Causes of deathWhat is the burden of disease?
In 2015, Australians lost 4.8 million years of healthy life (DALY) due to illness or
premature death. This is equivalent to 199 DALY per 1,000 population.
Half of this burden was non-fatal (50%); that is, from living with the impacts of disease
and injury. Males experienced more burden than females.
Burden of disease combines the years of healthy life lost due to living with
ill health (non-fatal burden) with the years of life lost due to dying prematurely
(fatal burden). Total burden is reported using the disability-adjusted life
years (DALYs) measure.
HOW HEALTHY ARE WE?
What types of disease cause the most burden?
The disease groups causing the most burden in 2015 were cancer (18% of the total
burden), cardiovascular diseases (14%), musculoskeletal conditions (13%), mental &
substance use disorders (12%) and injuries (8.5%). Together, they accounted for
around two-thirds of the total burden in Australia.
The leading causes of burden differ depending on age:
7
Top 3 leading causes of total burden, 2015
Australia’s health 2020: in brief
Age group
Rank Under 5 5–14 15–24 25–44 45–64 65+
Pre-term & low Suicide & Suicide &
Coronary heart Coronary heart
birth weight Asthma self-inflicted self-inflicted
disease disease
1st complications (13.1%) injuries injuries
(6.8%) (10.9%)
(13.6%) (9.7%) (7.3%)
Birth trauma & Back pain & Back pain &
Anxiety disorders Anxiety disorders Dementia
2nd asphyxia problems problems
(10.6%) (7.6%) (8.3%)
(9.8%) (7.0%) (5.5%)
Sudden infant Depressive Depressive Chronic obstructive
Anxiety disorders Lung cancer
death syndrome disorders disorders pulmonary disease
3rd (7.0%) (4.5%)
(4.9%) (7.1%) (7.0%) (6.5%)
Disease group Cancer Infant & congenital Mental & substance use Neurological
Cardiovascular Injuries Musculoskeletal Respiratory
Find out more: Burden of diseaseHow many of us have
a chronic condition?
Almost half (47%, or more than 11 million people) of Australians have at least 1 of
10 selected chronic conditions and 1 in 5 (20%, or 4.9 million people) have multiple
chronic conditions, based on 2017–18 estimates.
Chronic conditions include illnesses such as heart disease, cancer, stroke,
diabetes, arthritis and asthma.
In 2017–18, the most common condition(s) for people aged:
• 15–44 were mental and behavioural conditions (22%)
HOW HEALTHY ARE WE?
• 45–64 were back pain and problems, and arthritis (25% each)
• 65 and over was arthritis (49%).
Many chronic conditions are largely preventable as they share risk factors that are
modifiable—that is, action can be taken to reduce the effect of the risk factor.
These risk factors include tobacco smoking, high blood pressure, insufficient physical
activity, poor diet and overweight and obesity.
8
Australia’s health 2020: in briefFewer deaths, but coronary heart
disease is still a large burden
Coronary heart disease (CHD) is our leading single cause of death. It accounts for
about $2.2 billion a year in health care costs and, in 2017–18, was the primary cause
of almost 161,800 hospitalisations.
• In 2017, an estimated 61,800 people aged 25 and over had an acute coronary event
(a heart attack or unstable angina)—around 169 events every day.
• In 2018, CHD was the underlying cause of death for 17,500 people.
This was 11% of all deaths, and 42% of cardiovascular deaths.
• T
he CHD death rate has fallen 82% since 1980. While CHD death rates fell
HOW HEALTHY ARE WE?
substantially in each age group, the rate of decline was more rapid for those aged
75 and over than for younger age groups.
Coronary heart disease deaths, 1980 to 2018
Deaths per 100,000 population
3,500
9
3,000
Australia’s health 2020: in brief
2,500
Men aged 75+
2,000
1,500 Women aged 75+
1,000
500
0
1980 1984 1988 1992 1996 2000 2004 2008 2012 2016 2020
In 2017–18, almost 95 million Pharmaceutical Benefits Scheme and Repatriation
Pharmaceutical Benefits Scheme prescriptions for cardiovascular medicines were
dispensed to the Australian community—31% of the total prescription medicines
dispensed.
Find out more: Coronary heart diseaseCancer survival is improving
There are over 1 million people alive in Australia who have previously been diagnosed
with cancer.
It is estimated that a
bout 145,500 new cases of cancer
will be diagnosed in Australia in 2020—an average of almost
400 people every day.
The most commonly diagnosed cancers
HOW HEALTHY ARE WE?
in males will be: in females will be:
16,700 (cases) 19,800 (cases)
prostate cancer breast cancer
9,500 7,200
melanoma of the skin colorectal cancer
10
8,300 6,700
Australia’s health 2020: in brief
colorectal cancer melanoma of the skin
7,200 6,000
lung cancer lung cancer
In 2012–2016, people diagnosed with cancer had a 69% chance of surviving for at
least 5 years, which is lower when compared with their counterparts in the general
population. This was an increase from a 5-year survival rate of 51% in 1987–1991.
Increased survival is due to a number of factors, including improvements in
treatments and care, and understanding and avoiding the risk factors associated with
cancer. Cancer screening programs also increase the likelihood of detecting cancer
early, which can lead to better outcomes from treatments and ultimately reduce
death from cancer. For example, women aged 50–69 who were diagnosed with a
breast cancer through BreastScreen Australia between 2002 and 2012 had a 42%
lower risk of dying from breast cancer by 2015 than women with breast cancers who
had never been screened.
Find out more: Cancer; Cancer screening and treatmentDiabetes increases with age
An estimated 1 in 20 (4.9%, or 1.2 million) Australians had diabetes in 2017–18,
including type 1 and 2 as well as where the type is unknown. Around 1 in every 6
females aged 15–49 who gave birth in hospital were diagnosed with gestational
diabetes.
The prevalence of diabetes increases with age. About 1 in 20 (4.5%) Australians
aged 45–54 have diabetes, compared with 1 in 10 (10%) 55–64 year olds and
almost 1 in 5 (19%) people aged 75 and over.
The age-standardised rate of self-reported diabetes
increased from 3.3% in 2001 to 4.4% in 2017–18.
HOW HEALTHY ARE WE?
After accounting for age, diabetes was more common
in males (5.0%) than females (3.8%).
Self-reported diabetes (age standardised), 2001 to 2017–18
Per cent
6
11
Australia’s health 2020: in brief
Males
5
Persons
4
Females
3
0
2001 2007-08 2011-12 2014-15 2017-18
Year
Find out more: DiabetesOlder women are more likely to
have musculoskeletal conditions
In 2017–18, an estimated 3 in 10 (29%, or 7.0 million) Australians had arthritis or
other musculoskeletal conditions, such as back pain, osteoarthritis and osteoporosis.
4.0 million 3.6 million 924,000
(16% of all Australians) have (15%) have (3.8%) have
back pain and problems arthritis osteoporosis
These rates remained relatively consistent between 2007–08 and 2017–18.
HOW HEALTHY ARE WE?
Females, older people and people living in the lowest socioeconomic areas are more
likely to have chronic musculoskeletal conditions.
Arthritis and other musculoskeletal conditions, 2017–18
Per cent
80 Males Females Persons
12
70
Australia’s health 2020: in brief
60
50
40
30
20
10
0
0–44 45–54 55–64 65–74 75+ Total
Age group
Musculoskeletal conditions was the disease group with the highest estimated
expenditure in 2015–16 at $12.5 billion (11% of Australia’s total disease expenditure).
Find out more: Bone and joint health1 in 10 Australians have asthma
In 2017–18, an estimated:
4.7 million 2.7 million
(19%) had hay fever (11%) had asthma
7.4 million
people (1 in 3 Australians) had a 2.0 million 599,000
chronic respiratory condition (8.4%) had (2.5%) had COPD.
(31% of the total population) chronic sinusitis
HOW HEALTHY ARE WE?
Chronic obstructive pulmonary disease (COPD) affects mainly middle-aged and older
people, and the prevalence tends to increase with age.
Asthma affects people of all ages, but is most common among women aged 55 and over:
Males Age group Females
9.0% 75 and over 12.8%
13
9.6% 65–74 15.5%
Australia’s health 2020: in brief
10.3% 55–64 14.8%
10.1% 45–54 14.6%
9.9% 35–44 12.7%
8.5% 25–34 12.7%
10.3% 15–24 10.4%
12.0% 0–14 7.9%
1
About one-third (31%) of people with self-reported asthma have a written asthma
action plan—67% of children aged 0–14 with asthma and 24% of people aged 15 and
over with asthma.
Find out more: Chronic respiratory conditions1 in 10 adults have signs of
chronic kidney disease
An estimated 1 in 10 Australian adults (10%)—about 1.7 million people in
2011–12—had biomedical signs of chronic kidney disease (CKD) showing
reduced filtration or a damaged kidney.
In 2017–18, CKD was recorded as a diagnosis in around 1.9 million
hospitalisations—17% of all hospitalisations in Australia. Of these, 80% (1.5 million)
were for regular dialysis treatment, making dialysis the most common reason for
hospitalisations. Age-standardised dialysis rates have increased by 19% over the
last decade, from 4,500 per 100,000 population in 2007–08 to 5,400 per 100,000
population in 2017–18.
HOW HEALTHY ARE WE?
Around 25,400 people received kidney replacement
therapy (that is, a kidney transplant or dialysis) in 2018.
Just over half (53%) of these people had dialysis while 47%
had a kidney transplant.
14
Find out more: Chronic kidney disease
Australia’s health 2020: in briefOver 400,000 Australians are
living with dementia
It is estimated that 400,000 to 459,000 Australians are living with dementia.
This number is expected to increase to between 550,000 and 590,000 by 2030, in line
with the continued growth and ageing of Australia’s population. The most well-known
form of dementia is Alzheimer’s disease.
Increasing deaths from dementia
Dementia was the 2nd leading cause of death in Australia in 2018, accounting
for about 14,000 deaths. For females, it was the leading cause of death (9,000 deaths),
HOW HEALTHY ARE WE?
while it was the 3rd leading cause for males (5,000).
The number of deaths where dementia was an underlying cause increased by 68%
between 2008 and 2017. The age-standardised death rate increased from 33 deaths
per 100,000 people in 2008 to 42 deaths per 100,000 in 2017. This may reflect not
only an increase in the number of older people with dementia, but also changes in
how dementia deaths are recorded.
Deaths attributed to dementia (age standardised), 2008 to 2017 15
Deaths per 100,000 persons
Australia’s health 2020: in brief
45
Females
40
Persons
Males
35
30
25
20
0
2008 2009 2010 2011 2012 2013 2014 2015 2016 2017
Year
Find out more: Dementia1 in 5 Australians report having
a mental health condition
Mental health conditions can severely affect all aspects of a person’s life—including
their health, day-to-day interactions with family and friends, and ability to study
or work.
Based on self-reported data, an estimated 1 in 5 Australians had a mental or
behavioural condition in 2017–18.
In 2017–18, females and people aged 15–24 were most likely to report having a
current long-term mental or behavioural condition:
HOW HEALTHY ARE WE?
Males Age group Females
17.3% 65 and 22.4%
over
19.1% 55–64 26.6%
16
20.5% 45–54 26.6%
Australia’s health 2020: in brief
18.2% 35–44 22.9%
17.1% 25–34 25.1%
21.3% 15–24 30.0%
13.7% 0–14 8.2%
Find out more: Mental healthFalls are a leading cause of injury
Most injuries, whether unintentional or intentional, are preventable. In 2017–18,
over 13,000 people died, and there were over 532,500 hospitalisations in Australia
because of injury. About 4 in 10 of these hospitalisations and deaths were due to
accidental falls.
In 2017–18:
• accidental falls were the most common cause of injury deaths (40% of all deaths),
followed by suicide (23%) and transport crashes (11%)
• for males, suicide and falls were the leading causes of injury death (29% of male
injury deaths, each)
HOW HEALTHY ARE WE?
• for females, falls were the leading cause of injury death (56% of female injury
deaths). Most (97%) fall deaths for females were in those aged 65 and over.
In 2017–18, there were around 65,000 hospitalised injury cases among children
aged 0–14. Nearly half (45%, or 29,300) were due to falls.
Find out more: Injury; Health of children
17
Australia’s health 2020: in briefFEATURE
HOW HEALTHY ARE WE?
A FOCUS ON SUICIDE
AND INTENTIONAL
SELF-HARM
18
Suicide and intentional self-harm have devastating effects on individuals,
families and communities. When looked at together, suicide and
Australia’s health 2020: in brief
self-inflicted injuries were the third leading cause of premature death
from injury or disease in Australia in 2015. In 2016–18, suicide was the
leading cause of death among people aged 15–44.
HOW MANY AUSTRALIANS HAVE
THOUGHT ABOUT SUICIDE?
While data are limited, the 2007 National Survey of Mental Health and Wellbeing
shows that at some point in their lives, 1 in 8 (13%) Australians aged 16–85 had
serious thoughts about taking their own life, 1 in 25 (4.0%) made a suicide plan and
1 in 33 (3.3%) had attempted suicide. This is equivalent to over 2.1 million Australians
having thought about taking their own life, over 600,000 making a suicide plan and
over 500,000 making a suicide attempt during their lifetime.FEATURE
MORE MALES DIE BY SUICIDE
In 2018, there were 3,046 deaths by suicide registered in Australia, more than
three-quarters of which were among males. By comparison, there were
1,135 road deaths—such as those due to car crashes—in the same year.
Age-specific death rates are high between the ages of 35 and 59 for both males
and females.
More than half (55%) of all deaths by suicide were among people aged 30–59 (1,669
deaths). For males, the highest proportion of suicide deaths were among those
HOW HEALTHY ARE WE?
aged 45–49 while for females they were among those aged 40–44. In 2018, the
number of deaths by suicide was higher for males than females across all age groups:
Males Age group Females
63 (deaths) 85 and over 15
50 80–84 24
60 75–79 19 19
81 70–74 22
Australia’s health 2020: in brief
91 65–69 35
145 60–64 45
207 55–59 61
201 50–54 70
230 45–49 69
200 40–44 75
222 35–39 62
214 30–34 58
209 25–29 60
203 20–24 49
132 15–19 52
Find out more: Suicide and intentional self-harm; Causes of deathFEATURE
MORE FEMALES HOSPITALISED FOR
INTENTIONAL SELF-HARM
Intentional self-harm is when a person deliberately hurts or injures themselves, not
necessarily with the intention of dying. In 2016–17, there were about 33,100 cases of
hospitalised injury due to intentional self-harm—7% of all hospitalised injury cases.
Females are more likely to be hospitalised for intentional self-harm than men—making
up almost two-thirds (64%) of intentional self-harm hospitalisation cases in 2016–17.
HOW HEALTHY ARE WE?
Hospitalisations for intentional self-harm were also more common among younger
age groups. In 2016–17, females in their late teens had the highest rate of
hospitalised injury cases for intentional self-harm—there were 686 hospitalisations
for intentional self-harm for every 100,000 females aged 15–19, nearly 4 times the
rate for males of the same age (180 per 100,000 males).
Age specific rate of hospitalisations for intentional self-harm
(cases per 100,000 persons)
20
Males Age group Females
Australia’s health 2020: in brief
92.5 95 and over 28.0
76.7 90–94 43.5
64.8 85–89 38.9
50.0 80–84 39.1
33.7 75–79 37.8
37.9 70–74 44.6
44.9 65–69 50.6
66.7 60–64 71.6
78.6 55–59 106.1
112.3 50–54 168.2
140.3 45–49 194.4
150.5 40–44 196.8
144.3 35–39 187.4
148.8 30–34 188.9
156.9 25–29 226.2
184.7 20–24 361.0
179.7 15–19 685.8
7.4 0–14 48.5
Between 2007–08 and 2016–17, the rates of hospitalised injury cases for intentional
self-harm for females aged 15–24 rose 62%, from 317 to 512 per 100,000 people.FEATURE
UNDERSTANDING SUICIDE RISK
AMONG VETERANS
There is ongoing concern within the Australian Defence Force (ADF) and the wider
Australian community about suicide in ADF personnel. In particular, ADF personnel
who are no longer serving may face increased risk of suicide.
Between 2001 and 2017, there were 419 deaths by suicide among serving, reserve
and contemporary ex-serving ADF personnel.
HOW HEALTHY ARE WE?
After adjusting for age, the rate of suicide compared with Australian men for the
2002–2017 period was:
• 48% lower for serving men
• 48% lower for men in the reserves
• 18% higher for contemporary ex-serving men.
Find out more: Health of veterans
21
SUICIDE RATES AMONG INDIGENOUS
Australia’s health 2020: in brief
AUSTRALIANS
In 2018, 169 Aboriginal and Torres Strait Islander people died by suicide.
Age-standardised rates of Indigenous deaths by suicide (23.7 per 100,000 people)
were almost double that of non-Indigenous Australians in 2014–18 (12.3 per
100,000 people).
Find out more: Suicide and intentional self-harm; Indigenous life expectancy
and deaths
If you or someone you know needs advice or support, these services can help:
Lifeline 13 11 14
Suicide Call Back Service 1300 659 467
Kids Helpline 1800 55 1800
MensLine Australia 1300 78 99 78
Beyond Blue 1300 22 4636How does lifestyle affect our
health?
Many serious health issues, including some chronic diseases, are related to
lifestyle factors.
The 5 risk factors that caused the most disease burden in Australia in 2015, were:
1. tobacco use (9.3% of total burden)
2. overweight and obesity (8.4%)
3. dietary risks (7.3%)
4. high blood pressure (5.8%)
HOW HEALTHY ARE WE?
5. high blood plasma glucose (including diabetes) (4.7%).
22
Australia’s health 2020: in briefTobacco smoking
Tobacco smoking is the leading cause of preventable diseases and death in
Australia—it was responsible for more than 1 in 8 (21,000) deaths in 2015. Successful
public health strategies over many decades have resulted in a significant decline in
daily smoking rates, with Australia now having one of the lowest daily smoking rates
among OECD countries. While smoking rates continue to decline, the health impact is
expected to continue because some diseases associated with smoking, such as lung
cancer and chronic obstructive pulmonary disease, can take many years to develop.
Fewer adults are smoking daily than ever before
HOW HEALTHY ARE WE?
According to the National Drug Strategy Household Survey,
an estimated 11.6% of Australian adults were
daily smokers in 2019.
This is a decrease from an estimated 12.8% in 2016, and
less than half the rate in 1991 (25%).
Who is most likely to smoke? 23
In 2019:
Australia’s health 2020: in brief
• men were more likely to smoke daily than women (12.8%, compared with 10.4%)
• people in their 40s and 50s were most likely to smoke daily (15.8% and 15.9%,
respectively)—a change from 2001, when people in their 20s and 30s were the
most likely to smoke daily.
Fewer young people are taking up smoking
In 2019, nearly all (97%) 14–17 year olds and 4 in 5 (80%) young adults aged 18–24 had
never smoked. This is an improvement since 2001; 82% and 58%, respectively.
Fewer children are exposed to tobacco smoke in the home
Exposure to second-hand smoke affects people of all ages. It can cause cardiovascular
and respiratory diseases in adults and cause sudden infant death syndrome and
induce and exacerbate a range of respiratory effects in infants and children.
The proportion of households with 19.7%
dependent children where someone
smoked inside the home has fallen over time:
2.8% 2.1%
Find out more: Tobacco smoking 2001 2016 2019Alcohol
While most Australians drink alcohol at levels that cause few harmful
effects, those who do drink at risky levels increase the risk of harm to
themselves, their families, bystanders and the broader community.
According to Australian Bureau of Statistics consumption of alcohol data,
we are drinking less than a decade ago—consumption levels were 9.5
litres of pure alcohol available per person aged 15 and over in 2017–18,
down from 10.8 litres in 2007–08.
Fewer people are drinking at risky levels and more are
abstaining
The National Drug Strategy Household Survey reported that in 2019:
HOW HEALTHY ARE WE?
• 1 in 5 (17.6%) adults exceeded the lifetime risk guidelines and 2 in 5 (38%) exceeded
the single occasion risk guidelines—down from 21% and 43%, respectively, in 2001
• 1
in 5 (21%) adults and 3 in 4 (73%) people aged 14–17 abstained from drinking
alcohol in the previous 12 months—up from 15.5% and 32%, respectively, in 2001.
People abstaining from alcohol or exceeding risky drinking guidelines,
2001 to 2019
24 Per cent
80
14–17-year-olds abstaining from alcohol
Australia’s health 2020: in brief
70
60
50
40
Adults exceeding single occasion risk guidelines
30
Adults exceeding lifetime risk guidelines
20
10 Adults abstaining from alcohol
0
2001 2004 2007 2010 2013 2016 2019
Who is most at risk?
Young people aged 18–24 are most likely to consume alcohol at levels which exceed
single occasion risk guidelines at least once a month, while adults aged 40–59 are most
likely to drink at levels which exceed lifetime risk guidelines.
In 2019, men were at higher risk of alcohol-related injury or harm than women from
drinking at levels that exceeded the:
• single occasion risk guidelines: 48% compared with 29% of women
• lifetime risk guidelines: 26% of men compared with 9.9% of women.
Find out more: Alcohol risk and harmIllicit use of drugs
Illicit drug use can have health, social and economic impacts for individuals, families
and the broader community.
According to the 2019 National Drug Strategy Household Survey, an estimated 3.4 million
(16.4%) people aged 14 and over in Australia had used an illicit drug in the previous
12 months and 9.0 million (43%) people had used an illicit drug at some point in their
lifetime. This was similar to the proportions in 2016 (15.6% and 43%, respectively).
In 2019, the most common illicit drugs used in the previous 12 months were:
11.6% 4.2% 3.0%
cannabis cocaine ecstasy
(up from 10.4% in 2016) (up from 2.5% in 2016) (up from 2.2% in 2016)
HOW HEALTHY ARE WE?
In 2019, 2.7% of people used ‘pain-killers and opioids’ for non-medical purposes, down
from 3.6% in 2016. Since medications containing codeine were restricted to sale with
a prescription only in 2018, the proportion of people using codeine for non-medical
purposes has decreased (from 3.0% in 2016 to 1.5% in 2019).
Drug-induced death rate is one of the highest on record
In 2018, over 1,700 deaths in Australia were drug-induced (a rate of 7.0 per 100,000 25
population, age-standardised)—one of the highest rates on record, but still lower than
in 1999 (9.1 deaths per 100,000 population, age-standardised). Opioids was the most
Australia’s health 2020: in brief
common drug class present in drug-induced deaths over the past decade.
Drug-induced deaths (age-standardised), by selected drugs, 1997 to 2018
Rate per 100,000
10
9
8
7 All drugs
6
5
Opioids
4
3 All depressants
All antidepressants
2
All antipsychotics
1
Non-opioid
analgesics
0
1998 2000 2002 2004 2006 2008 2010 2012 2014 2016 2018
Find out more: Illicit drug useOverweight and obesity
Being overweight or obese increases a person’s risk of developing many chronic
conditions—such as cardiovascular disease—and of dying prematurely.
In 2017–18, an estimated:
1 in 4 (25%, or 1.2 million) children and adolescents
aged 2–17 were overweight or obese
17% 8.2%
were overweight but not obese were obese
HOW HEALTHY ARE WE?
2 in 3 (67%, or 12.5 million) adults were overweight
or obese
36% 31%
were overweight but not obese were obese
26
More men than women were Obesity is more common in
Australia’s health 2020: in brief
overweight but not obese older age groups—16% of
(42% of men and 30% of women), adults aged 18–24 were
but obesity rates for men and obese, compared with
women were similar (33% of men 41% of adults aged 65–74.
and 30% of women).
The prevalence of overweight and obesity:
• in children and adolescents aged 5–17 rose from 20% in 1995 to 25% in 2007–08,
then remained relatively stable to 2017–18 (25%).
• among Australians aged 18 and over increased from 57% in 1995 to 67% in
2017–18 (age standardised). This was largely due to an increase in obesity rates,
from 1 in 5 (19%) in 1995 to 1 in 3 (31%) in 2017–18.
Find out more: Overweight and obesityInsufficient physical activity
Regular physical activity is important for optimal health and wellbeing. It
can improve a person’s immune system and mental and musculoskeletal
health, and reduce disease risk factors such as overweight and obesity.
Based on self-reported data from the 2017–18 National Health Survey, an estimated
1 in 2 adults (55%) did not participate in sufficient physical activity. Women were more
likely than men to be insufficiently active (59% compared with 50%).
Activity levels generally decrease with age
Less than half of 18–24 year olds were insufficiently active (41% of men and 48% of
women) compared with more than two-thirds of those aged 65 and over (69% of men
and 75% of women).
HOW HEALTHY ARE WE?
In 2011–12, 83% of children aged 2–5, 88% of children aged 5–12, and 98% of young
people aged 13–17 did not meet the physical activity and sedentary behaviour
guidelines on all 7 days in the last week.
Find out more: Insufficient physical activity
Diet 27
Australia’s health 2020: in brief
The food and beverages we consume (our diet) play an important role in our overall
health and wellbeing. Food provides energy, nutrients and other components that, if
consumed in insufficient or excess amounts, can result in ill health. A healthy diet helps
to prevent and manage health risk factors such as overweight and obesity, high blood
pressure and high blood cholesterol, as well as associated chronic conditions, including
type 2 diabetes, cardiovascular disease and some forms of cancer.
In 2017–18, many Australians did not eat the recommended number of daily serves of:
Boys Girls Men Women
Vegetables 95% 93% 96% 89%
Fruit 30% 24% 53% 44%
An estimated 1 in 14 (7.1%) children and adolescents aged
2–17 and 1 in 10 (9.1%) adults aged 18 and over consumed
sugar sweetened drinks every day—men were almost twice as
likely (12%) as women (6.4%).
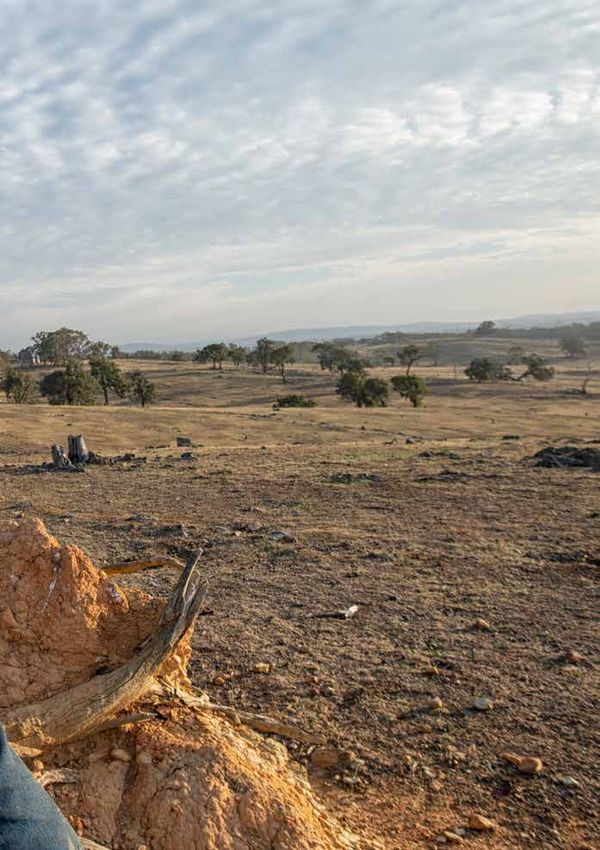
Find out more: DietFEATURE
HOW HEALTHY ARE WE?
THE WORLD
AROUND US: HOW
THE ENVIRONMENT
28
AFFECTS OUR
HEALTH
Australia’s health 2020: in brief
Our health is affected by our environment, including the air we
breathe, the water we drink, the soils and climate that grow our
food, and the spaces in which we live and work. Our environment
can help us maintain—or create challenges to—good health.
The natural environment—including the land, air and water—underpins human
health, but is under pressure from human activity. When well planned, the built
environment—which includes housing, public spaces, and transport, water and
energy networks—can bolster and protect people’s health and wellbeing. However,
for many people, the built environment creates challenges to good health.
Some aspects of our environment have direct implications for our health—such as
illness or injury directly caused by exposure to an element of our environment. Other
aspects of our environment have important, but less direct effects—for example, the
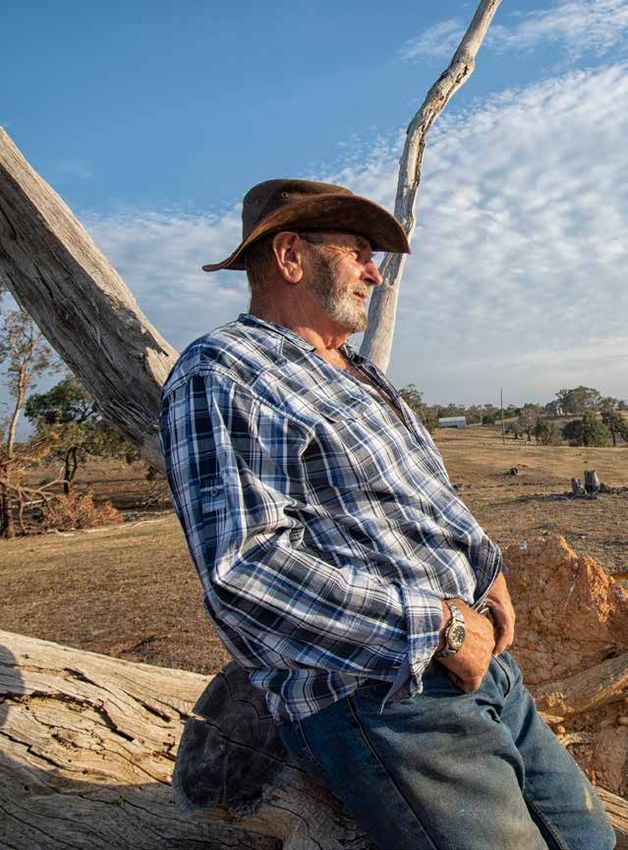
availability of food due to weather conditions.FEATURE
THE NATURAL ENVIRONMENT CAN
AFFECT HEALTH IN DIVERSE WAYS
Climate change is having an increasing effect on most of the natural environments
that support human health and wellbeing. Some people are affected more than
others. These include people living in rural and remote areas, those in low-lying,
flood or bushfire-prone areas, and people who work outdoors. Older people,
HOW HEALTHY ARE WE?
children, people with existing health conditions and socioeconomically
disadvantaged groups are also at increased risk.
Under climate change, the frequency and/or intensity of some extreme weather
events has increased.
Extreme weather events—such as heatwaves, drought, bushfires, violent storms,
heavy rainfall and flooding—can affect a person’s physical and mental health.
These events affect health directly and indirectly. For example, a person may sustain
29
an injury due to exposure to a bushfire or a violent storm; droughts and floods can
lead to higher rates of some vector-borne and gastrointestinal diseases; weather
Australia’s health 2020: in brief
conditions may affect the availability, variety and price of food; bushfire smoke
can cause significant air pollution leading to respiratory problems. In many cases,
existing health conditions such as heart disease, kidney disease and diabetes are
exacerbated by extreme events.
Experiencing an extreme weather event can also affect a person’s mental
health—even if they are not directly impacted. For example, one study on the
impacts of the 2019–20 bushfire season estimated that 10% of Australian adults
considered their home or property was directly threatened, while over half (57%)
experienced anxiety or worry due to the bushfires.FEATURE
AUSTRALIA IS KNOWN FOR ITS
SUNSHINE—AND IT COMES WITH
BENEFITS AND RISKS
Ultraviolet radiation (UV) from the sun helps the body to manufacture Vitamin D,
which is essential for good health. However, UV can also cause a number of cancers,
such as melanoma and other skin cancers, and cancer of the eye. Research suggests
that UV may be responsible for 20% of cataracts globally.
HOW HEALTHY ARE WE?
Melanoma of the skin is one of Australia’s most common cancers, with the number of
new cases increasing each year—in 2000, there were 8,700 new cases diagnosed and
970 deaths. By 2019, there were an estimated 15,200 new cases and 1,700 deaths.
Exposure to UV can be limited through wearing protective clothes (for example, a hat
and long-sleeved shirt) and adopting sun protection behaviours (for example, using
sunscreen or seeking out shade). When asked about these behaviours, about half
(47%) of adults and one-third (33%) of young people (aged 12–17) used 2 or more
30 of these recommended methods to protect themselves from UV exposure on a
summer weekend.
Australia’s health 2020: in brief
HOMES AND NEIGHBOURHOODS CAN
HELP OR HINDER GOOD HEALTH
Most Australians live in in urban areas, such as cities or large towns. The way these
areas are formed and laid out—including whether there is adequate housing,
opportunities for exercise, and access to healthy foods—can affect people’s health
and wellbeing.
In Australia, there can be great distances between where people live and where they
work. This can lead to greater use of cars, long commutes, and fewer opportunities
for physical activity. However, good urban design and planning of suburbs can
improve ‘walkability’ for residents. For example, if shops, schools and other services
are located within a short distance of people’s homes, they have more opportunities to
walk—studies have shown that people who live within 1.6 kilometres of a convenience
store, shopping centre or newsagent are twice as likely to walk regularly.
Thoughtful design can also improve access to green and public open spaces, further
supporting physical activity and significantly improving a person’s physical and
mental health.FEATURE
Green spaces are an example of the often interconnected nature of
the built and natural environments: well-planned green spaces and
street plantings can support biodiversity, improve air quality and reduce
temperatures. They also provide places for planned and incidental social
interaction and facilitate community connections and wellbeing.
HOW HEALTHY ARE WE?
The layout of urban areas can also influence a person’s food choices. There is some
evidence that greater density of fast food outlets in an area is associated with people
being overweight or obese. A similar association has been found between a higher
density of alcohol outlets in an area and alcohol-related harm.
Many other aspects of our home environments can affect health. For example, issues
31
such as homelessness can cause psychological distress, affect a person’s ability to
take part in employment or education, and negatively affect their overall health.
Australia’s health 2020: in brief
Recent data show 116,000 Australians are homeless, 1 million live in financial housing
stress and almost 1 million live in housing that is in poor physical condition.
Find out more: Natural environment and health; Built environment and health32 AUSTRALIA’S HEALTH SYSTEM Australia’s health 2020: in brief
2
    AUSTRALIA’S
    HEALTH
    SYSTEM
On an average day in our health
system
$508 million
is spent on health
($21 per person)
$347 million $45
million
AUSTRALIA’S HEALTH SYSTEM
is spent by governments is spent by private health
insurance providers
829,000 433,000
prescriptions are visits are made to a
filled under the PBS general practitioner
and RPBS
34
Australia’s health 2020: in brief
there are
32,000 23,000
hospitalisations
presentations are made to
public hospital emergency
departments
26,000 6,000
Medicare-subsidised elective surgeries
optometry services are performed
are provided
Note: The ‘average day’ value is the year total divided by 365.Australia’s health system
Every day, many Australians come into contact with the health system. It could be
through a visit to a doctor, dentist or specialist; by picking up a prescription from a
pharmacist; by receiving a vaccination at school; or by going to hospital because of
an accident or to have surgery.
Our health system is a complex mix of programs and services. It includes public and
private hospitals, primary health care services (such as general practitioners and
allied health services), and referred medical services (including many specialists).
Many health services are paid for, and delivered by, the Australian or state and territory
AUSTRALIA’S HEALTH SYSTEM
governments, while others are managed by private or not-for-profit organisations.
All are supported and delivered by a range of health professionals including doctors,
nurses, specialists, and administrative staff. Together, these organisations and
professionals work to keep us healthy.
The health system works to reduce the burden that ill health places on the
community through a mixture of preventive health measures. These include:
• vaccination programs and public health campaigns
• early detection programs such as cancer screening
• assistance with normal life events such as giving birth 35
• provision of curative measures and treatments such as medicines and surgery
Australia’s health 2020: in brief
• ongoing management of incurable conditions such as diabetes care
• palliative care for the terminally ill.
Some of the Australian health system's biggest success stories have included
improvements in cancer survival rates and maternal mortality.How much money is spent on health?
In 2017–18, Australia spent $185 billion on health, or about $7,500 per person—a real
increase from $4,800 per person in 2000–01. About two-thirds of health spending is
funded by government. Non-government sources, including individuals,
fund the rest.
Who funds health services? Where does the money go?
6.2% 7.4%
Other non-government 3.0% Other services
9.0%
Health 5.0% Research
AUSTRALIA’S HEALTH SYSTEM
insurance Capital
40%
providers expenditure
Hospitals
10%
17% Referred
Individuals medical
services
42%
Australian
Government
27% 34%
State/territory Primary
36 governments health care
Australia’s health 2020: in brief
Australia’s spending on health is
8th highest in the OECD
Health spending in Australia has generally grown faster than the rest of the economy
since 2000–01. The ratio of health spending to gross domestic product (GDP)
increased from 8.3% in 2000–01 to 10% in 2017–18.
Out of 36 Organisation for Economic Co-operation and Development (OECD) countries
in 2017, Australia had the eighth highest expenditure on health care relative to GDP.
In 2007, Australia ranked 10th. However, during the global financial crisis, many OECD
countries experienced very low (even negative) GDP growth rates and their health
spending as a proportion of their GDP rose. This pushed Australia’s rank lower to 16th
in 2009 and 18th in 2010. More recently (2014 to 2017), Australia’s ranking has risen as
spending on health rises faster than the rest of the economy.
Find out more: Health expenditureMore than 2 in 5 Australians have
private hospital cover
At June 2019, 11.2 million Australians (44% of the population) had some form of
private patient hospital cover, and 13.6 million (53%) had some form of general
treatment cover.
Hospital health insurance covers the cost of in-hospital treatment and
other hospital costs, such as accommodation and theatre fees, in either
public or private facilities.
AUSTRALIA’S HEALTH SYSTEM
General treatment cover (often known as ‘extras’ cover) is generally for
non-hospital medical services that are not usually covered by Medicare,
such as dental, optical and physiotherapy.
In 2017–18, about 1 in 8 (13%) hospitalisations in public hospitals were for patients
who used private health insurance to fund all or part of their admission. During the
same period, more than 4 in 5 (83%) hospitalisations in private hospitals were funded
by private health insurance.
Find out more: Private health insurance
37
Australia’s health 2020: in brief
Who works in health care?
There were more than 586,000 registered health practitioners in Australia in 2018,
including:
133,400
334,000 allied health professionals
nurses and midwives (such as physiotherapists,
pharmacists and psychologists)
98,400 20,600
medical practitioners dental practitioners
Between 2013 and 2018, the Australian registered health workforce increased by
over 82,000 health professionals, an increase of 16%.
Find out more: Health workforceWhat happens in hospitals?
Hospitals are diverse in location, size and services provided. Both public and private
hospital sectors provide services for admitted and non-admitted patients (including
outpatients and people presenting to emergency departments).
There were 693 public hospitals in Australia
in 2017–18 and 657 private hospitals (including
day hospital facilities) in 2016–17.
AUSTRALIA’S HEALTH SYSTEM
In 2017–18, $74.0 billion was spent on Australia's public and private hospitals.
Spending per person on hospital
care increased by an average of
2.1% per year
38 between 2013–14 and 2017–18
after adjusting for inflation.
Australia’s health 2020: in brief
The number of public hospital beds per 1,000 people was relatively stable between
2013–14 and 2017, ranging between 2.5 to 2.6 beds per 1,000 people. The number of
private hospital beds per 1,000 people increased from 1.3 per 1,000 people in 2012–13
to 1.4 per 1,000 people in 2016–17.
2.5 beds 1.4 beds
per 1,000 people per 1,000 people
in public hospitals in private hospitals
(in 2017–18) (in 2016–17)Hospitalisations, or admitted patient services, are when a patient is formally
admitted to a hospital. Hospitalisations can either be on the same day or involve
a stay in hospital of 1 or more nights.
In 2018–19, there were
11.5 million hospitalisations:
6.9 million 4.6 million
in public hospitals in private hospitals
The total number of hospitalisations rose by an average of 3.3% each year between
2014–15 and 2018–19—faster than the average population growth of 1.6%.
AUSTRALIA’S HEALTH SYSTEM
Hospitalisations rose by an average of 3.7% each year in public hospitals and 2.6%
in private hospitals.
In 2018–19, 2.3 million hospitalisations were for elective surgery. Two-thirds (66%)
of these occurred in private hospitals.
The median waiting time for elective surgery
35 days 41 days
in public hospitals has increased.
39
2014–15 2018–19
Australia’s health 2020: in brief
Emergency departments are also a critical part of Australia’s health care system.
In 2018–19, there were 8.4 million
presentations to public hospital emergency
departments.
This was an average of more than 23,000 each day. Between 2014–15 and 2018–19,
the number of emergency department presentations increased by an average of
3.2% each year.
The proportion of emergency department 74% 71%
presentations ‘seen on time’ has decreased.
2014–15 2018–19
Find out more: Hospital careMost of us visited the GP in the
last year
In 2018–19, an estimated 83 % of Australians aged 15 and over
saw at least one general practitioner (GP) in the previous 12 months.
f those who saw a GP, 85% did so more than once during
O
the year.
Most commonly reported health concerns managed by GPs:
AUSTRALIA’S HEALTH SYSTEM
65% Psychological 40% Musculoskeletal 39% Respiratory
Most people reported positive experiences of health care provided by GPs:
75% felt their GPs always
listened carefully to them
76% felt their GPs spent enough time
with them in their appointments
Find out more: Primary health care; Patient experiences of health care
40
Australians access a range of allied
Australia’s health 2020: in brief
health services through Medicare
Allied health services include audiologists, chiropractors, occupational therapists,
optometrists, osteopaths, physiotherapists, podiatrists, psychologists and speech
pathologists. Some allied health services are subsidised by Medicare or private
health insurance, while others are paid for out-of-pocket by patients.
In 2017–18, 9 million people (37% of people) received 23 million Medicare-subsidised
allied health services in a non-hospital setting, up from 5.6 million people (25%) in
2008–09. Private health insurers subsidised a further 52.4 million allied health and
related services.
Most commonly used Medicare-subsidised allied health services
in 2017–18:
29% of people received optometry services—each person
received 1.3 services on average
5.1 % of people received mental health care—each person
received 4.5 services on average.
Find out more: Allied health and dental servicesAbout half of us received dental
care during the last year
In 2018–19, an estimated:
49% of Australians aged 15 and over visited a dentist,
hygienist or dental specialist in the previous
12 months
almost 3 in 5 (58%) of these people did so
AUSTRALIA’S HEALTH SYSTEM
more than once
Among people who needed to see a dental professional, around 3 in 10 (28%)
delayed or did not see one at least once in the previous 12 months. Around 2 in 10
(18%) said that cost was a reason for delaying or not seeing a dental professional.
Spending on dental services
Around $10.5 billion was spent on dental services in Australia 41
in 2017–18. The majority of this (around $6.0 billion, or 57%)
Australia’s health 2020: in brief
was paid by patients directly, with individuals spending, on
average, $243 on dental services over the 12-month period.
Private health insurance providers financed around $2.0 billion.
Who pays for dental services?
57% 19% 24%
Patients directly Private health Other
insurance
Find out more: Allied health and dental servicesPreventing the spread of
infectious disease
Most people will experience an infectious disease during their lifetime—for example, a
common cold or a stomach bug. Many infectious diseases have the potential to cause
significant illness and outbreaks. In 2019, Australian departments of health were
notified of more than 593,000 cases of notifiable communicable diseases.
In 2020, the coronavirus disease (COVID-19) pandemic posed a great potential
threat to the health of Australians. COVID-19 highlights the capacity of an infectious
disease to cause human, economic and social crisis on a global level.
AUSTRALIA’S HEALTH SYSTEM
Infectious diseases (also known as communicable diseases) are caused by
infectious agents and can be passed from one person or animal to another.
Transmission can occur directly (through contact with bodily discharge),
indirectly (for example, by sharing a drinking glass) or by means of vectors
(for example, mosquitoes).
How do we prevent the spread of disease?
42 Sanitation, prevention and treatment can drastically reduce the burden of infectious
diseases. Immunisation is a safe and effective way to largely prevent the spread of
some infectious diseases such as measles, rubella and diphtheria, which are now rare
Australia’s health 2020: in brief
in Australia. National childhood immunisation programs help to prevent the spread
of these and other dangerous diseases.
Almost 95% of 5-year-olds were fully immunised in 2019.
Most young people turning 15 in 2017 were fully immunised
against human papillomavirus (HPV):
around 80% of girls and nearly 76% of boys
Between 2005 and 2015, the burden of disease
due to vaccine preventable diseases fell by almost
one-third. This was driven by falls in diseases
with recently introduced vaccines, such as HPV.
2005 2015
Find out more: Health promotion; Immunisation and vaccination; Infectious
and communicable diseasesMore people are receiving alcohol
and drug treatment
Around 137,000 people received alcohol and other drug treatment in 2018–19,
a 19% increase since 2014–15 (115,000). This equates to a rate of 623 clients per
100,000 people in 2018–19, compared with 555 clients per 100,000 in 2014–15.
Alcohol and other drug treatment services include detoxification,
rehabilitation, counselling and pharmacotherapy, and are delivered
in residential and non-residential settings.
AUSTRALIA’S HEALTH SYSTEM
In 2018–19, people were more likely to seek treatment for alcohol use than for any
other drug. However, between 2014–15 and 2018–19, the proportion of closed
treatment episodes for alcohol fell slightly (from 38% to 36%), while the proportion
with closed treatment episodes for amphetamines increased (from 20% to 28%).
Proportion of closed treatment episodes for own drug use by select
principal drugs of concern, 2014–15 to 2018–19
Per cent 43
40
Australia’s health 2020: in brief
Alcohol
35
30
Amphetamines
25
Cannabis
20
15
10
Heroin
5
0
2014–15 2015–16 2016–17 2017–18 2018–19
Find out more: Alcohol and other drug treatment servicesYou can also read