Mapping carbon monoxide pollution from space down to city scales with daily global coverage - Atmos. Meas. Tech
←
→
Page content transcription
If your browser does not render page correctly, please read the page content below

Atmos. Meas. Tech., 11, 5507–5518, 2018
https://doi.org/10.5194/amt-11-5507-2018
© Author(s) 2018. This work is distributed under
the Creative Commons Attribution 4.0 License.

Mapping carbon monoxide pollution from space down to city scales
with daily global coverage
Tobias Borsdorff1 , Joost aan de Brugh1 , Haili Hu1 , Otto Hasekamp1 , Ralf Sussmann2 , Markus Rettinger2 ,
Frank Hase3 , Jochen Gross3 , Matthias Schneider3 , Omaira Garcia4 , Wolfgang Stremme5 , Michel Grutter5 ,
Dietrich G. Feist6 , Sabrina G. Arnold6 , Martine De Mazière7 , Mahesh Kumar Sha7 , David F. Pollard8 ,
Matthäus Kiel9 , Coleen Roehl9 , Paul O. Wennberg9,10 , Geoffrey C. Toon11 , and Jochen Landgraf1
1 SRON   Netherlands Institute for Space Research, Utrecht, the Netherlands
2 Karlsruhe Institute of Technology (KIT), IMK-IFU, Garmisch-Partenkirchen, Germany
3 Karlsruhe Institute of Technology (KIT), IMK-ASF, Karlsruhe, Germany
4 Izaña Atmospheric Research Centre (IARC), Agencia Estatal de Meteorología (AEMET), Santa Cruz de Tenerife, Spain
5 Centro de Ciencias de la Atmósfera, Universidad Nacional Autónoma de México, Mexico City, Mexico
6 Max Planck Institute for Biogeochemistry, Jena, Germany
7 Royal Belgian Institute for Space Aeronomy (BIRA-IASB), Brussels, Belgium
8 National Institute of Water and Atmospheric Research Ltd (NIWA), Lauder, New Zealand
9 Division of Geological and Planetary Sciences, California Institute of Technology, Pasadena, CA, USA
10 Division of Engineering and Applied Science, California Institute of Technology, Pasadena, CA, USA
11 Jet Propulsion Laboratory (JPL), California Institute of Technology, Pasadena, CA, USA

Correspondence: Tobias Borsdorff (t.borsdorff@sron.nl)

Received: 20 April 2018 – Discussion started: 15 May 2018
Revised: 11 September 2018 – Accepted: 26 September 2018 – Published: 9 October 2018

Abstract. On 13 October 2017, the European Space                 spectroscopy (FTS) measurements at nine ground-based sta-
Agency (ESA) successfully launched the Sentinel-5 Pre-           tions operated by the Total Carbon Column Observing Net-
cursor satellite with the Tropospheric Monitoring Instru-        work (TCCON). We found a good agreement between both
ment (TROPOMI) as its single payload. TROPOMI is the             datasets with a mean bias of 6 ppb (average of individual sta-
first of ESA’s atmospheric composition Sentinel missions,        tion biases) for both clear-sky and cloudy TROPOMI CO re-
which will provide complete long-term records of atmo-           trievals. Together with the corresponding standard deviation
spheric trace gases for the coming 30 years as a contribution    of the individual station biases of 3.8 ppb for clear-sky and
to the European Union’s Earth Observing program Coper-           4.0 ppb for cloudy sky, it indicates that the CO data product
nicus. One of TROPOMI’s primary products is atmospheric          is already well within the mission requirement.
carbon monoxide (CO). It is observed with daily global cov-
erage and a high spatial resolution of 7×7 km2 . The moderate
atmospheric resistance time and the low background concen-
tration leads to localized pollution hotspots of CO and allows   1   Introduction
the tracking of the atmospheric transport of pollution on re-
gional to global scales. In this contribution, we demonstrate    The Sentinel-5 Precursor (S5P) satellite was successfully
the groundbreaking performance of the TROPOMI CO prod-           launched on 13 October 2017, from Plesetsk in north-
uct, sensing CO enhancements above cities and industrial ar-     ern Russia with the Tropospheric Monitoring Instrument
eas and tracking, with daily coverage, the atmospheric trans-    (TROPOMI) aboard. The instrument is a grating spectrom-
port of pollution from biomass burning regions. The CO data      eter which measures sunlight reflected by the Earth’s atmo-
product is validated with two months of Fourier-transform        sphere and its surface from the ultraviolet to the shortwave
                                                                 infrared (SWIR) with daily global coverage, a spatial resolu-

Published by Copernicus Publications on behalf of the European Geosciences Union.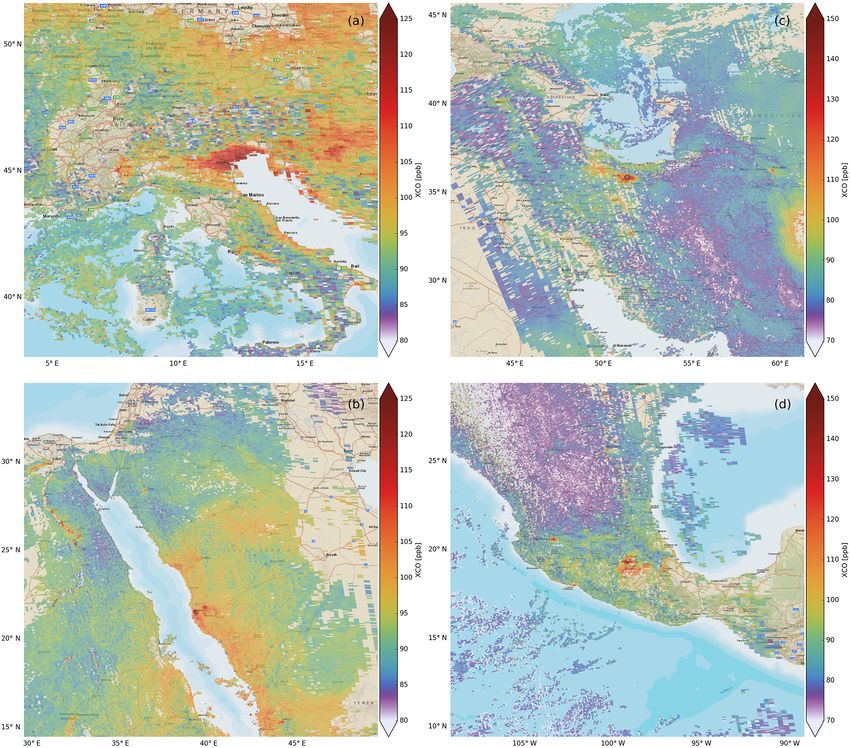
5508                                                                                       T. Borsdorff et al.: TROPOMI CO

tion of about 7 × 7 km2 , and a high radiometric accuracy to      monitor the air pollution from hotspots like larger cities and
infer the carbon monoxide (CO) total column over dark veg-        industrial regions. Investigating the temporal evolution of CO
etation surfaces with a precision of < 10 % (Veefkind et al.,     enhancements over the Atlantic and Indian oceans shows the
2012). One of the primary targets of the mission is to mon-       capability of the instrument to track the atmospheric trans-
itor the atmospheric concentration of CO. This trace gas is       port of pollution on a day-to-day basis in agreement with
emitted to the atmosphere by incomplete combustion, e.g., by      co-located ground-based measurements. Moreover, a valida-
traffic, industrial production, and biomass burning. Its major    tion with collocated ground-based Fourier-transform spec-
sink is the reaction with the OH radical (Spivakovsky et al.,     trometer (FTS) measurements at nine TCCON sites, indi-
2000). With a typical background concentration of ca. 80 ppb      cates the TROPOMI CO data quality. The paper is structured
(in the Northern Hemisphere) and an atmospheric residence         as follows: sect. 2 describes the dataset and methodology and
time from days to months (Holloway et al., 2000), the trace       Sect. 3 presents our analysis of the TROPOMI CO data prod-
gas is established as a tracer of how pollution is transported,   uct comprising a first validation with TCCON ground-based
redistributed, and depleted in the atmosphere.                    measurements, the detection of CO hotspots and the transport
   The S5P mission builds upon the heritage of SCIA-              of CO pollution over the oceans. Section 4 gives the conclu-
MACHY (Scanning Imaging Absorption Spectrometer for               sions of the study and finally the data availability is described
Atmospheric Chartography; Bovensmann et al., 1999),               in the data availability statement.
which provided atmospheric CO total column concentra-
tions from the same spectral range (Gloudemans et al., 2009;
Frankenberg et al., 2005; Buchwitz et al., 2007; Gimeno Gar-      2   Dataset and methodology
cía et al., 2011; Borsdorff et al., 2017). Measurements of
SCIAMACHY in the SWIR have a spatial resolution of about          For this study, we used nominal Earth radiance and Solar irra-
30 km × 120 km (along-track × across-track) for an integra-       diance measurements of TROPOMI during the commission-
tion time of 0.5 s with a global coverage cycle of 3 days. Most   ing phase of the instrument from 9 November 2017 to 4 Jan-
importantly, the SCIAMACHY noise error of single CO re-           uary 2018. We deployed the SICOR algorithm on the 2.3 µm
trievals can exceed 100 % for dark scenes. Therefore, spatial     spectra of TROPOMI and retrieved the total column density
and temporal averaging of single CO measurements is re-           of CO simultaneously with interfering trace gases and effec-
quired (de Laat et al., 2007; Gloudemans et al., 2006), which     tive cloud parameters (cloud height, z, and optical thickness,
limits the data interpretation of SCIAMACHY CO data.              τ ) describing the cloud contamination of the ground scene
   From space, CO is also measured by other satellite instru-     (Landgraf et al., 2016b). The retrieval approach is based on
ments with global coverage, e.g., MOPITT (Measurements            the profile scaling method (Borsdorff et al., 2014) and the
of Pollution in the Troposphere; Deeter, 2003), AIRS (At-         implementation and retrieval settings are discussed in detail
mospheric Infrared Sounder; McMillan, 2005), TES (Tropo-          by Landgraf et al. (2016a). The reference profile of CO that
spheric Emission Spectrometer; Rinsland et al., 2006), IASI       is scaled during the retrieval is taken from simulations of the
(Infrared Atmospheric Sounding Interferometer; Turquety           global chemical transport model TM5 (Krol et al., 2005) and
et al., 2004). The S5-P mission is the first of a sequence of     monthly averaged over 3◦ × 2◦ latitude and longitude grid
the European Space Agency’s (ESA) atmospheric composi-            boxes. Therefore, the retrieval result is the total column den-
tion satellites, which also comprises the Sentinel-5 mission, a   sity of CO [molec cm−2 ]. To compare it with other measure-
series of spectrometers with the first launch in the 2021–2023    ments we also represent the data product as a dry column
time frame.                                                       mixing ratio XCO [ppb] by dividing the CO total column
   In this study, we use the Shortwave Infrared CO Retrieval      density by the dry air column density derived from co-located
Algorithm (SICOR). It is developed by SRON (the Nether-           ECMWF pressure fields.
lands Institute for Space Research), for the operational pro-         For the data analysis, we performed a posteriori quality
cessing of TROPOMI data (Landgraf et al., 2016a, b) and           filtering of the TROPOMI data. To this end, we used re-
also serves as algorithm baseline for the data processing         trievals with a solar zenith angle < 80◦ and discarded the
of the successor mission Sentinel 5. The algorithm infers         two most westward ground pixels of the swath due to a per-
the vertical column concentration of CO (the vertically inte-     formance issue that is still under investigation. Furthermore,
grated amount of CO above the surface) simultaneously with        we distinguished between retrievals under clear-sky (τ < 0.5
effective cloud parameters from TROPOMI’s 2.3 µm spectra          and z < 5 km, over land) and cloudy condition (τ > 0.5 and
(Vidot et al., 2012; Landgraf et al., 2016b). A first compari-    z < 5 km, over land and ocean). The remaining retrievals
son of the TROPOMI CO data product with CO fields from            are not considered in this study. Clear-sky observations over
the European Center for Medium-Range Weather Forecast             ocean, which is a dark surface in the SWIR, cannot be used
(ECMWF) was performed by Borsdorff et al. (2018a). Based          for data interpretation because of a too low signal.
on this, our study deploys SICOR on TROPOMI measure-                  For the total column of CO, the vertical sensitivity of the
ments taken during the early months of the instrument in or-      retrieval is described by the total column averaging kernel
bit, and show the capability of the instrument to detect and      (Borsdorff et al., 2014), which is illustrated in Fig. 1 for

Atmos. Meas. Tech., 11, 5507–5518, 2018                                             www.atmos-meas-tech.net/11/5507/2018/

T. Borsdorff et al.: TROPOMI CO                                                                                                   5509

                                                                        ror is due to imperfect knowledge of the vertical profile of
                                                                        CO. However, the TROPOMI CO dataset provides total col-
                                                                        umn averaging kernels acol for each retrieval. To compare a
                                                                        vertical profile ρ, e.g., from airborne in situ measurements
                                                                        or model simulations with the TROPOMI CO product a to-
                                                                        tal column concentration c = acol ρ can be calculated from
                                                                        ρ. This can be directly compared with the retrieval result
                                                                        as it is affected in the same way by the reduced sensitivity
                                                                        as the retrieval (Rodgers and Connor, 2003). When the ref-
                                                                        erence measurement is not a vertical profile the application
                                                                        of the total column averaging kernel becomes more difficult.
                                                                        In that case, the TROPOMI CO dataset can be filtered for
                                                                        retrievals under clear-sky conditions to avoid misinterpreta-
                                                                        tions. Alternatively, an approach as presented by Cogan et al.
                                                                        (2012) can be followed who quantified expected differences
                                                                        in GOSAT/TCCON CO2 retrievals due to averaging kernel
                                                                        differences using the GEOS-Chem model to simulate a real-
                                                                        istic range of CO2 profiles.
                                                                           The TROPOMI instrument is still in the early phase of
                                                                        the mission and the performance of the CO retrieval is ex-
Figure 1. TROPOMI CO total column averaging kernels for
                                                                        pected to improve in the future. For example, single over-
10 November 2017. The global average is shown for three differ-
ent categories of cloudiness strict cloud clearing (black), clear-sky   passes show stripes of erroneous CO in flight direction, prob-
equivalent (yellow), and high optical thick clouds (blue). The stan-    ably due to calibration issues of TROPOMI. Considering
dard deviation is indicated as error bars.                              high-frequency variations of CO measurements across flight
                                                                        direction per orbit, we infer the stripe pattern by median fil-
                                                                        tering of the detected features in flight direction per orbit.
TROPOMI data of one particular day, 10 November 2017. It                Figure 2 provides an example, where the average the aver-
shows the dependence of the averaging kernel on the cloudi-             age of the stripe pattern in cross flight direction is −0.03 ppb
ness of the scene, where the standard deviation indicates its           with a standard deviation of 1.1 ppb. Some stripes can reach
variation due to different observation and atmospheric pa-              values higher than 5 ppb. Therefore, the stripe pattern can be
rameters, e.g., solar zenith angle, viewing zenith angle and            removed from the data a posteriori to the retrieval and its
ground reflectivity. For very strict cloud clearing of the data         removal is indicated accordingly in the remainder of the pa-
(with z < 5 km and τ < 0.01), the total column averaging                per. Boersma et al. (2011) suggested a similar approach to
kernel is close to 1 for all altitudes with little variation, mean-     improve the quality of the NO2 data product of the Ozone
ing that the derived column can be interpreted as an esti-              Monitoring Instrument (OMI, Levelt et al., 2006).
mate of vertically integrated amount of CO. Filtering the data
less strict using the clear-sky filter from above (z < 5 km
and τ < 0.5) results in a slightly reduced sensitivity with a           3     Results
moderate standard deviation and Borsdorff et al. (2017) con-
cluded that those measurements are usually clear-sky equiv-             3.1    Validation with TCCON ground-based
alent for remote regions without local pollution sources and                   measurements
the induced errors due to the choice of the reference profile to
be scaled by the inversion to be on a percentage level (Bors-           The quality of the TROPOMI CO data product needs to be
dorff et al., 2014). The presence of clouds changes signifi-            validated with independent reference observations both for
cantly the vertical sensitivity of the retrieval. Figure 1 shows        clear-sky and cloudy TROPOMI measurements. To this end,
the column averaging kernel when filtering for optical thick            we performed a first validation with CO observations at nine
clouds at 5 km altitude. The sensitivity below the cloud is sig-        ground-based FTS stations operated by the TCCON network
nificantly reduced (values lower than 1) due to cloud shield-           (see Table 1) which are located preferably at remote areas.
ing, and the retrieval estimates a CO total column mainly                  TCCON is a network of ground-based Fourier-transform
based on the measurement sensitivity to CO above the cloud              spectrometers to measure total column concentrations of
(values higher than 1).                                                 atmospheric trace gases including CO with high accuracy
   Consequently, the direct comparison of reference mea-                and precision, e.g., for satellite validation. The trace gas
surements with the retrieved CO columns from cloud con-                 columns are retrieved from spectrally highly resolved near-
taminated TROPOMI measurements can lead to errors >                     infrared radiance measurements recorded in direct-sun ge-
30 % (Borsdorff et al., 2014). This so called smoothing er-             ometry (Wunch et al., 2015). Cloud contaminated measure-

www.atmos-meas-tech.net/11/5507/2018/                                                     Atmos. Meas. Tech., 11, 5507–5518, 2018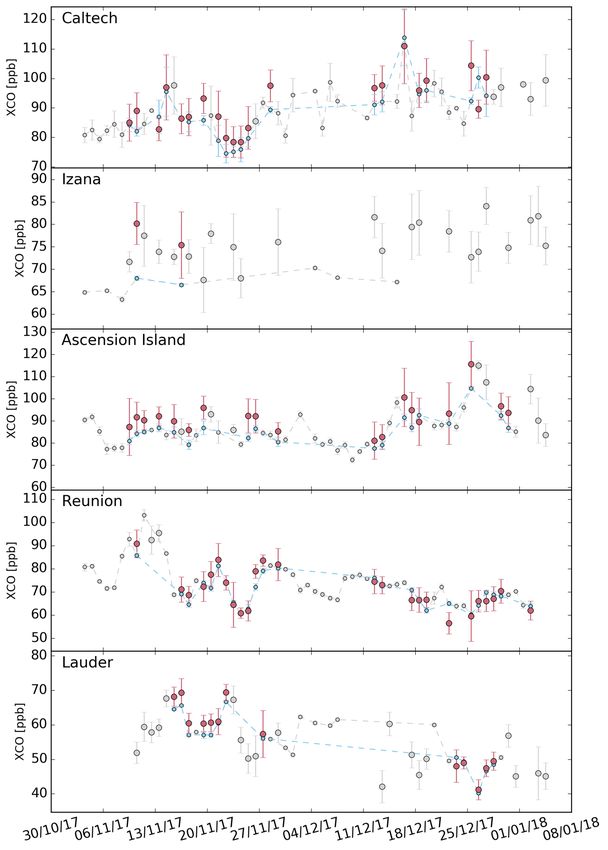
5510                                                                                            T. Borsdorff et al.: TROPOMI CO

Figure 2. Stripe pattern derived by median filtering from a TROPOMI CO orbit above Saudi Arabia and Egypt on 12 November 2017.

Table 1. Ground-based FTS stations used for validation. The lati-          We selected sites in both the Northern and Southern Hemi-
tude and longitude values are given in degrees, the surface elevation   sphere at low and high elevation on the continents and islands
in km.                                                                  (Hase et al., 2015; Sussmann and Rettinger, 2014; Wennberg
                                                                        et al., 2016, 2015; Blumenstock et al., 2014; Feist et al.,
 Name                Latitude   Longitude     Altitude   Type
                                                                        2014; De Mazière et al., 2014; Sherlock et al., 2014). Wunch
 Karlsruhe              49.10        8.44         0.11   TCCON          et al. (2015) reported that the total error of the XCO columns
 Garmisch               47.48       11.06         0.75   TCCON          measured by TCCON is below 4 %. This also includes an
 Zugspitze              47.42       10.98         2.96   TCCON          estimation of the smoothing error that is about 1 % for the
 JPL                    34.20     −118.18         0.39   TCCON
                                                                        TCCON CO product. The magnitude of the smoothing error
 Caltech                34.14     −118.13         0.24   TCCON
 Izaña                  28.31      −16.50         2.37   TCCON          was assessed by changing the shape of the reference profile
 Mexico City            19.33      −99.18         2.26   Bruker         used for the TCCON scaling retrieval. Within this error mar-
                                                         Vertex 80      gin we can assume the TCCON measurements as an estimate
 Ascension Island      −7.92       −14.33         0.03   TCCON          of the truth.
 Réunion              −20.90        55.49         0.09   TCCON             For the comparison, we used TROPOMI observations co-
 Lauder               −45.04       169.68         0.37   TCCON          located with the TCCON sites by selecting all TROPOMI
                                                                        retrievals from the same day within a radius of 50 km around
                                                                        each station. The retrieved CO column of TROPOMI is
ments are rejected and so TCCON measurements refer to                   adapted to the altitude of the station by either cutting off
clear-sky observations only. Here, TCCON CO columns are                 the scaled mixing ratio profile at the station altitude or ex-
provided as column averaged dry air mole fractions XCO                  tending it assuming a constant elongation of the mixing ratio
(Wunch et al., 2010).                                                   to lower altitude. For mountain stations like Zugspitze and

Atmos. Meas. Tech., 11, 5507–5518, 2018                                                  www.atmos-meas-tech.net/11/5507/2018/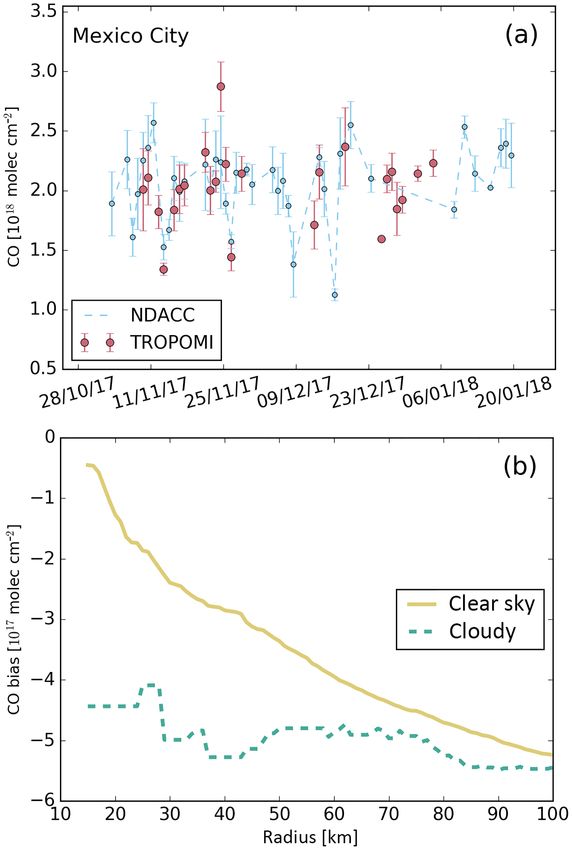
T. Borsdorff et al.: TROPOMI CO                                                                                                 5511

Izana, this reduces the TROPOMI CO column on average by
10 and 4 ppb, respectively, improving the agreement between
the ground-based and satellite measurements accordingly. Fi-
nally, we calculated daily averages of the XCO values using
the adapted TROPOMI retrievals and the TCCON measure-
ments shown in Figs. 3 and 4. Data gaps in the TROPOMI
time series are partly caused by discarding observations with
high clouds (> 5 km) but also due to observation time re-
served for in-orbit instrument characterization during the in-
strument commissioning phase.
   Figure 5 depicts the corresponding bias for each TC-
CON station for clear-sky and cloudy-sky conditions and the
combination of both, as well as the standard deviation and
the number of coincident daily mean values of TROPOMI
and TCCON. With the limited data available at the time of
writing, we found good agreement with a small mean bias
of TROPOMI CO versus TCCON of 6.0 ppb for clear-sky,
6.2 ppb for cloudy-sky TROPOMI retrievals and 5.8 ppb for
the combination of both with a standard deviation of the in-
dividual station biases of 3.8 ppb for clear sky, 4.0 ppb for
cloudy sky, and 3.4 ppb for the combination case. Further-
more, the mean standard deviation of the bias is 3.9 ppb for
clear-sky, 2.4 ppb for cloud-sky, and 2.9 ppb for the combi-
nation. The good agreement between clear-sky and cloudy-
sky retrieval underlines the validity of the data retrieval for
cloudy scenes, a key aspect of the SICOR algorithm to
achieve the data coverage of the TROPOMI CO product.
   Most of the TCCON stations are only affected by remote
pollution sources, this explains the good agreement between
the validation of the clear-sky and cloudy-sky TROPOMI re-        Figure 3. Daily means of dry air column mixing ratios (XCO) mea-
trievals. This may differ in the presence of local pollution      sured by TROPOMI (pink) and various TCCON stations (blue). A
sources where the shape of the under-cloud CO profile can         co-location radius of 50 km is used. The standard deviation of indi-
strongly deviate from the one of the reference profile used       vidual retrievals within a day is shown as an error bar. Data points
for the profile scaling of the TROPOMI CO dataset. In such        without time coincidence between TCCON and TROPOMI are plot-
cases, when the TROPOMI CO dataset is directly compared           ted in grey. No de-striping was applied on the TROPOMI data.
with reference measurements without applying the averaging
kernel, clear-sky are always preferable compared to cloudy-
sky observations.                                                 air mixing ratio from the surrounding background concentra-
                                                                  tions in the order of 100 ppb (Pommier et al., 2013; Clerbaux
3.2   Detection of CO hotspots                                    et al., 2008; Borsdorff et al., 2018b).
                                                                     In this respect, the CO measurements by TROPOMI repre-
Today’s work and life style supports urbanization and the         sent a breakthrough. The advanced radiometric performance
rise of metropolitan areas all over the world with popula-        combined with the high spatial resolution and the daily
tions exceeding more than 10 million people. Intense traffic      global coverage of TROPOMI allows the sensing of CO en-
and industrial activities in those regions lead to high levels    hancements above polluted areas with only single satellite
of air pollution affecting human health. For example, at rush     overpasses, given the perspective of day-to-day monitoring.
hour in Mexico City the CO concentration has reached val-         For example, Fig. 6a shows enhanced CO values over the in-
ues as high as 9300 ppb (Stephens et al., 2008). Sensing air      dustrial area near to Venice as well as pollution above Turin,
pollution from space has the potential to globally monitor        Milan, and Rome. Figure 6b depicts an orbit overpass over
trends and variations of atmospheric pollutants affecting hu-     Saudi Arabia and Egypt and shows distinct pollution patterns
man health. The detection of air pollution above cities, urban    over Mecca, Jeddah and Cairo. Furthermore, enhanced CO
and industrial areas with satellites comes with the challenge     values along the Nile indicate air pollution in this densely
of low CO sensitivity of measurements. Until now, data needs      populated region. Figure 6c clearly shows the enhanced CO
to be temporally and spatially averaged to distinguish typical    values above Tehran, in agreement with the urban area of
the CO enhancements of ≤ 20 ppb of the total column dry           the city. Also smaller cities in the region like Qom, Isfa-

www.atmos-meas-tech.net/11/5507/2018/                                                Atmos. Meas. Tech., 11, 5507–5518, 2018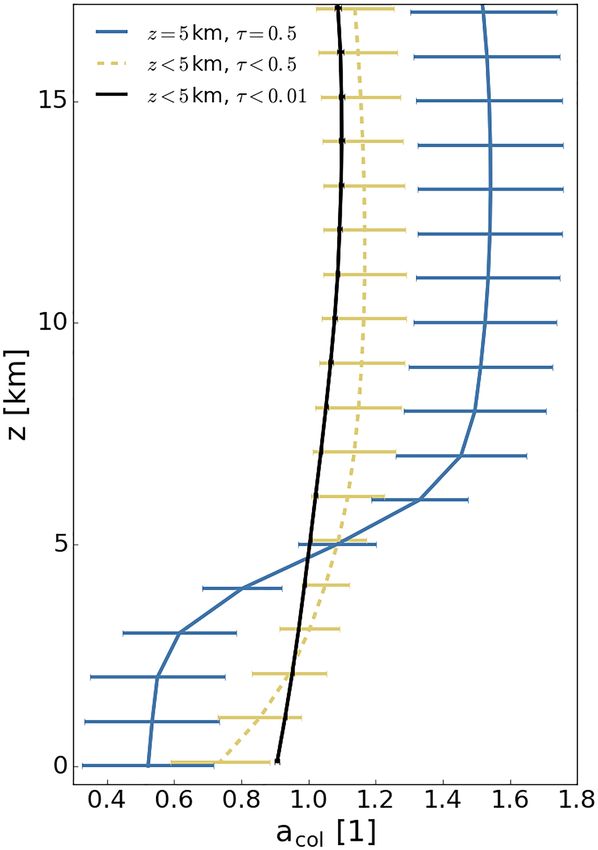
5512                                                                                       T. Borsdorff et al.: TROPOMI CO

                                                                 Figure 5. Mean bias (TROPOMI – FTS) between co-located daily
                                                                 mean XCO values (see Figs. 3, 4) of TROPOMI and TCCON (a),
Figure 4. As Fig. 3 but with different TCCON stations.           the standard deviation of the bias (b), and the number of coincident
                                                                 daily mean pairs (c). b is the global mean bias (average of all sta-
                                                                 tion biases) and σ its standard deviation. SD is the average of all
han, and Mashhad can be distinguished from the background        standard deviations and n the average number of coincident pairs.
CO level. Finally, Fig. 6d shows strong CO enhancements          TROPOMI retrievals under clear sky (yellow), cloudy sky (blue)
above Mexico City, Guadalajara, Torreón, and Monterrey.          and the combination of both (pink) are distinguished. No de-striping
Data gaps in the figures are caused by the filtering of mea-     was applied on the TROPOMI data.
surements under clear-sky conditions over the oceans and
measurements contaminated by high-altitude clouds. Fig-
ure 6 shows predominately clear-sky observations but also        et al., 2017) when selecting clear-sky satellite observations
includes retrievals from cloud contaminated scenes, which in     of the same day, which are spatially co-located in a radius of
case of optical thick and high clouds reduces the sensitivity    15 km around the ground site. Figure 7b indicates that this
to boundary layer CO pollution at emission hotspots (Bors-       data screening is essential for the detection of pollution on
dorff et al., 2018b). Neither temporal nor spatial averaging     city scales. Choosing a wider co-location radius for the satel-
is necessary to distinguish the CO enhancements of the total     lite data leads to a significant bias with the FTS measure-
column above the shown point sources. The average noise er-      ments, which demonstrates the importance of TROPOMI’s
ror of the retrievals from the individual ground pixels shown    spatial resolution for this type of application keeping repre-
in Fig. 6 is < 2.3 ppb.                                          sentation errors between ground-based and satellite observa-
   The daily global coverage of TROPOMI and so the tem-          tions to a minimum. It is important to realize that the com-
poral evolution of air pollution on city scales opens up new     parison with measurements at TCCON sites, as discussed in
possibilities to monitor the effect of emission regulations      the previous subsection, are mostly not affected by localized
but also requires estimates of the absolute uncertainty of the   CO emissions and so allow for a looser spatial collocation
TROPOMI CO product. Figure 7a shows that the TROPOMI             criterion with a collocation radius of 50 km.
CO concentrations are in good agreement with ground-based           Furthermore, selecting TROPOMI CO observations for
measurements of a Fourier-transform spectrometer (FTS) in        cloudy conditions leads to a 25 % (5×10¹⁷ molec cm−2 ) bias
Mexico City (Stremme et al., 2009, 2013; Plaza-Medina            independent from the selected radius. Due to light shielding

Atmos. Meas. Tech., 11, 5507–5518, 2018                                             www.atmos-meas-tech.net/11/5507/2018/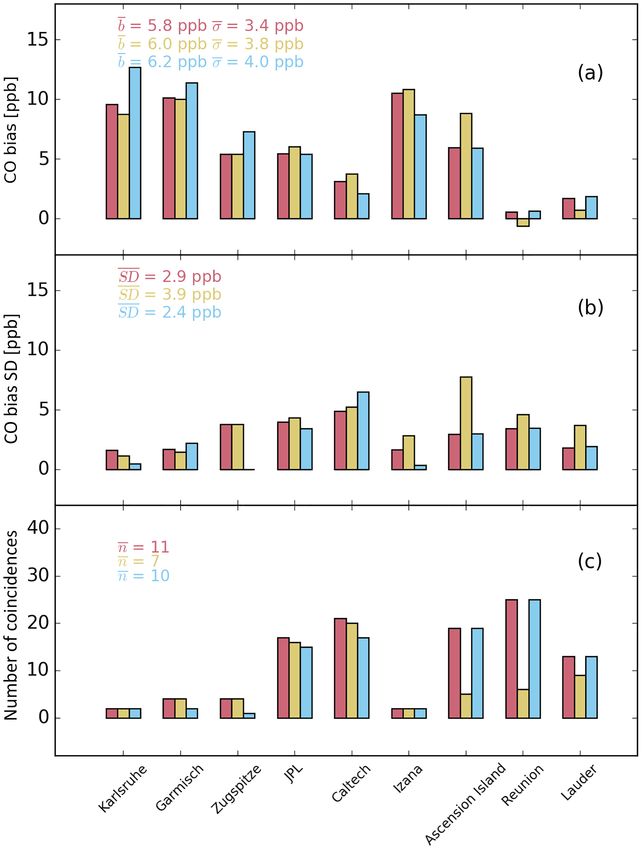
T. Borsdorff et al.: TROPOMI CO                                                                                                  5513

Figure 6. Total column mixing ratio (XCO) for individual TROPOMI ground pixels for (a) Italy on 25 December, (b) Saudi Arabia and Egypt
on 12 November 2017, (c) Iran on 17 November 2017, and (d) Mexico on 25 November 2017. De-striping was applied on the TROPOMI
data.

by clouds, the satellite measurements become insensitive to           3.3   Monitoring pollution transport
the lower atmosphere where most of the pollution is located
(Borsdorff et al., 2014) and so the TROPOMI CO product
estimates the CO column from the less polluted air above              For several years, measurements of CO have been used to
the cloud. This apparent disadvantage of cloudy observations          trace the transport of polluted air masses within the at-
turns into an advantage when analyzing the vertical distribu-         mosphere, mostly with the focus on long-range transport.
tion of trace gases (Borsdorff et al., 2018b). By observing the       The atmospheric residence time of CO varies from days to
same pollution event for clear-sky conditions and for varying         months (Holloway et al., 2000) and so it is well suited to
cloud height, it reveals the vertical extension of the city pol-      capture advection of atmospheric pollution. For example,
lution into the atmosphere.                                           Gloudemans et al. (2006) studied the transport of CO emis-
                                                                      sion by biomass burning in the Southern Hemisphere us-
                                                                      ing SCIAMACHY observations and Yurganov et al. (2004,
                                                                      2005) analyzed the anomaly in the CO burden of the North-

www.atmos-meas-tech.net/11/5507/2018/                                                   Atmos. Meas. Tech., 11, 5507–5518, 2018
5514 T. Borsdorff et al.: TROPOMI CO
ment with regular ground-based FTS measurements of a To-
tal Carbon Column Observing Network (TCCON) station on
the island (Feist et al., 2014). With the help of TROPOMI
measurements the localized ground-site measurements can
be put into a regional context. Another example is given in
Fig. 8d–f. On 10 November, biomass burning in Africa and
Madagascar caused an extended plume of enhanced CO con-
centrations reaching the island of Réunion. The atmospheric
situation stayed stable until 12 November (90–103 ppb), but
changed to low CO concentration on the 16 November due
to different meteorology (70 ppb). Figure 4 (fourth panel)
shows an excellent agreement with TCCON measurements
on the island (De Mazière et al., 2014) and thus illustrates
the extra information provided by the satellite product in ad-
dition to the ground-based measurement.
4 Conclusions
The CO observations of TROPOMI represent a major step
forward for the monitoring of air pollution from space. In
this study we investigated the quality of the CO data prod-
uct applying the operational retrieval software to the first two
months of data of the S5-P mission in space. As only a small
fraction of all TROPOMI observations are expected to be
cloud free (Krijger et al., 2005), it is essential to account for
Figure 7. (a) Mexico City daily mean CO columns from TROPOMI clouds in the retrieval. Building on previous work (Gloude-
(pink) and FTS (blue) with standard deviation of the individual mans et al., 2009; Buchwitz et al., 2006; Vidot et al., 2012),
retrievals (errors). TROPOMI observations are filtered for clear- an important feature of the TROPOMI CO retrieval is to infer
sky within 15 km around the ground site. The TROPOMI columns cloud parameters and trace gas columns at the same time to
are altitude corrected to the station elevation. (b) Bias of the CO achieve a good yield from the data processing. Thereby, we
columns (TROPOMI – FTS) as function of the co-location ra- account for the vertical sensitivity of cloudy measurements
dius around Mexico City. Here, TROPOMI retrievals under clear-
and enhance the data yield both for observations over land
sky conditions (yellow) and optically thick clouds above 4000 m
and ocean (Borsdorff et al., 2017, 2016). On average, 8 %
(green) are considered. For the smallest radius (15 km) we found 20
cloudy and 160 clear-sky collocations. However, for the widest ra- of all measurements are clear-sky, 22 % cloudy-sky observa-
dius (100 km) 92 cloudy and 4425 clear-sky collocations are found. tions over land, and 51 % cloud-sky over the oceans.
No de-striping was applied on the TROPOMI data. A first validation of the TROPOMI CO data product with
collocated TCCON observations at nine selected measure-
ment sites showed good agreement with a mean bias of about
6 ppb for both clear-sky and cloudy observations and a mean
ern Hemisphere caused by biomass burning with ground-
standard deviation of 3.9 and 2.4 ppb, respectively, demon-
based and satellite measurements.
strating a good repeatability of the observations. Here, the
The TROPOMI CO dataset will advance this research field
standard deviation of the station biases is 3.8 and 4.0 ppb for
by providing the global distribution of the atmospheric CO
both types of measurements. Additionally, a comparison with
concentration on a daily basis with high spatial resolution.
ground-based FTS at Mexico shows that the CO pollution
It enables us to study the day-to-day variation of CO on
hotspot can be observed with high accuracy. For this study,
global, regional and local scales. As an example, Fig. 8a–c
only a limited amount of TCCON data were available with
present TROPOMI CO for three subsequent days depicting
confined spatial and temporal coverage. The Sentinel 5 Pre-
the southward transport of enhanced CO concentrations over
cursor as an operational mission requires a continuous mon-
the Atlantic Ocean originating from fires in North Africa. On
itoring of the CO data quality, which will be performed as
13 December 2017, Ascension Island is surrounded by air
part of the operational validation activities. In this context,
with low CO concentrations (80 ppb) but already a few days
future work will consider the validation of the TROPOMI
later, on 17 December, the first enhanced CO values reach
CO data for longer time scales including additional TCCON
the island. Finally on 25 December, Ascension Island is ex-
and NDACC stations to improve the significance of the prod-
posed to strong CO polluted air with values up to 116 ppb.
uct validation.
Figure 4 (third panel) shows that this finding is in agree-
Atmos. Meas. Tech., 11, 5507–5518, 2018 www.atmos-meas-tech.net/11/5507/2018/T. Borsdorff et al.: TROPOMI CO 5515 Figure 8. Total column mixing ratio (XCO) for individual TROPOMI ground pixels near Ascension Island on (a) 13 December 2017, (b) 17 December 2017, and (c) 25 December 2017 and near Réunion on (d) 10 November 2017, (e) 12 November 2017, and (f) 17 November 2017. De-striping was applied on the TROPOMI data. www.atmos-meas-tech.net/11/5507/2018/ Atmos. Meas. Tech., 11, 5507–5518, 2018
5516                                                                                              T. Borsdorff et al.: TROPOMI CO

   Due to the good data quality, in combination with the                were made by the projects CONACYT (nos. 275239 and 239618)
spatial resolution of 7 × 7 km2 , TROPOMI can capture the               and UNAM-DGAPA-PAPIIT (nos. IN112216 and IN111418).
variability of CO due to atmospheric transport of pollution             Alfredo Rodrigez, Miguel Angle Robles, Delibes Flores Roman,
on a day-to-day basis, demonstrated for daily overpasses at             Wilfrido Gutiérrez, and Alejandro Bezanilla are acknowledged for
Ascension Island and Reunion in agreement with TCCON                    technical support. This research has been funded in part by the
                                                                        TROPOMI national program from the NSO. The TROPOMI data
observations at these sites. Based on these preliminary re-
                                                                        processing was carried out on the Dutch national e-infrastructure
sults, we conclude that the TROPOMI CO product already                  with the support of the SURF Cooperative. The operation of the
fulfills the mission requirements on precision (< 10 %) and             Ascension Island TCCON site was funded by the Max Planck
accuracy (< 15 %) (Veefkind et al., 2012), assuming a back-             Society.
ground concentration of 100 ppb.
                                                                        Edited by: Helen Worden
                                                                        Reviewed by: two anonymous referees
Data availability. The TROPOMI CO data set of this study is avail-
able for download at https://www.sron.nl/data (SRON, 2018). TC-
CON data are available from the TCCON Data Archive, hosted
by CaltechDATA, California Institute of Technology, CA (US),            References
https://tccondata.org/ (TCCONnetwork, 2018). The TROPOMI CO
data are available via the Copernicus Open Access Hub https:            Blumenstock, T., Hase, F., Schneider, M., Garcia, O. E., and
//s5phub.copernicus.eu.                                                   Sepulveda, E.: TCCON data from Izana (ES), Release
                                                                          GGG2014.R0, TCCON Data Archive, hosted by CaltechDATA,
                                                                          https://doi.org/10.14291/tccon.ggg2014.izana01.R0/1149295,
Author contributions. TB, JadB, HH, and OH did the TROPOMI                2014.
CO retrieval and data analysis. RS, MR, FH, JG, MS, OG, WS,             Boersma, K. F., Eskes, H. J., Dirksen, R. J., van der A, R. J.,
MG, DGF, SGA, MDM, MKS, DFP, MK, CR, POW, and GCT per-                    Veefkind, J. P., Stammes, P., Huijnen, V., Kleipool, Q. L., Sneep,
formed FTS measurements and retrievals for the various stations.          M., Claas, J., Leitão, J., Richter, A., Zhou, Y., and Brunner, D.:
JL supervised the study. All authors discussed the results and com-       An improved tropospheric NO2 column retrieval algorithm for
mented on the manuscript.                                                 the Ozone Monitoring Instrument, Atmos. Meas. Tech., 4, 1905–
                                                                          1928, https://doi.org/10.5194/amt-4-1905-2011, 2011.
                                                                        Borsdorff, T., Hasekamp, O. P., Wassmann, A., and Landgraf,
                                                                          J.: Insights into Tikhonov regularization: application to trace
Competing interests. The authors declare that they have no conflict
                                                                          gas column retrieval and the efficient calculation of total
of interest.
                                                                          column averaging kernels, Atmos. Meas. Tech., 7, 523–535,
                                                                          https://doi.org/10.5194/amt-7-523-2014, 2014.
                                                                        Borsdorff, T., Tol, P., Williams, J. E., de Laat, J., aan de Brugh,
Disclaimer. The presented work has been performed in the                  J., Nédélec, P., Aben, I., and Landgraf, J.: Carbon monoxide to-
frame of the Sentinel-5 Precursor Validation Team (S5PVT) or              tal columns from SCIAMACHY 2.3 µm atmospheric reflectance
Level 1/Level 2 Product Working Group activities. Results are             measurements: towards a full-mission data product (2003–2012),
based on preliminary (not fully calibrated/validated) Sentinel-5 Pre-     Atmos. Meas. Tech., 9, 227–248, https://doi.org/10.5194/amt-9-
cursor data that will still change.                                       227-2016, 2016.
                                                                        Borsdorff, T., aan de Brugh, J., Hu, H., Nédélec, P., Aben,
                                                                          I., and Landgraf, J.: Carbon monoxide column retrieval for
Acknowledgements. We would like to thank the team that created            clear-sky and cloudy atmospheres: a full-mission data set
the TROPOMI instrument, consisting of the partnership between             from SCIAMACHY 2.3 µm reflectance measurements, Atmos.
Airbus Defense and Space, KNMI, SRON and TNO, and commis-                 Meas. Tech., 10, 1769–1782, https://doi.org/10.5194/amt-10-
sioned by the Netherlands Space Office (NSO) and the European             1769-2017, 2017.
Space Agency (ESA). In particular, we acknowledge Ilse Aben             Borsdorff, T., de Brugh, J. A., Hu, H., Aben, I., Hasekamp,
and Ruud Hoogeveen, the SRON L1 team. Sentinel-5 Precursor                O., and Landgraf, J.: Measuring Carbon Monoxide With
is part of the EU Copernicus program. Sentinel-5 Precursor is an          TROPOMI: First Results and a Comparison With ECMWF-
ESA mission on behalf of the European Commission (EC). The                IFS Analysis Data, Geophys. Res. Lett., 45, 2826–2832,
TROPOMI payload is a joint development by ESA and the NSO.                https://doi.org/10.1002/2018GL077045, 2018a.
The Sentinel-5 Precursor ground-segment development has been            Borsdorff, T., Andrasec, J., aan de Brugh, J., Hu, H., Aben, I.,
funded by ESA and with national contributions from the Nether-            and Landgraf, J.: Detection of carbon monoxide pollution from
lands, Germany, and Belgium. The TCCON site at Réunion Island             cities and wildfires on regional and urban scales: the benefit of
is operated by the Royal Belgian Institute for Space Aeronomy with        CO column retrievals from SCIAMACHY 2.3 µm measurements
financial support in 2014, 2015, 2016, 2017, and 2018 under the EU        under cloudy conditions, Atmos. Meas. Tech., 11, 2553–2565,
project ICOS-Inwire, the ministerial decree for ICOS (FR/35/IC2),         https://doi.org/10.5194/amt-11-2553-2018, 2018b.
and local activities supported by LACy/UMR8105 – Université             Bovensmann, H., Burrows, J. P., Buchwitz, M., Frerick, J., Noël,
de La Réunion. The Belgian co-authors are also supported by the           S., Rozanov, V. V., Chance, K. V., and Goede, A. P. H.:
PRODEX TROVA project. The measurements in Mexico City                     SCIAMACHY: Mission Objectives and Measurement Modes,

Atmos. Meas. Tech., 11, 5507–5518, 2018                                                    www.atmos-meas-tech.net/11/5507/2018/
T. Borsdorff et al.: TROPOMI CO 5517 J. Atmos. Sci., 56, 127–150, https://doi.org/10.1175/1520- M. M. P., and Aben, I.: Evidence for long-range trans- 0469(1999)0562.0.co;2, 1999. port of carbon monoxide in the Southern Hemisphere from Buchwitz, M., de Beek, R., Noël, S., Burrows, J. P., Bovens- SCIAMACHY observations, Geophys. Res. Lett., 33, L16807, mann, H., Schneising, O., Khlystova, I., Bruns, M., Bremer, H., https://doi.org/10.1029/2006gl026804, 2006. Bergamaschi, P., Körner, S., and Heimann, M.: Atmospheric Gloudemans, A. M. S., de Laat, A. T. J., Schrijver, H., Aben, I., carbon gases retrieved from SCIAMACHY by WFM-DOAS: Meirink, J. F., and van der Werf, G. R.: SCIAMACHY CO version 0.5 CO and CH4 and impact of calibration improve- over land and oceans: 2003–2007 interannual variability, Atmos. ments on CO2 retrieval, Atmos. Chem. Phys., 6, 2727–2751, Chem. Phys., 9, 3799–3813, https://doi.org/10.5194/acp-9-3799- https://doi.org/10.5194/acp-6-2727-2006, 2006. 2009, 2009. Buchwitz, M., Khlystova, I., Bovensmann, H., and Burrows, J. P.: Hase, F., Blumenstock, T., Dohe, S., Gross, J., and Three years of global carbon monoxide from SCIAMACHY: Kiel, M.: TCCON data from Karlsruhe (DE), Release comparison with MOPITT and first results related to the detec- GGG2014.R1, TCCON Data Archive, hosted by CaltechDATA, tion of enhanced CO over cities, Atmos. Chem. Phys., 7, 2399– https://doi.org/10.14291/tccon.ggg2014.karlsruhe01.R1/1182416, 2411, https://doi.org/10.5194/acp-7-2399-2007, 2007. 2015. Clerbaux, C., Edwards, D. P., Deeter, M., Emmons, L., Lamar- Holloway, T., Levy, H., and Kasibhatla, P.: Global distribution of que, J.-F., Tie, X. X., Massie, S. T., and Gille, J.: Carbon carbon monoxide, J. Geophys. Res.-Atmos., 105, 12123–12147, monoxide pollution from cities and urban areas observed by https://doi.org/10.1029/1999jd901173, 2000. the Terra/MOPITT mission, Geophys. Res. Lett., 35, L03817, Krijger, J. M., Aben, I., and Schrijver, H.: Distinction between https://doi.org/10.1029/2007GL032300, 2008. clouds and ice/snow covered surfaces in the identification of Cogan, A. J., Boesch, H., Parker, R. J., Feng, L., Palmer, P. I., cloud-free observations using SCIAMACHY PMDs, Atmos. Blavier, J.-F. L., Deutscher, N. M., Macatangay, R., Notholt, J., Chem. Phys., 5, 2729–2738, https://doi.org/10.5194/acp-5-2729- Roehl, C., Warneke, T., and Wunch, D.: Atmospheric carbon 2005, 2005. dioxide retrieved from the Greenhouse gases Observing SATel- Krol, M., Houweling, S., Bregman, B., van den Broek, M., Segers, lite (GOSAT): Comparison with ground-based TCCON obser- A., van Velthoven, P., Peters, W., Dentener, F., and Bergamaschi, vations and GEOS-Chem model calculations, J. Geophys. Res.- P.: The two-way nested global chemistry-transport zoom model Atmos., 117, D21301, https://doi.org/10.1029/2012JD018087, TM5: algorithm and applications, Atmos. Chem. Phys., 5, 417– 2012. 432, https://doi.org/10.5194/acp-5-417-2005, 2005. Deeter, M. N.: Operational carbon monoxide retrieval algorithm and Landgraf, J., aan de Brugh, J., Borsdorff, T., Houweling, S., and selected results for the MOPITT instrument, J. Geophys. Res., Hasekamp, O.: Algorithm Theoretical Baseline Document for 108, 4399, https://doi.org/10.1029/2002jd003186, 2003. Sentinel-5 Precursor: Carbon Monoxide Total Column Retrieval, de Laat, A. T. J., Gloudemans, A. M. S., Aben, I., Krol, M., Meirink, Atbd, SRON, Sorbonnelaan 2, 3584 CA Utrecht, the Nether- J. F., van der Werf, G. R., and Schrijver, H.: Scanning Imaging lands, 2016a. Absorption Spectrometer for Atmospheric Chartography carbon Landgraf, J., aan de Brugh, J., Scheepmaker, R., Borsdorff, T., Hu, monoxide total columns: Statistical evaluation and comparison H., Houweling, S., Butz, A., Aben, I., and Hasekamp, O.: Car- with chemistry transport model results, J. Geophys. Res., 112, bon monoxide total column retrievals from TROPOMI short- D12310, https://doi.org/10.1029/2006jd008256, 2007. wave infrared measurements, Atmos. Meas. Tech., 9, 4955– De Mazière, M., Sha, M. K., Desmet, F., Hermans, C., Sco- 4975, https://doi.org/10.5194/amt-9-4955-2016, 2016b. las, F., Kumps, N., Metzger, J.-M., Duflot, V., and Cammas, Levelt, P., van den Oord, G., Dobber, M., Malkki, A., Visser, H., J.-P.: TCCON data from Réunion Island (RE), Release de Vries, J., Stammes, P., Lundell, J., and Saari, H.: The ozone GGG2014.R0, TCCON Data Archive, hosted by CaltechDATA, monitoring instrument, IEEE T. Geosci. Remote, 44, 1093–1101, https://doi.org/10.14291/tccon.ggg2014.reunion01.R0/1149288, https://doi.org/10.1109/tgrs.2006.872333, 2006. 2014. McMillan, W. W.: Daily global maps of carbon monoxide from Feist, D. G., Arnold, S. G., John, N., and Geibel, M. C.: NASA’s Atmospheric Infrared Sounder, Geophys. Res. Lett., 32, TCCON data from Ascension Island (SH), Release L11801, https://doi.org/10.1029/2004gl021821, 2005. GGG2014.R0, TCCON Data Archive, hosted by CaltechDATA, Plaza-Medina, E. F., Stremme, W., Bezanilla, A., Grutter, M., https://doi.org/10.14291/tccon.ggg2014.ascension01.R0/1149285, Schneider, M., Hase, F., and Blumenstock, T.: Ground-based re- 2014. mote sensing of O3 by high- and medium-resolution FTIR spec- Frankenberg, C., Platt, U., and Wagner, T.: Retrieval of CO from trometers over the Mexico City basin, Atmos. Meas. Tech., 10, SCIAMACHY onboard ENVISAT: detection of strongly pol- 2703–2725, https://doi.org/10.5194/amt-10-2703-2017, 2017. luted areas and seasonal patterns in global CO abundances, At- Pommier, M., McLinden, C. A., and Deeter, M.: Relative mos. Chem. Phys., 5, 1639–1644, https://doi.org/10.5194/acp-5- changes in CO emissions over megacities based on obser- 1639-2005, 2005. vations from space, Geophys. Res. Lett., 40, 3766–3771, Gimeno García, S., Schreier, F., Lichtenberg, G., and Slijkhuis, https://doi.org/10.1002/grl.50704, 2013. S.: Near infrared nadir retrieval of vertical column densities: Rinsland, C. P., Luo, M., Logan, J. A., Beer, R., Worden, H., Ku- methodology and application to SCIAMACHY, Atmos. Meas. lawik, S. S., Rider, D., Osterman, G., Gunson, M., Eldering, A., Tech., 4, 2633–2657, https://doi.org/10.5194/amt-4-2633-2011, Goldman, A., Shephard, M., Clough, S. A., Rodgers, C., Lam- 2011. pel, M., and Chiou, L.: Nadir measurements of carbon monox- Gloudemans, A. M. S., Krol, M. C., Meirink, J. F., de Laat, ide distributions by the Tropospheric Emission Spectrometer in- A. T. J., van der Werf, G. R., Schrijver, H., van den Broek, strument onboard the Aura Spacecraft: Overview of analysis ap- www.atmos-meas-tech.net/11/5507/2018/ Atmos. Meas. Tech., 11, 5507–5518, 2018
5518                                                                                             T. Borsdorff et al.: TROPOMI CO

   proach and examples of initial results, Geophys. Res. Lett., 33,     Vidot, J., Landgraf, J., Hasekamp, O., Butz, A., Galli, A., Tol,
   L22806, https://doi.org/10.1029/2006gl027000, 2006.                    P., and Aben, I.: Carbon monoxide from shortwave infrared re-
Rodgers, C. D. and Connor, B. J.: Intercomparison of remote               flectance measurements: A new retrieval approach for clear sky
   sounding instruments, J. Geophys. Res.-Atmos., 108, 4116,              and partially cloudy atmospheres, Remote Sens. Environ., 120,
   https://doi.org/10.1029/2002jd002299, 2003.                            255–266, https://doi.org/10.1016/j.rse.2011.09.032, 2012.
Sherlock, V., Connor, B., Robinson, J., Shiona, H., Smale, D., and      Wennberg, P. O., Wunch, D., Roehl, C., Blavier, J.-F., Toon,
   Pollard, D.: TCCON data from Lauder (NZ), 125HR, Release               G. C., and Allen, N.: TCCON data from Caltech (US), Release
   GGG2014.R0, TCCON Data Archive, hosted by CaltechDATA,                 GGG2014.R1, TCCON Data Archive, hosted by CaltechDATA,
   https://doi.org/10.14291/tccon.ggg2014.lauder02.R0/1149298,            https://doi.org/10.14291/tccon.ggg2014.pasadena01.R1/1182415,
   2014.                                                                  2015.
Spivakovsky, C. M., Logan, J. A., Montzka, S. A., Balkanski, Y. J.,     Wennberg, P. O., Roehl, C., Blavier, J.-F., Wunch, D.,
   Foreman-Fowler, M., Jones, D. B. A., Horowitz, L. W., Fusco,           and Allen, N. T.: TCCON data from Jet Propul-
   A. C., Brenninkmeijer, C. A. M., Prather, M. J., Wofsy, S. C., and     sion Laboratory (US), 2011, Release GGG2014.R1,
   McElroy, M. B.: Three-dimensional climatological distribution          TCCON        Data     Archive,      hosted    by    CaltechDATA,
   of tropospheric OH: Update and evaluation, J. Geophys. Res.-           https://doi.org/10.14291/tccon.ggg2014.jpl02.R1/1330096,
   Atmos., 105, 8931–8980, https://doi.org/10.1029/1999jd901006,          2016.
   2000.                                                                Wunch, D., Toon, G. C., Wennberg, P. O., Wofsy, S. C., Stephens,
SRON: Science data products, available at: https://www.sron.nl/           B. B., Fischer, M. L., Uchino, O., Abshire, J. B., Bernath, P.,
   data, last access: 8 October 2018.                                     Biraud, S. C., Blavier, J.-F. L., Boone, C., Bowman, K. P., Brow-
Stephens, S., Madronich, S., Wu, F., Olson, J. B., Ramos,                 ell, E. V., Campos, T., Connor, B. J., Daube, B. C., Deutscher,
   R., Retama, A., and Muñoz, R.: Weekly patterns of Méx-                 N. M., Diao, M., Elkins, J. W., Gerbig, C., Gottlieb, E., Grif-
   ico City’s surface concentrations of CO, NOx , PM10 and                fith, D. W. T., Hurst, D. F., Jiménez, R., Keppel-Aleks, G., Kort,
   O3 during 1986–2007, Atmos. Chem. Phys., 8, 5313–5325,                 E. A., Macatangay, R., Machida, T., Matsueda, H., Moore, F.,
   https://doi.org/10.5194/acp-8-5313-2008, 2008.                         Morino, I., Park, S., Robinson, J., Roehl, C. M., Sawa, Y., Sher-
Stremme, W., Ortega, I., and Grutter, M.: Using ground-based solar        lock, V., Sweeney, C., Tanaka, T., and Zondlo, M. A.: Cali-
   and lunar infrared spectroscopy to study the diurnal trend of car-     bration of the Total Carbon Column Observing Network us-
   bon monoxide in the Mexico City boundary layer, Atmos. Chem.           ing aircraft profile data, Atmos. Meas. Tech., 3, 1351–1362,
   Phys., 9, 8061–8078, https://doi.org/10.5194/acp-9-8061-2009,          https://doi.org/10.5194/amt-3-1351-2010, 2010.
   2009.                                                                Wunch, D., Toon, G. C., Sherlock, V., Deutscher, N. M., Liu,
Stremme, W., Grutter, M., Rivera, C., Bezanilla, A., Garcia, A.           C., Feist, D. G., and Wennberg, P. O.: The Total Car-
   R., Ortega, I., George, M., Clerbaux, C., Coheur, P.-F., Hurt-         bon Column Observing Network’s GGG2014 Data Ver-
   mans, D., Hannigan, J. W., and Coffey, M. T.: Top-down esti-           sion, Tech. rep., D. California Institute of Technology,
   mation of carbon monoxide emissions from the Mexico Megac-             Pasadena, Carbon Dioxide Information Analysis Center,
   ity based on FTIR measurements from ground and space, At-              Oak Ridge National Laboratory, Oak Ridge, Tennessee, USA,
   mos. Chem. Phys., 13, 1357–1376, https://doi.org/10.5194/acp-          https://doi.org/10.14291/tccon.ggg2014.documentation.R0/1221662,
   13-1357-2013, 2013.                                                    2015.
Sussmann,       R.     and    Rettinger,   M.:      TCCON        data   Yurganov, L. N., Blumenstock, T., Grechko, E. I., Hase, F., Hyer,
   from Garmisch (DE), Release GGG2014.R0, TC-                            E. J., Kasischke, E. S., Koike, M., Kondo, Y., Kramer, I., Le-
   CON        Data      Archive,    hosted     by    CaltechDATA,         ung, F.-Y., Mahieu, E., Mellqvist, J., Notholt, J., Novelli, P. C.,
   https://doi.org/10.14291/tccon.ggg2014.garmisch01.R0/1149299,          Rinsland, C. P., Scheel, H. E., Schulz, A., Strandberg, A., Suss-
   2014.                                                                  mann, R., Tanimoto, H., Velazco, V., Zander, R., and Zhao, Y.: A
TCCON network: TCCON data, available at: https://tccondata.org/,          quantitative assessment of the 1998 carbon monoxide emission
   last access: 8 October 2018.                                           anomaly in the Northern Hemisphere based on total column and
Turquety, S., Hadji-Lazaro, J., Clerbaux, C., Hauglustaine, D. A.,        surface concentration measurements, J. Geophys. Res.-Atmos.,
   Clough, S. A., Cassé, V., Schlüssel, P., and Mégie, G.: Op-            109, D15305, https://doi.org/10.1029/2004JD004559, 2004.
   erational trace gas retrieval algorithm for the Infrared Atmo-       Yurganov, L. N., Duchatelet, P., Dzhola, A. V., Edwards, D. P., Hase,
   spheric Sounding Interferometer, J. Geophys. Res.-Atmos., 109,         F., Kramer, I., Mahieu, E., Mellqvist, J., Notholt, J., Novelli,
   D21301, https://doi.org/10.1029/2004jd004821, 2004.                    P. C., Rockmann, A., Scheel, H. E., Schneider, M., Schulz, A.,
Veefkind, J., Aben, I., McMullan, K., Förster, H., de Vries,              Strandberg, A., Sussmann, R., Tanimoto, H., Velazco, V., Drum-
   J., Otter, G., Claas, J., Eskes, H., de Haan, J., Kleipool,            mond, J. R., and Gille, J. C.: Increased Northern Hemispheric
   Q., van Weele, M., Hasekamp, O., Hoogeveen, R., Landgraf,              carbon monoxide burden in the troposphere in 2002 and 2003
   J., Snel, R., Tol, P., Ingmann, P., Voors, R., Kruizinga, B.,          detected from the ground and from space, Atmos. Chem. Phys.,
   Vink, R., Visser, H., and Levelt, P.: TROPOMI on the ESA               5, 563–573, https://doi.org/10.5194/acp-5-563-2005, 2005.
   Sentinel-5 Precursor: A GMES mission for global observations
   of the atmospheric composition for climate, air quality and
   ozone layer applications, Remote Sens. Environ., 120, 70–83,
   https://doi.org/10.1016/j.rse.2011.09.027, 2012.

Atmos. Meas. Tech., 11, 5507–5518, 2018                                                   www.atmos-meas-tech.net/11/5507/2018/
You can also read