Digital Biomarkers of Symptom Burden Self-Reported by Perioperative Patients Undergoing Pancreatic Surgery: Prospective Longitudinal Study
←
→
Page content transcription
If your browser does not render page correctly, please read the page content below
JMIR CANCER                                                                                                                                      Low et al

     Original Paper

     Digital Biomarkers of Symptom Burden Self-Reported by
     Perioperative Patients Undergoing Pancreatic Surgery:
     Prospective Longitudinal Study

     Carissa A Low1, PhD; Meng Li1, MS; Julio Vega1, PhD; Krina C Durica1, MA; Denzil Ferreira2, PhD; Vernissia Tam3,
     MD; Melissa Hogg4, MD; Herbert Zeh III5, MD; Afsaneh Doryab6, PhD; Anind K Dey7, PhD
     1
      Mobile Sensing + Health Institute, Center for Behavioral Health, Media, and Technology, University of Pittsburgh, Pittsburgh, PA, United States
     2
      Information Technology and Electrical Engineering, University of Oulu, Oulu, Finland
     3
      Department of Surgery, New York-Presbyterian Hospital & Weill Cornell Medical College, New York, NY, United States
     4
      NorthShore University HealthSystem, Evanston, IL, United States
     5
      Department of Surgery, UT Southwestern Medical Center, Dallas, TX, United States
     6
      Systems and Information Engineering, University of Virginia, Charlottesville, VA, United States
     7
      Information School, University of Washington, Seattle, WA, United States

     Corresponding Author:
     Carissa A Low, PhD
     Mobile Sensing + Health Institute
     Center for Behavioral Health, Media, and Technology
     University of Pittsburgh
     3347 Forbes Ave
     Suite 200
     Pittsburgh, PA, 15213
     United States
     Phone: 1 4126235973
     Email: lowca@upmc.edu

     Abstract
     Background: Cancer treatments can cause a variety of symptoms that impair quality of life and functioning but are frequently
     missed by clinicians. Smartphone and wearable sensors may capture behavioral and physiological changes indicative of symptom
     burden, enabling passive and remote real-time monitoring of fluctuating symptoms
     Objective: The aim of this study was to examine whether smartphone and Fitbit data could be used to estimate daily symptom
     burden before and after pancreatic surgery.
     Methods: A total of 44 patients scheduled for pancreatic surgery participated in this prospective longitudinal study and provided
     sufficient sensor and self-reported symptom data for analyses. Participants collected smartphone sensor and Fitbit data and
     completed daily symptom ratings starting at least two weeks before surgery, throughout their inpatient recovery, and for up to
     60 days after postoperative discharge. Day-level behavioral features reflecting mobility and activity patterns, sleep, screen time,
     heart rate, and communication were extracted from raw smartphone and Fitbit data and used to classify the next day as high or
     low symptom burden, adjusted for each individual’s typical level of reported symptoms. In addition to the overall symptom
     burden, we examined pain, fatigue, and diarrhea specifically.
     Results: Models using light gradient boosting machine (LightGBM) were able to correctly predict whether the next day would
     be a high symptom day with 73.5% accuracy, surpassing baseline models. The most important sensor features for discriminating
     high symptom days were related to physical activity bouts, sleep, heart rate, and location. LightGBM models predicting next-day
     diarrhea (79.0% accuracy), fatigue (75.8% accuracy), and pain (79.6% accuracy) performed similarly.
     Conclusions: Results suggest that digital biomarkers may be useful in predicting patient-reported symptom burden before and
     after cancer surgery. Although model performance in this small sample may not be adequate for clinical implementation, findings
     support the feasibility of collecting mobile sensor data from older patients who are acutely ill as well as the potential clinical
     value of mobile sensing for passive monitoring of patients with cancer and suggest that data from devices that many patients

     https://cancer.jmir.org/2021/2/e27975                                                                        JMIR Cancer 2021 | vol. 7 | iss. 2 | e27975 | p. 1
                                                                                                                        (page number not for citation purposes)
XSL• FO
RenderX
JMIR CANCER Low et al
already own and use may be useful in detecting worsening perioperative symptoms and triggering just-in-time symptom management
interventions.
(JMIR Cancer 2021;7(2):e27975) doi: 10.2196/27975
KEYWORDS
mobile sensing; symptom; cancer; surgery; wearable device; smartphone; mobile phone
such as accelerometers and photoplethysmography which can
Introduction provide continuous information about activity, sleep, and
Cancer treatments such as chemotherapy and surgery cause a physiology (eg, heart rate). Together, these mobile sensing
variety of symptoms and side effects that can impair subjective technologies enable objective assessment of behavioral patterns
quality of life and functioning. Across a variety of cancer types, that may reflect worsening health status, including severe or
fatigue, pain, nausea, and other physical symptoms are highly increasing symptoms. Moreover, this high-density, multimodal,
prevalent and often severe [1,2], and many patients experience and objective data collection can be completed with minimal
multiple symptoms simultaneously [3]. Patients who report burden to patients; this feature makes this approach highly
more significant symptoms tend to exhibit worse performance scalable and appropriate for remotely monitoring patients, even
status and functional ability [4,5]. Unfortunately, symptoms older patients and those who are acutely ill and even over long
remain undetected by clinicians up to half of the time [6,7], periods. Given evidence that physical activity and sleep
limiting opportunities for timely and effective clinical behaviors as well as heart rate have prognostic value in
management and resulting in undue patient suffering and oncology, technology that enables passive quantification of
functional impairment. these metrics holds considerable promise for clinical cancer
research [18-20].
Remotely monitoring symptoms between hospital or clinic visits
may improve our ability to capture severe or bothersome Applying machine learning classification to smartphone sensor
symptoms when they begin to emerge [8]. Smartphones, now data has been shown to accurately discriminate depressed from
owned by 81% of adults and increasing proportions of older nondepressed individuals [21], to recognize depressive and
adults, those living in rural areas, and all racial groups, offer manic episodes in patients with bipolar disorder [22-24], to
new opportunities for remote symptom monitoring [9]. Systems predict mental health indicators in schizophrenia [25], and to
leveraging smartphones for real-time patient-reported outcome detect binge drinking and other substance use [26]. These
(PRO) assessment during outpatient chemotherapy have been methods can also shed light on which behavioral features are
demonstrated to be feasible [10,11] and to reduce most useful for detecting or predicting mental health states or
chemotherapy-related morbidity [12]. Although daily PRO risky behaviors. Work applying this approach to passively detect
symptom data are valuable, long-term assessment of PROs (eg, physical health status in patients with cancer is more limited,
over months or years of chemotherapy) is burdensome. Indeed, but results from 14 recent small studies suggest that wearable
previous work suggests that patients become significantly less and smartphone sensor data are related to symptom burden,
compliant at recording symptoms over time [13], with patient quality of life, and other clinical oncology outcomes [27].
compliance dropping to below 50% after 1 month in one The perioperative context is an especially critical time for remote
longitudinal study [14]. Developing a remote symptom patient monitoring, as complications after cancer surgery are
monitoring system that is less reliant on patient compliance may common and can escalate into re-admissions that may be
enable longitudinal symptom tracking and management preventable if detected and managed earlier. Results from similar
throughout cancer treatment and even after treatment is studies of patients undergoing surgical oncology procedures
completed, when symptoms persist for many survivors. found that accelerometer data were useful for quantifying
Smartphones are equipped with a rich array of sensors capable differences in postoperative recovery [28] and for predicting
of measuring many behavioral and contextual variables, re-admission risk [29]. In this study, we aimed to examine
including mobility, location, ambient light and noise, and social whether smartphone and wearable sensors can be useful in
interactions [15]. Most users keep their smartphones within detecting overall patient-reported symptom burden as well as
arm’s reach at all times and spend over 4 hours per day 3 specific physical symptoms (fatigue, pain, and diarrhea)
interacting with the device [16]. Thus, smartphones can gather among patients undergoing pancreatic cancer surgery, a complex
digital traces as individuals go about their daily routines. From but potentially curative procedure with postoperative morbidity
these raw digital data, meaningful behavioral features such as rates as high as 40% [30].
number of unique locations visited, number of outgoing calls
placed, and average level of ambient noise detected during the Methods
night can be calculated to provide information about behavior
patterns in real-world contexts [17].
Participants
Potential study participants were identified for the study by their
Smartwatches and other wearable commercial activity monitors surgical oncology care team. Men and women aged 18 years or
are also becoming more widely used, with about 1 in 5 adults older who were scheduled for pancreatic surgery at a large
using a wearable device [9]. Wearable devices contain sensors academic cancer center were eligible and were enrolled at their
https://cancer.jmir.org/2021/2/e27975 JMIR Cancer 2021 | vol. 7 | iss. 2 | e27975 | p. 2
(page number not for citation purposes)
XSL• FO
RenderXJMIR CANCER Low et al
preoperative clinic visit. Of 72 eligible and approached patients, daily symptom burden scores and categorized the resulting
60 consented to participate in this study. Surgery was canceled residual into average or below average (residual of daily score
for 4 patients, and 2 withdrew from the study prior to surgery – individual mean ≤ 0) or high (residual of daily score –
due to poor health or feeling overwhelmed. An additional 10 individual mean > 0). This approach allowed us to classify each
had insufficient sensor data for analyses based on data cleaning day as a high or low symptom burden day, adjusting for each
thresholds (described in detail later), leaving 44 participants in individual’s typical level of reported symptoms. Approximately
our analytic sample (mean age 65.7 years, range 40-82; 41% 35.99% (487/1353) of all days were classified as high symptom
[18/44] female; 93% [41/44] white). Most patients were days (proportion of high symptom days for individual patients
undergoing surgery (75% [33/44] robotic, 16% [7/44] open, 9% ranged from ranged from 0% [0/11] to 80% [8/10]). As the data
[4/44] laparoscopic) for pancreatic cancer (36/44, 82%), with set was imbalanced, we used the support vector machine
the remainder undergoing surgery for benign conditions (eg, synthetic minority over-sampling technique (SVM SMOTE) to
pancreatic cysts). Participants were enrolled from January to resample the minority class. We also examined 3 specific
September 2017. physical symptoms (pain, fatigue, and diarrhea because these
were the most common in our sample) using a similar approach.
Study Procedure
Study assessments began prior to surgery and continued during Passive Smartphone and Wearable Sensor Data
inpatient recovery after surgery (mean 7-day stay, range 2-22) We computed day-level (24 hours from midnight to midnight)
and for 60 days after postoperative discharge. A total of 13/44 behavioral features from both AWARE and Fitbit data using
patients (30%) were re-admitted to the hospital at some point our Reproducible Analysis Pipeline for Data Streams (RAPIDS)
during the 60 days. At their preoperative visit, participants were [35]. Accelerometer, activity recognition, application, battery,
provided with an Android smartphone with the AWARE app call, conversation, light, location, SMS text message, and screen
installed [31]. AWARE was used to passively collect features were extracted from AWARE data. Heart rate, step,
smartphone sensor data, including movement and approximate and sleep features were extracted from Fitbit data. For sleep,
location of the phone, device use, metadata about call and SMS features were extracted for any sleep episodes that ended on
events, and ambient light and noise levels. AWARE was also that day to capture both overnight main sleep and naps. In total,
used to collect patient-reported symptom ratings each morning; we extracted 213 features from smartphone and Fitbit data;
participants rated the severity of 10 physical and psychological feature descriptions can be found in RAPIDS documentation
symptoms (pain, fatigue, sleep disturbance, trouble [35,36]. We also included 3 additional features judged to be
concentrating/remembering things, feeling sad or down, feeling important for symptom prediction: (1) days since surgery,
anxious or worried, shortness of breath, numbness or tingling, because symptoms tended to considerably increase immediately
nausea, diarrhea or constipation) on a scale from 0 (not present) after surgery and then decline over time; (2) most recent
to 10 (as bad as you can imagine). These symptoms were symptom burden score, given that high symptom burden scores
selected because they reflect common core symptoms during today tended to predict high symptom burden tomorrow; and
oncology treatment [32] and the symptom severity rating format (3) participant’s average symptom burden score up to current
was adapted from the MD Anderson Symptom Inventory [33]. time point, given the substantial between-participant variability
AWARE stored this information on the device and transmitted in the range of symptom severities reported. Because symptom
deidentified data to a secure server over a secure network ratings were completed each morning, sensor data were used
connection when the device was connected to Wi-Fi. Participants to predict the next day’s symptom burden class.
were asked to keep the phone charged and with them at all times
We dropped sensor and symptom data from the date of surgery
and to use the phone for communication as much as possible.
(as devices were with caregivers while patients were in the
Participants were also given a Fitbit Charge 2 device to wear operating room) and from days that the patient was hospitalized
for the duration of the study, which they were invited to keep (both after surgery and during any subsequent re-admissions,
after study completion. The Fitbit collected data about activity, as we anticipated behavioral patterns to differ systematically in
sleep, and heart rate. The Fitbit Charge 2 has been shown to the hospital and we are most interested in detecting symptoms
measure activity and sleep parameters with acceptable accuracy when patients are not in a health care setting).
in older free-living adults [34].
To clean data, we first excluded days with less than 20 hours
After study completion, participants returned the mobile phones of sensor data and participants with fewer than 5 days of sensor
to the study team and received a compensation of US $150. The data. We then dropped features missing more than 30% of values
University of Pittsburgh institutional review board approved (days) or with 0 variance as well as days missing more than
all study procedures. 30% of values (features). We merged sensor data with high/low
symptom labels, then again filtered out participants with less
Data Processing and Analytic Approach than 5 days of valid labeled sensor feature data. After data
Patient-Reported Symptoms cleaning, we had 1353 (mean 30.75, range 5-67 per patient)
days of sensor data including 142 features from 44 patients.
To compute daily symptom burden scores, we summed all 10
symptom ratings to create a composite reflecting total daily On average, participants were missing 7.25% of data values
symptom burden (mean 15, range 0-97). We then calculated the (range 0%-19.08%). For each participant, we imputed
mean daily symptom burden for each individual patient and continuous missing data as follows: (1) missing features in the
then subtracted individual means from each of that patient’s training set (ie, subset of data used to train the model) were
https://cancer.jmir.org/2021/2/e27975 JMIR Cancer 2021 | vol. 7 | iss. 2 | e27975 | p. 3
(page number not for citation purposes)
XSL• FO
RenderXJMIR CANCER Low et al
replaced with the average of the 2 closest days; (2) missing nonsensor features used in our models). We used nested
features in the test set (ie, subset of data used to evaluate model cross-validation. Three-fold cross-validation was considered
performance) were replaced with the last valid day’s feature for the inner loop to tune hyperparameters and leave-one-day-out
from the training set; and (3) if a participant is missing a specific cross-validation was considered for the outer loop to evaluate
feature, replace it with the average from the rest of the performance and calculate accuracy, precision, recall, F1, and
participants’ data. We imputed categorical missing data as area under the receiver operating characteristic curve (AUC)
follows: (1) missing features were replaced with the mode of across all folds. Because our ultimate goal is real-time clinical
that participant’s training data; (2) if a participant is missing a implementation of these algorithms, we trained models only on
specific feature, replace it with the mode of the remaining past data from that participant as well as data from other
participants’ training data. participants (ie, data collected after the test day were not
included in the training set for that fold). The code for feature
Categorical features were converted into integer representation
extraction and analysis is available online [37].
via one-hot encoding. Because the scale of features will not
influence the results of tree-based algorithms (eg, light gradient
boosting machine [LightGBM]), we normalized numerical
Results
features with either min–max, z-score, or scikit-learn package’s Models using LightGBM performed best for the population
robust scaler for the rest of the models. A total of 75 features model. We used 0 as the random seed, 200 as the number of
were selected via mutual information. boosted trees, and 128 as the maximum tree leaves. The learning
We evaluated a number of different binary classifiers, including rate was chosen from {0.008, 0.01, 0.012} and the subsample
logistic regression, k-nearest neighbors, support vector machine, ratio of columns when constructing each tree was chosen from
random forest, gradient boosting, extreme gradient boosting, {0.68, 0.7, 0.72}. Using this approach, models using smartphone
and LightGBM. Model performance (ability of the model to and wearable feature data were able to correctly predict whether
generate predicted binary class labels [0 vs 1] that match true the next day would be a high symptom day with 73.5% accuracy
class labels) was compared with several baselines: majority (0.611 recall for the high symptom class and 0.772 AUC). This
class, random weighted classifier, and decision tree using days model surpassed the accuracy and performance of all 3 baseline
since surgery, most recent score, and average score (ie, the 3 models (Table 1).
Table 1. Performance of population models classifying next-day symptom class.a
Method Accuracy Precision0 Recall0 F10 Precision1 Recall1 F11 Macro F1b AUC
(%) (%) (%) (%) (%) (%) (%) (%) (%)
Baseline1: majority class 64.5 64.5 100.0 78.4 0.0 0.0 0.0 39.2 50.0
Baseline2: random weighted classifier 54.1 64.4 64.4 64.4 35.5 35.5 35.5 50.0 50.0
Baseline3: decision tree with nonsensor 67.5 75.5 73.3 74.4 54.0 57.0 55.5 64.9 65.1
features
LightGBM 73.5 78.9 80.4 79.7 63.2 61.1 62.2 70.9 77.2
a
0=average or lower than average symptom burden; 1=higher than average symptom burden.
b
Macro F1 score refers to the average of the 2 F1 scores.
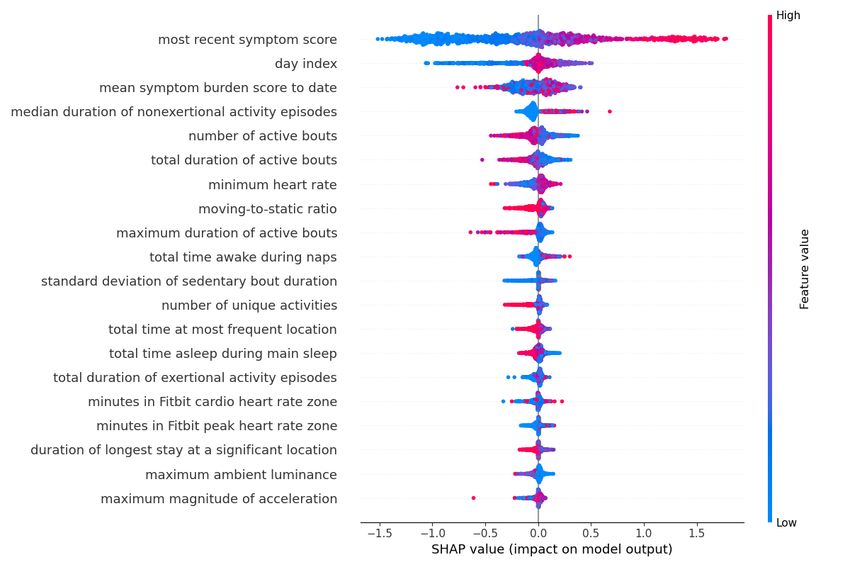
The most important features included the most recent symptom We also generated population models for diarrhea, fatigue, and
burden score, days since surgery, average symptom burden pain, respectively. All steps are the same as above except for
score, duration of active and exertional activity bouts, minimum the target values. Instead of calculating the labels based on the
heart rate, number of unique activities, time spent at the most summation of all 10 symptom ratings, diarrhea score or fatigue
frequent location, maximum ambient lux, total duration of time score or pain score is applied directly.
awake and asleep, and total duration of the heart rate in cardio
Like the overall symptom burden results, LightGBM models
zone (70%-84% of the participant’s maximum heart rate) and
outperformed all 3 baseline models and predicted next-day
peak zone (85%-100% of the participant’s maximum heart rate;
diarrhea with 79.0% accuracy (AUC 83.41%), next-day fatigue
Figure 1). In this plot, features with many instances in red with
with 75.8% accuracy (AUC 80.29%), and next-day pain with
SHAP (SHapley Additive exPlanations) [38] value greater than
79.6% accuracy (AUC 83.48%; Table 2). Location features are
0 had a positive relationship with symptom burden (eg, longer
very important for diarrhea prediction, while step features and
median duration of nonexertional episodes related to high
sleep features are very important for fatigue prediction and pain
symptom burden), whereas those in blue had an inverse
prediction, respectively. The most recent symptom burden score,
association (eg, shorter total duration of active bouts related to
days since surgery, and average symptom burden score are the
high symptom burden).
most important features for all symptoms.
https://cancer.jmir.org/2021/2/e27975 JMIR Cancer 2021 | vol. 7 | iss. 2 | e27975 | p. 4
(page number not for citation purposes)
XSL• FO
RenderXJMIR CANCER Low et al
Figure 1. Density scatter plot showing SHapley Additive exPlanation (SHAP) values for each feature, reflecting how much impact each feature has
on model output. Features with many instances in red with SHAP values greater than 0 are positively associated with symptom burden, while those
with many blue instances are inversely associated with symptom burden.
Table 2. Performance of population models classifying next-day diarrhea or fatigue or pain symptom class (1=higher than average) from wearable and
smartphone sensors.
Target (symptom) and method Accuracy Precision0 Recall0 F10 Precision1 Recall1 F11 Macro F1 AUC
(%) (%) (%) (%) (%) (%) (%) (%) (%)
Diarrhea
Baseline1: majority class 67.4 67.4 100.0 80.5 0.0 0.0 0.0 40.3 50.0
Baseline2: random weighted classifier 56.0 67.4 67.4 67.4 32.5 32.5 32.5 49.9 49.9
Baseline3: decision tree with nonsensor 73.2 82.0 77.2 79.5 57.9 64.9 61.2 70.3 71.0
features
LightGBM 79.0 85.0 83.7 84.3 67.3 69.4 68.3 76.3 83.4
Fatigue
Baseline1: majority class 64.7 64.7 100.0 78.6 0.0 0.0 0.0 39.3 50.0
Baseline2: random weighted classifier 54.3 64.7 64.7 64.7 35.3 35.3 35.3 50.0 50.0
Baseline3: decision tree with nonsensor 67.0 75.9 71.8 73.8 53.0 58.2 55.4 64.6 65.0
features
LightGBM 75.8 81.2 81.5 81.4 65.9 65.5 65.7 73.5 80.3
Pain
Baseline1: majority class 70.4 70.4 100.0 82.7 0.0 0.0 0.0 41.3 50.0
Baseline2: random weighted classifier 58.4 70.5 70.4 70.4 29.6 29.6 29.6 50.0 50.0
Baseline3: decision tree with nonsensor 74.4 82.4 81.0 81.7 56.5 58.8 57.6 69.7 69.9
features
LightGBM 79.6 85.7 85.3 85.5 65.4 66.0 65.7 75.6 83.5
https://cancer.jmir.org/2021/2/e27975 JMIR Cancer 2021 | vol. 7 | iss. 2 | e27975 | p. 5
(page number not for citation purposes)
XSL• FO
RenderXJMIR CANCER Low et al
of high symptom days would be missed by our model. This may
Discussion be due in part to the relatively small sample and data set, the
The purpose of this prospective longitudinal study was to use of study-provided (rather than personal) smartphones, or
evaluate passive smartphone and wearable sensor features as the powerful effect of major abdominal surgery and prolonged
predictors of symptom burden in perioperative patients hospitalization on patient symptom profiles as well as behavior.
undergoing pancreatic surgery. Results suggest that machine Future studies with larger samples that collect data using their
learning models developed using mobile sensor data were more own personal devices over a period with less dramatic shifts in
accurate than non–sensor-based baseline models in predicting symptoms and behavior may yield better model performance.
whether the next-day patient-reported overall symptom burden In future studies with larger data sets more robust to class
would be higher than average for that patient. The most imbalance, setting a higher threshold for severe symptoms
important features for symptom prediction included features requiring care provider attention or intervention may also result
related to physical activity, heart rate, and location. Models also in more clinically useful models. Regardless, mobile sensor
accurately predicted next-day diarrhea, fatigue, and pain, data may be a useful complement to patient-reported symptom
although the most important features in each model differed data, allowing for a more personalized and adaptive delivery of
across specific symptoms. symptom ratings when behavioral fluctuations are detected,
reducing patient burden and improving early capture of
This work contributes to a small but growing literature worsening side effects and symptoms. Predictive models based
investigating associations between consumer mobile sensors on sensor and patient-reported data could also be used to deliver
and clinical outcomes in oncology [27]. Similar to studies of symptom self-management instructions to patients, an approach
patients undergoing chemotherapy [39] and hematopoietic cell demonstrated to benefit patients undergoing pancreatic cancer
transplant [40], features related to physical activity were most surgery [42].
strongly related to fluctuations in physical symptom severity.
Feature importance revealed that these were not simple features Given the small data set, we focused on building population
such as daily step counts but rather features reflecting patterns models that used data from all other participants, which also
of activity and included measurements from both wearable Fitbit may have constrained model performance. Because each
devices (eg, number, total duration, and maximum duration of participant had on average only 30 rows of data, individual
active bouts) and smartphones (eg, duration of nonexertional models were unstable, but with more training data could be
episodes from phone accelerometer, number of unique activities useful in learning patterns based on each participant’s behavior
recognized). Heart rate and sleep features were also important, and its relationship to symptoms and developing more accurate
suggesting that future work in this area should consider using predictions. Developing models based on similar subgroups of
wearable devices that enable collection of 24-hour behavioral participants (based on demographic, clinical, or behavioral
and physiological data and examination of circadian rest-activity factors) could be a useful approach for future work and could
rhythms previously linked to outcomes in patients with cancer yield superior results to a single population model.
[41]. Strengths of the study include longitudinal sensor data collection
Because wearable and smartphone sensor data can be collected over a wide perioperative window, from presurgery to 60 days
continuously as patients go about their daily lives, requiring after discharge following pancreatic surgery. We considered a
minimal effort or attention from patients or their caregivers, wide range of features from both wearable and smartphone
mobile sensing offers an opportunity for long-term remote sensors and examined prediction of next-day overall symptom
patient monitoring over months or years of cancer treatment burden as well as next-day pain, fatigue, and diarrhea
and survivorship. This study supports the feasibility of collecting specifically. Our models were also trained on past data only so
mobile sensor data, even from patients who are seriously ill that we could evaluate how well models could perform if
during times of acute sickness and recovery. Despite undergoing implemented in real-world clinical settings.
invasive surgery and (for most patients) grappling with one of This study suggests that digital biomarkers may be useful in
the deadliest cancer diagnoses, over 80% of participants had predicting patient-reported symptom burden during cancer
sufficient sensor data for analyses. This is also noteworthy given treatment. In an ongoing study, we are following up on this
that the average age of patients was over 65 and that, as these work by collecting 3 months of smartphone and wearable sensor
data were collected in 2017, participants varied considerably in data as well as daily symptom reports from a large sample of
their comfort and familiarity with mobile technology. patients undergoing outpatient chemotherapy. With a larger
Although models trained on past mobile sensor data outpatient sample using their own smartphones, we hope to
outperformed baseline models, model performance still may improve upon the models developed here and to use real-time
not be adequate for clinical implementation. For example, recall next-day symptom predictions to deliver more timely and
of the high overall symptom burden class (when timely clinical personalized symptom management support.
action would be needed) was only 61%, meaning nearly 40%
Acknowledgments
This work was supported in part by the Center for Machine Learning and Health at Carnegie Mellon University through the
Pittsburgh Health Data Alliance, the National Cancer Institute (K07CA204380 and R37CA242545), the Hillman Fellows for
https://cancer.jmir.org/2021/2/e27975 JMIR Cancer 2021 | vol. 7 | iss. 2 | e27975 | p. 6
(page number not for citation purposes)
XSL• FO
RenderXJMIR CANCER Low et al
Innovative Cancer Research Program funded by the Henry L. Hillman Foundation, and the Robotic Surgery Research Grant from
the Society of American Gastrointestinal and Endoscopic Surgeons. We gratefully acknowledge Lillian Smith for her assistance
with data collection and management.
Conflicts of Interest
MH receives an unrestricted education grant from Intuitive Surgical. All other authors declare no conflicts of interest.
References
1. Henry DH, Viswanathan HN, Elkin EP, Traina S, Wade S, Cella D. Symptoms and treatment burden associated with cancer
treatment: results from a cross-sectional national survey in the U.S. Support Care Cancer 2008 Jul;16(7):791-801. [doi:
10.1007/s00520-007-0380-2] [Medline: 18204940]
2. Reilly CM, Bruner DW, Mitchell SA, Minasian LM, Basch E, Dueck AC, et al. A literature synthesis of symptom prevalence
and severity in persons receiving active cancer treatment. Support Care Cancer 2013 Jun;21(6):1525-1550 [FREE Full text]
[doi: 10.1007/s00520-012-1688-0] [Medline: 23314601]
3. Cleeland CS, Zhao F, Chang VT, Sloan JA, O'Mara AM, Gilman PB, et al. The symptom burden of cancer: Evidence for
a core set of cancer-related and treatment-related symptoms from the Eastern Cooperative Oncology Group Symptom
Outcomes and Practice Patterns study. Cancer 2013 Dec 15;119(24):4333-4340 [FREE Full text] [doi: 10.1002/cncr.28376]
[Medline: 24114037]
4. Hensing T, Cella D, Yount S. The impact of ECOG performance status on quality of life symptoms in patients with advanced
lung cancer. JCO 2005 Jun;23(16_suppl):8099-8099. [doi: 10.1200/jco.2005.23.16_suppl.8099] [Medline: 27946508]
5. West HJ, Jin JO. JAMA Oncology Patient Page. Performance Status in Patients With Cancer. JAMA Oncol 2015 Oct;1(7):998.
[doi: 10.1001/jamaoncol.2015.3113] [Medline: 26335750]
6. Atkinson TM, Ryan SJ, Bennett AV, Stover AM, Saracino RM, Rogak LJ, et al. The association between clinician-based
common terminology criteria for adverse events (CTCAE) and patient-reported outcomes (PRO): a systematic review.
Support Care Cancer 2016 Aug;24(8):3669-3676. [doi: 10.1007/s00520-016-3297-9] [Medline: 27260018]
7. Fromme EK, Eilers KM, Mori M, Hsieh Y, Beer TM. How accurate is clinician reporting of chemotherapy adverse effects?
A comparison with patient-reported symptoms from the Quality-of-Life Questionnaire C30. J Clin Oncol 2004 Sep
1;22(17):3485-3490. [doi: 10.1200/JCO.2004.03.025] [Medline: 15337796]
8. Schneider S, Stone AA. Ambulatory and diary methods can facilitate the measurement of patient-reported outcomes. Qual
Life Res 2015 Jun 23:497-506. [doi: 10.1007/s11136-015-1054-z] [Medline: 26101141]
9. Anderson M. Mobile Technology and Home Broadband 2019. 2019 Jun 13. URL: https://www.pewresearch.org/internet/
2019/06/13/mobile-technology-and-home-broadband-2019/ [accessed 2021-04-04]
10. Falchook AD, Tracton G, Stravers L, Fleming ME, Snavely AC, Noe JF, et al. Use of mobile device technology to
continuously collect patient-reported symptoms during radiation therapy for head and neck cancer: A prospective feasibility
study. Adv Radiat Oncol 2016;1(2):115-121 [FREE Full text] [doi: 10.1016/j.adro.2016.02.001] [Medline: 28740878]
11. Weaver A, Young AM, Rowntree J, Townsend N, Pearson S, Smith J, et al. Application of mobile phone technology for
managing chemotherapy-associated side-effects. Ann Oncol 2007 Nov;18(11):1887-1892 [FREE Full text] [doi:
10.1093/annonc/mdm354] [Medline: 17921245]
12. Kearney N, McCann L, Norrie J, Taylor L, Gray P, McGee-Lennon M, et al. Evaluation of a mobile phone-based, advanced
symptom management system (ASyMS) in the management of chemotherapy-related toxicity. Support Care Cancer 2009
Apr;17(4):437-444. [doi: 10.1007/s00520-008-0515-0] [Medline: 18953579]
13. Judson TJ, Bennett AV, Rogak LJ, Sit L, Barz A, Kris MG, et al. Feasibility of long-term patient self-reporting of toxicities
from home via the Internet during routine chemotherapy. J Clin Oncol 2013 Jul 10;31(20):2580-2585 [FREE Full text]
[doi: 10.1200/JCO.2012.47.6804] [Medline: 23733753]
14. Min YH, Lee JW, Shin Y, Jo M, Sohn G, Lee J, et al. Daily collection of self-reporting sleep disturbance data via a
smartphone app in breast cancer patients receiving chemotherapy: a feasibility study. J Med Internet Res 2014;16(5):e135
[FREE Full text] [doi: 10.2196/jmir.3421] [Medline: 24860070]
15. Harari GM, Lane ND, Wang R, Crosier BS, Campbell AT, Gosling SD. Using Smartphones to Collect Behavioral Data in
Psychological Science: Opportunities, Practical Considerations, and Challenges. Perspect Psychol Sci 2016
Nov;11(6):838-854. [doi: 10.1177/1745691616650285] [Medline: 27899727]
16. Andrews S, Ellis DA, Shaw H, Piwek L. Beyond Self-Report: Tools to Compare Estimated and Real-World Smartphone
Use. PLoS One 2015;10(10):e0139004 [FREE Full text] [doi: 10.1371/journal.pone.0139004] [Medline: 26509895]
17. Mohr DC, Zhang M, Schueller SM. Personal Sensing: Understanding Mental Health Using Ubiquitous Sensors and Machine
Learning. Annu Rev Clin Psychol 2017 May 08;13:23-47. [doi: 10.1146/annurev-clinpsy-032816-044949] [Medline:
28375728]
18. Friedenreich CM, Neilson HK, Farris MS, Courneya KS. Physical Activity and Cancer Outcomes: A Precision Medicine
Approach. Clin Cancer Res 2016 Oct 01;22(19):4766-4775 [FREE Full text] [doi: 10.1158/1078-0432.CCR-16-0067]
[Medline: 27407093]
https://cancer.jmir.org/2021/2/e27975 JMIR Cancer 2021 | vol. 7 | iss. 2 | e27975 | p. 7
(page number not for citation purposes)
XSL• FO
RenderXJMIR CANCER Low et al
19. Kloter E, Barrueto K, Klein SD, Scholkmann F, Wolf U. Heart Rate Variability as a Prognostic Factor for Cancer Survival
- A Systematic Review. Front Physiol 2018;9:623 [FREE Full text] [doi: 10.3389/fphys.2018.00623] [Medline: 29896113]
20. Li Y, Cai S, Ling Y, Mi S, Fan C, Zhong Y, et al. Association between total sleep time and all cancer mortality: non-linear
dose-response meta-analysis of cohort studies. Sleep Med 2019 Aug;60:211-218. [doi: 10.1016/j.sleep.2019.03.026]
[Medline: 31182327]
21. Saeb S, Zhang M, Karr CJ, Schueller SM, Corden ME, Kording KP, et al. Mobile Phone Sensor Correlates of Depressive
Symptom Severity in Daily-Life Behavior: An Exploratory Study. J Med Internet Res 2015;17(7):e175 [FREE Full text]
[doi: 10.2196/jmir.4273] [Medline: 26180009]
22. Doryab A, Frost M, Faurholt-Jepsen M, Kessing L, Bardram J. Impact factor analysis: combining prediction with parameter
ranking to reveal the impact of behavior on health outcome. Pers Ubiquit Comput 2014 Sep 21;19(2):355-365. [doi:
10.1007/s00779-014-0826-8]
23. Frost M, Doryab A, Faurholt-Jepsen M, Kessing L, Bardram J. Supporting disease insight through data analysis: refinements
of the monarca self-assessment system. In: UbiComp '13: Proceedings of the 2013 ACM international joint conference on
Pervasive and ubiquitous computing. New York, NY: Association for Computing Machinery; 2013 Presented at: UbiComp
'13: The 2013 ACM International Joint Conference on Pervasive and Ubiquitous Computing; September, 2013; Zurich,
Switzerland p. 133-142. [doi: 10.1145/2493432.2493507]
24. Grünerbl A, Muaremi A, Osmani V, Bahle G, Ohler S, Tröster G, et al. Smartphone-based recognition of states and state
changes in bipolar disorder patients. IEEE J Biomed Health Inform 2015 Jan;19(1):140-148. [doi:
10.1109/JBHI.2014.2343154] [Medline: 25073181]
25. Wang R, Aung M, Abdullah S. CrossCheck: toward passive sensing and detection of mental health changes in people with
schizophrenia. 2016 Sep Presented at: Proceedings of the ACM International Joint Conference on Pervasive and Ubiquitous
Computing. Sept;. Heidelberg, Germany; 2016; Heidelberg, Germany p. 886-897. [doi: 10.1145/2971648.2971740]
26. Bae S, Ferreira D, Suffoletto B, Puyana JC, Kurtz R, Chung T, et al. Detecting Drinking Episodes in Young Adults Using
Smartphone-based Sensors. Proc. ACM Interact. Mob. Wearable Ubiquitous Technol 2017 Jun 30;1(2):1-36. [doi:
10.1145/3090051]
27. Low CA. Harnessing consumer smartphone and wearable sensors for clinical cancer research. NPJ Digit Med 2020;3:140
[FREE Full text] [doi: 10.1038/s41746-020-00351-x] [Medline: 33134557]
28. Panda N, Solsky I, Huang EJ, Lipsitz S, Pradarelli JC, Delisle M, et al. Using Smartphones to Capture Novel Recovery
Metrics After Cancer Surgery. JAMA Surg 2020 Feb 01;155(2):123-129 [FREE Full text] [doi: 10.1001/jamasurg.2019.4702]
[Medline: 31657854]
29. Low CA, Bovbjerg DH, Ahrendt S, Choudry MH, Holtzman M, Jones HL, et al. Fitbit step counts during inpatient recovery
from cancer surgery as a predictor of readmission. Ann Behav Med 2018 Jan 05;52(1):88-92 [FREE Full text] [doi:
10.1093/abm/kax022] [Medline: 29538623]
30. Strobel O, Neoptolemos J, Jäger D, Büchler MW. Optimizing the outcomes of pancreatic cancer surgery. Nat Rev Clin
Oncol 2019 Jan;16(1):11-26. [doi: 10.1038/s41571-018-0112-1] [Medline: 30341417]
31. Ferreira D, Kostakos V, Dey A. AWARE: mobile context instrumentation framework. Frontiers in ICT 2015 Apr 20;2:6.
[doi: 10.3389/fict.2015.00006]
32. Reeve BB, Mitchell SA, Dueck AC, Basch E, Cella D, Reilly CM, et al. Recommended patient-reported core set of symptoms
to measure in adult cancer treatment trials. J Natl Cancer Inst 2014 Jul;106(7):dju129 [FREE Full text] [doi:
10.1093/jnci/dju129] [Medline: 25006191]
33. Cleeland CS, Mendoza TR, Wang XS, Chou C, Harle MT, Morrissey M, et al. Assessing symptom distress in cancer
patients: the M.D. Anderson Symptom Inventory. Cancer 2000 Oct 01;89(7):1634-1646. [Medline: 11013380]
34. Tedesco S, Sica M, Ancillao A, Timmons S, Barton J, O'Flynn B. Validity Evaluation of the Fitbit Charge2 and the Garmin
vivosmart HR+ in Free-Living Environments in an Older Adult Cohort. JMIR Mhealth Uhealth 2019 Jun 19;7(6):e13084
[FREE Full text] [doi: 10.2196/13084] [Medline: 31219048]
35. Vega J, Li M, Aguillera K, Goel N, Joshi E, Durica KC, et al. RAPIDS: Reproducible Analysis Pipeline for Data Streams
Collected with Mobile Devices. J Med Internet Res Preprints. URL: https://preprints.jmir.org/preprint/23246 [accessed
2020-08-18]
36. RAPIDS. URL: https://www.rapids.science [accessed 2021-02-21]
37. Low C, Li M, Vega J, Durica K, Ferreira D, Tam V, et al. carissalow/rhythms-population: v1.0.1. 2021 Mar 17. URL:
https://zenodo.org/record/4613698#.YHixf5NKiu5
38. Lundberg SM, Erion G, Chen H, DeGrave A, Prutkin JM, Nair B, et al. From Local Explanations to Global Understanding
with Explainable AI for Trees. Nat Mach Intell 2020 Jan;2(1):56-67 [FREE Full text] [doi: 10.1038/s42256-019-0138-9]
[Medline: 32607472]
39. Low CA, Dey AK, Ferreira D, Kamarck T, Sun W, Bae S, et al. Estimation of Symptom Severity During Chemotherapy
From Passively Sensed Data: Exploratory Study. J Med Internet Res 2017 Dec 19;19(12):e420 [FREE Full text] [doi:
10.2196/jmir.9046] [Medline: 29258977]
40. Bennett AV, Reeve BB, Basch EM, Mitchell SA, Meeneghan M, Battaglini CL, et al. Evaluation of pedometry as a
patient-centered outcome in patients undergoing hematopoietic cell transplant (HCT): a comparison of pedometry and
https://cancer.jmir.org/2021/2/e27975 JMIR Cancer 2021 | vol. 7 | iss. 2 | e27975 | p. 8
(page number not for citation purposes)
XSL• FO
RenderXJMIR CANCER Low et al
patient reports of symptoms, health, and quality of life. Qual Life Res 2016 Mar;25(3):535-546. [doi:
10.1007/s11136-015-1179-0] [Medline: 26577763]
41. Innominato PF, Komarzynski S, Palesh OG, Dallmann R, Bjarnason GA, Giacchetti S, et al. Circadian rest-activity rhythm
as an objective biomarker of patient-reported outcomes in patients with advanced cancer. Cancer Med 2018
Sep;7(9):4396-4405 [FREE Full text] [doi: 10.1002/cam4.1711] [Medline: 30088335]
42. Gustavell T, Sundberg K, Langius-Eklöf A. Using an Interactive App for Symptom Reporting and Management Following
Pancreatic Cancer Surgery to Facilitate Person-Centered Care: Descriptive Study. JMIR Mhealth Uhealth 2020 Jun
17;8(6):e17855 [FREE Full text] [doi: 10.2196/17855] [Medline: 32554375]
Abbreviations
AUC: area under the ROC curve
LightGBM: light gradient boosting machine
PRO: patient-reported outcome
RAPIDS: Reproducible Analysis Pipeline for Data Streams
ROC: receiver operating characteristic
SHAP: SHapley Additive exPlanations
SVM SMOTE: support vector machine synthetic minority over-sampling technique
Edited by D Vollmer Dahlke; submitted 15.02.21; peer-reviewed by P Innominato, W Wood; comments to author 08.03.21; revised
version received 17.03.21; accepted 29.03.21; published 27.04.21
Please cite as:
Low CA, Li M, Vega J, Durica KC, Ferreira D, Tam V, Hogg M, Zeh III H, Doryab A, Dey AK
Digital Biomarkers of Symptom Burden Self-Reported by Perioperative Patients Undergoing Pancreatic Surgery: Prospective
Longitudinal Study
JMIR Cancer 2021;7(2):e27975
URL: https://cancer.jmir.org/2021/2/e27975
doi: 10.2196/27975
PMID:
©Carissa A Low, Meng Li, Julio Vega, Krina C Durica, Denzil Ferreira, Vernissia Tam, Melissa Hogg, Herbert Zeh III, Afsaneh
Doryab, Anind K Dey. Originally published in JMIR Cancer (https://cancer.jmir.org), 27.04.2021. This is an open-access article
distributed under the terms of the Creative Commons Attribution License (https://creativecommons.org/licenses/by/4.0/), which
permits unrestricted use, distribution, and reproduction in any medium, provided the original work, first published in JMIR Cancer,
is properly cited. The complete bibliographic information, a link to the original publication on http://cancer.jmir.org/, as well as
this copyright and license information must be included.
https://cancer.jmir.org/2021/2/e27975 JMIR Cancer 2021 | vol. 7 | iss. 2 | e27975 | p. 9
(page number not for citation purposes)
XSL• FO
RenderXYou can also read