Can Multimodal Sensing Detect and Localize Transient Events?
←
→
Page content transcription
If your browser does not render page correctly, please read the page content below
Can Multimodal Sensing Detect and Localize Transient
                                                                     Events?
                                              Kasthuri Jayarajah‡ , Vigneshwaran Subbaraju∗ , Noel Athaide† , Lakmal Meegahapola‡ ,
                                                                        Andrew Tan‡ , and Archan Misra‡
                                                                        ‡
                                                                            Singapore Management University, Singapore
                                                          ∗
                                                              Agency for Science Technology and Research (A*STAR), Singapore
arXiv:1904.02570v1 [eess.SP] 3 Apr 2019

                                                                                             ABSTRACT
                                          With the increased focus on making cities “smarter”, we see an upsurge in investment in sensing technologies
                                          embedded in the urban infrastructure. The deployment of GPS sensors aboard taxis and buses, smartcards
                                          replacing paper tickets, and other similar initiatives have led to an abundance of data on human mobility, gen-
                                          erated at scale and available real-time. Further still, users of social media platforms such as Twitter and LBSNs
                                          continue to voluntarily share multimedia content revealing in-situ information on their respective localities. The
                                          availability of such longitudinal multimodal data not only allows for both the characterization of the dynamics
                                          of the city, but also, in detecting anomalies, resulting from events (e.g., concerts) that disrupt such dynamics,
                                          transiently. In this work, we investigate the capabilities of such urban sensor modalities, both physical and social,
                                          in detecting a variety of local events of varying intensities (e.g., concerts) using statistical outlier detection tech-
                                          niques. We look at loading levels on arriving bus stops, telecommunication records and taxi trips, accrued via
                                          the public APIs made available through the local transport authorities from Singapore and New York City, and
                                          Twitter/Foursquare check-ins collected during the same period, and evaluate against a set of events assimilated
                                          from multiple event websites. In particular, we report on our early findings on (1) the spatial impact evident via
                                          each modality (i.e., how far from the event venue is the anomaly still present), and (2) the utility in combining
                                          decisions from the collection of sensors using rudimentary fusion techniques.

                                                                                       1. INTRODUCTION
                                          An extraordinary amount of urban transportation and mobility data are being increasingly collected, and made
                                          publicly available, by cities across the globe. Such data encompasses both public/municipal agencies and private
                                          companies (e.g., telcos and social media). Examples include (a) public transportation-related data such as the
                                          trajectories and occupancy levels of buses, the GPS-derived movement trajectories & trip records of taxis and
                                          the occupancy levels of parking garages; (b) large-scale, individual-level movement patterns, obtained from Call
                                          Detail Records, by telecom companies; and (c) user-generated text, image and location data (e.g., via check-
                                          ins) posted on social media platforms such as Foursquare and Twitter. Such data effectively provide multiple
                                          observation modes to capture the collective mobility dynamics of a city.
                                              Although an abundance of multi-modal data is now available to study urban mobility, there’s a lack of
                                          systematic studies that investigate the utility in relying on such multiple modes. For instance, many past works
                                          that study urban dynamics relied on single sources – e.g., taxi-data based studies,1, 2 social media-data based
                                          studies3, 4 – and tend to treat mobility data sources as substitutes, but the fundamental question of whether they
                                          are in fact perfect substitutes, or is there utility in combining multiple sensor modes, is largely unexplored. In
                                          this work, we take the case of urban event detection, a key problem extensively researched in recent years.1, 2, 5, 6
                                             †
                                               Work carried out while a Senior Research Engineer at Singapore Management University. Further author information:
                                             (Send correspondence to A. M.)
                                             A.M.: E-mail: archanm@smu.edu.sg, Telephone: +65 68085202
                                             K.J.: kasthurij.2014@smu.edu.sg, V.S.: vigneshwaran subbaraju@sbic.a-star.edu.sg,
                                             N.A.:athaiden@gmail.com, L.M.: lakmalm@smu.edu.sg, A.T.: andrewtan@smu.edu.sg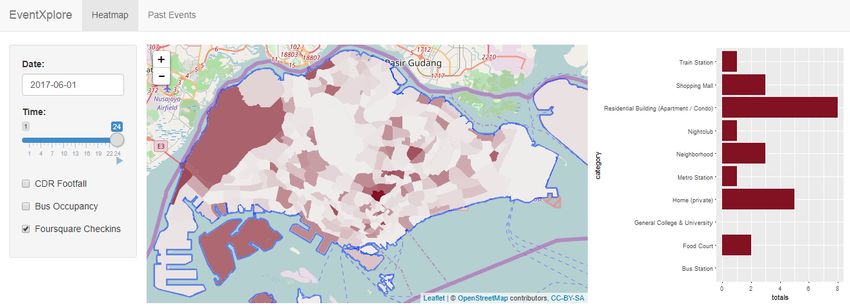
Our conjecture is that different individual modalities differ in their discriminatory power, and that they exhibit
different levels of spatiotemporal sensitivity to urban disruptions. For instance, it is natural to assume that most
people will arrive at an event venue prior to its start time, and that the resulting spikes in arrival rates can thus
help determine the onset of the event. However, it is possible that different transportation modes exhibit slightly
different temporal properties–e.g., people using public buses and trains arrive may slightly earlier (even more in
advance of the start time) than people using taxis and private vehicles.
   To this end, we curate multiple transport-related and social media datasets from two cities, Singapore and
New York City, and collect a set of over 150 events from a number of news and event websites to answer three key
questions: (1) are individual mobility sources (both social and physical) reasonable choices for detecting urban
events?, (2) are there differences in the spatiotemporal sensitivity of the individual sources?, and finally, (3) can
the use of simple fusion techniques help in improved performance for detection over single-source modalities? In
addition to providing insights on these questions, we propose and build EventXplore (illustrated in Figure 1), a
prototype web application that demonstrates the use of such disparate urban mobility data sources in detecting
and visualizing events and semantically annotating them using user-generated textual content on social media.
   In this work, we make the following contributions:

  1. Using real world, city-scale datasets from two major cities (Singapore and New York City), we investigate
     the ability of multiple urban data sources to detect urban events, of varying categories and scales, using
     statistical outlier detection tests. In particular, using 150+ events curated across both NYC and Singapore,
     we demonstrate that data sources differ in their detection accuracy, and in their the ability to localize an
     event spatially and temporally. We observe recall rates of 30 - 50 % in locating an event within 1.5 km of
     its venue, and up to 80% within 4 km. Further, we also find that the sensor modalities are equally good at
     detecting events prior to their scheduled start times, a possible result from the natural tendency of people
     in arriving earlier to an event.
  2. Using a number of rudimentary fusion techniques, we explore the utility in fusing individual sensor modali-
     ties and conclude that fusing at the decision level (e.g., majority voting over decisions made independently
     per sensor) performs better than fusing at the data-level (e.g., averaging of outlier scores across the multi-
     ple sensors) in the settings we consider. However, the significantly weaker performance of the combination
     sensors in comparison to the best performing individual sensor highlights the need for better fusion algo-
     rithms.
  3. We propose a framework for such ingestion and fusion of multimodal urban data and prototype EventXplore,
     a system for detecting events from multimodal data that provides several analytics views and semantic
     annotation.

   In the remainder of this paper, we first describe the datasets considered in this work in Section 2, discuss
the pipeline of event detection that we propose in Section 3. We share our current findings in Section 4, discuss
limitations and future work in Section 5, briefly summarize related work and conclude in Section 6.

                                Figure 1: Landing Page View of the EventXplore.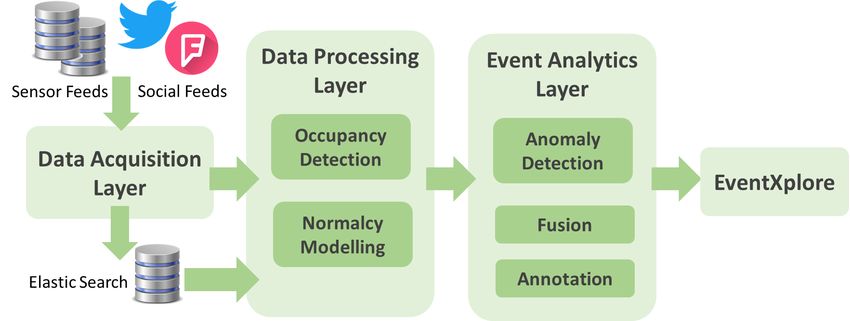
2. PRELIMINARIES
In this section, we first describe the datasets considered in this work, and summarize briefly results from statistical
tests that demonstrate that the multiple datasets are not substitutes of each other and may have additional value
of information than relying solely on single sources of data.

2.1 Dataset Description
In this work, we rely primarily on two classes of datasets: (1) physically-sensed and (2) from social media.
   Physically-sensed data: In the case of Singapore, we focus on events during the period of May - June 2017.
We collected CDR records of a major telecommunications service provider through their APIs at DataSpark ∗ ;
in particular, we collected information on Discrete Visits which is the number of people entering a zone at
hourly intervals throughout the day. Each record is a tuple containing < z, t, u > where z is an administrative
boundary (i.e., a subzone † ), t is an hourly window and u is the total number of unique users observed at that
zone for that period. In addition, we collected occupancy levels of incoming buses for over 260 bus services
from over 130 bus stops island-wide using the publicly available DataMall API ‡ . Each record is a tuple <
busstopid, serviceid, timestamp, loading > where busstopid and serviceid identify the bus stop and the service,
respectively, and loading is a discrete number varying between 1 and 3 capturing the level of crowdedness of the
next bus scheduled to arrive at that stop. The API is refreshed every 2-3 minutes, with timestamp capturing
the most recent refresh instant.
   In the case of New York City, we focused on events that happened during the year of 2013, and we obtain
time-stamped records of dropoffs and pickups by yellow taxis for the period of January 2013 - December 2013,
made available publicly by the New York City Taxi and Limousine Commission § . Each record is a tuple
< px , py , tp , dx , dy , td > where (px , py ) and (dx , dy ) are the GPS coordinates of the pickup and dropoff of a single
taxi trip, respectively, and tp and td are the corresponding timestamps. We aggregate the pickup and dropoff
points to the corresponding Census tracts ¶ , where a tract typically houses at most 15000-16000 residents k .
   Social Media data: For both Singapore and NYC, we collect check-ins from the popular location-based
social network Foursquare∗∗ . For Singapore, we crawl public check-ins that were re-shared as Tweets †† by
users identified as being from Singapore, and that were visible publicly. The public Tweets were collected
using the Streaming API. In the case of NYC, we use publicly available data.7, 8 Each check-in is a tuple
< venueid, timestamp, vx , vy , vc > where a venue or location is identified by its venueid whose latitude, longitude,
and category are vx , vy and vc , respectively, and timestamp is when a user checked-into that venue. The
categories fall within Foursquare’s API of hierarchical categories, and can be obtained by querying the Foursquare
API ‡‡ . Due to the sparsity of venue-level check-ins, we aggregate check-ins to their respective administrative
boundary (e.g., subzone or Census tract) in our analyses.
    Events data: We focus on a set of 15 manually curated events from various event and news portals from
the period of May-June 2017 in Singapore, and over 160 events in New York City during the whole year of
2013. We further filter the list of events to retain only those “localized” events that were both geographically
and temporally confined—for example, public holidays were removed as they typically cause multiple events
distributed throughout the day. For multi-day events, we focus on the detection of the start time on the first
day of the event. We restrict our analyses to 85 subzones in the greater Central Business District (CBD) in
Singapore and 288 Census Tracts within the Manhattan Borough in NYC.
   In Table 1, we summarize the datasets used in this work.
   ∗
     https://datasparkanalytics.com
   †
     https://data.gov.sg/dataset/master-plan-2014-subzone-boundary-web
   ‡
     https://www.mytransport.sg/content/mytransport/home/dataMall.html
   §
     http://www.nyc.gov/html/tlc/html/about/trip_record_data.shtml
   ¶
     http://maps.nyc.gov/census/
   k
     https://data.cityofnewyork.us/City-Government/2010-NYC-Population-by-Census-Tracts/si4q-zuzm
   ∗∗
      https://developer.foursquare.com/
   ††
      https://developer.twitter.com
   ‡‡
      https://developer.foursquare.com/categorytree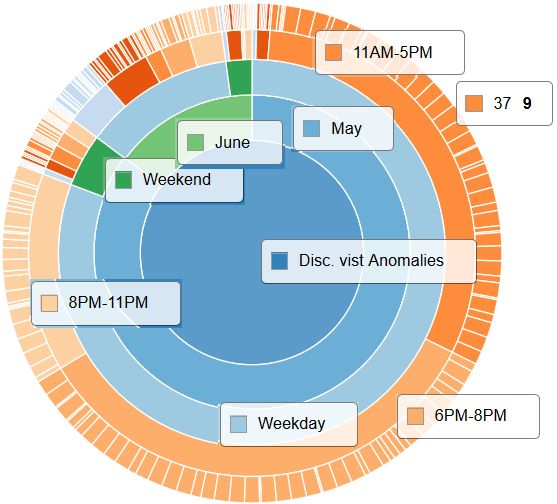
Observation                                 Spatial              Temporal
 City                                    Data Source                                                  Total Records
                      Period                                  Resolution             Resolution
 Singapore         May - June 2017           CDR                subzone                hourly             124,440
                                          Bus Arrival        260 Bus Stops            2-3 mins           16 million
                                           Check-ins         20,801 Venues           continuous           201,863
                       January -
 New York City                               Taxi              continuous             continuous      143 million trips
                    September 2013
                                          Check-ins           29,487 venues           continuous          325,161

                               Table 1: Summary of Datasets Used in this Work.

                        (a) System Overview.                                      (b) Sunburst view of anomalies

2.2 Why use Multiple Sources?
To understand whether the use of multiple data sources can in fact provide an information gain, as opposed to
relying on a single source, we performed a series of Granger-causality tests9 between each pair of data source.
This test quantifies the ability of a time series x to forecast another time series y. Operationally, we compare the
power of x in predicting y compared to predicting based on past values of y alone. The p− values from a Wald
test between the two models is tabulated in Table 2 for the datasets from NYC as an illustration. A p−value
≥ 0.05 means we reject the null hypothesis that the time series x has statistically significant explanatory power
over time series y. We see that in all cases that this is in fact the case, and that the multiple data sources may
capture different aspects of urban mobility. This is an important finding, as it indicates the likely insufficiency
of prior methods that have focused on detecting events solely using one type of data source.

                                              Checkins         Dropoff          Pickups
                              Checkins             -         0.605 (0.292)    0.599 (0.287)
                              Dropoff        0.565 (0.301)         -          0.585 (0.291)
                              Pickup         0.611 (0.286)   0.581 (0.299)          -

Table 2: Summary of p-values from Granger Causality Tests. The average (std. dev) of p-values, all ≥ 0.05,
show that the null hypothesis that the individual data sources can forecast each other can be rejected at 5%
confidence level.

                                     3. FRAMEWORK OVERVIEW
In the design and implementation of our framework, we focus on the following key components illustrated in
Figure 2a.
    Data Acquisition Layer: This acts as the unifying layer responsible for the curation of data (e.g., via API
requests from DataSpark and DataMall, crawler scripts for Tweets and Foursquare checkins, etc.) whilst handling
differences in the various attributes, stipulated query limits and temporal granularity. We use ElasticSearch10
as the primary data storage service for data sources with large volumes and frequent updates (e.g., bus arrival
data is refreshed every 2-3 minutes).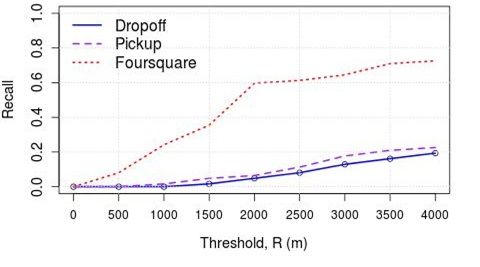
Data Processing Layer: At this stage, two key functionalities are performed. The Occupancy Detection
component, extracts the occupancy level for each data source, the definition of which varies from source to source.
In our setting, the occupancy level of CDR, bus arrival, taxi and Foursquare were extracted as the number of
discrete visitors, average loading level across all services served by a bus stop, number of taxi pickups/dropoffs,
and the number of unique users checking in, respectively. For each source, the aggregated occupancy level cs,w,d
at location l, during window w, on day type d was summarized. For example, for CDR data, the set of all s
were the 85 subzones whereas for bus data, this was a sample of 130 services spanning 260 bus stops within the
85 zones. The window w was hourly in the case of CDR (limited by the granularity at which the API provides
data), whereas we considered bins of 15 minutes for the remaining sources. The day type was used to differentiate
between weekdays and weekends. We assume that cs,w,d follows a normal distribution similar to past work11 and
confirm this using the Shapiro-Wilk test for normality with data corresponding to each Census tract and hour
of the day (across all weekdays) over the entire period of observation considered to be samples from the same
distribution. For instance, in the NYC case, 95.63% and 83.15% of the resulting p−values were greater than
0.05 suggesting that the null hypothesis that the distributions are normal cannot be rejected at 5% significance
level for taxi dropoffs and pickups, respectively. However, similar evidence was not found for check-ins and we
acknowledge the need for alternative outlier representations. We defer such investigations to future work. The
Normalcy Modeling component computes statistical measures such as the mean and standard deviation of cs,w,d
and the normalized z-score values for each observation.
Event Analytics Layer: The Anomaly Detection component uses statistical outlier detection techniques
to declare an observation (i.e., a tuple < s, w, d > from a data source as anomalous. We compare two approaches
here: (1) based on a static threshold on the z-score, and (2) based on the Seasonal Hybrid ESD (S-H-ESD)12 on
the computed z-scores. The latter has been shown to be good at detecting both global and local anomalies as
the algorithm takes into account seasonal variations and trends. We use the implementation available at https:
//github.com/twitter/AnomalyDetection in this work. The Sensor Fusion component ingests observations
tagged as anomalous from the individual data sources to declare a fused decision. We consider a number of
baseline fusion methods such as majority voting and averaging.
The Semantic Annotation component mines the categories of Foursquare venues and keywords from Tweets
to add semantics to detected events similar to.6 For time bins and locations that the system declares as outliers,
we mine the types of Foursquare venues that received the most number of check-ins, and hashtags from Twitter
that had the highest T F − IDF scores for annotating the anomalies. We defer the evaluation of this component
to future work.
3.1 Web Application EventXplore
The web application was prototyped using RShiny baed on the framework described and entails the following
views.
Event Landscape View: This view, shown in Fig 1, provides the user a quick snapshot of the events
landscape all over Singapore in the form of a series of images in time-lapse. The Foursquare venue types that
receive the highest number of check-ins during that time are also visualized.
Summary of anomalies: This interactive view, modeled as a Sunburst diagram, is shown in Fig 2b, and
it provides a summary of the anomalies observed in the CDR data. The first three concentric rings represents
time units such as month, weekday/weekend and time-bins. The last ring represents the subzone and the count
of anomalies. The size of a slice in a ring is proportional to the corresponding number of anomalies.
Data Layer View: This view provides the user with an interface to add/remove data sources used to
perform the analysis.
Past Events View: This view, provides the user with overview of events that were detected in past. In
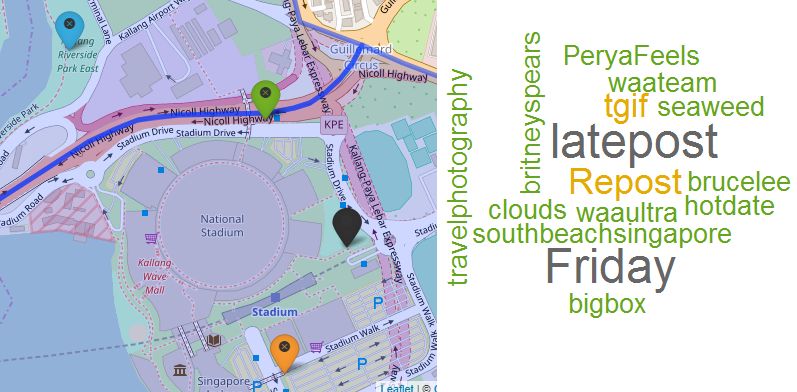
Figure 3, we share a screenshot from the EventXplore dashboard which shows the localization accuracy of each
source compared to the actual event venue for one of the largest events from our list – i.e., the Britney Spears
concert.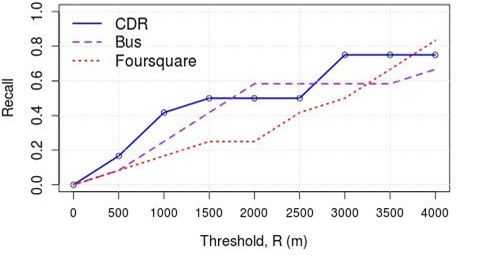
Figure 3: Left -Estimated and actual event venues of the Britney Spears Concert. Black - Actual, Orange -
CDR, Green - Bus, Blue - Foursquare. Right-Word cloud during the Britney Spears Concert. Hashtags like
“BritneySpears” were present.
                Date         Time       Name                                                  Scale
               10 May      All day    Vesak Day 3 step 1 bow procession                       Large
               3-4 Jun    PM peak Dragon Boat Festival                                        Medium
               10 Jun      All day    Ultra Singapore Electronic Music Festival               Medium
               17-Jun     PM peak Bark and Kisses: A dog cafe adventure                       Small
             17-18 Jun    PM peak Urban Camping                                               Small
               17 Jun      All day    Food Expo                                               Medium
               24-Jun      All day    Hari Raya Market                                        Large
               24-Jun     Off-peak Dreamworks day                                             Small
               14-Jun      All day    Natl. Inter-School Dragon Boat Championships            Medium
               16-Jun     PM peak ADAC 2017 music concert                                     Small
               30-Jun     PM peak Britney Spears music concert                                Large
             16-17Jun     PM peak OMM:Hensel and Gretel                                       Medium
               1-4 Jun     All day    Singapore Intl. Piano Festival                          Small
              9-11 Jun     All day    Health Fiesta                                           Small
                9 Jun     PM Peak A-MEI¡Utopia 2.0 Carnival¿ World Tour                       Medium
              9-11 Jun     All day    Doctors without borders, Sg. Intl. Film Festival        Small
                         Table 3: Canonical set of events in Singapore in May/June ’17

                                               4. EVALUATION
In this section, we describe our evaluation methodology and share our preliminary findings. We first take the
example of CDR data from Singapore and explore the use of short vs. wide observation windows with respect to
their ability to detect events of different scales. We then explore the ability of the different sensor modalities in
detecting and localizing events spatially and temporally. Finally, we investigate the utility in fusing the multiple
modalities using baseline fusion techniques.

4.1 Ground-truth Events
To validate our approach, we consulted event-related portals on the internet from both Singapore and New York
City, in the months of May and June 2017 for the former, and throughout the year of 2013 for the latter. Based
on our search, we selected a few large scale, small scale and medium scale events. Table 3 lists the limited
set of events we considered in the context of Singapore which illustrates the type of events we considered for
detection. In the evaluation in Section 4.3, we focus on a subset of “localized” events that were confined in
location and duration– for example, removing holidays as they were typically associated with multiple day-long
events, distributed throughout the city. For multi-day events, we focus on the detection of the start time on the
first day of the event.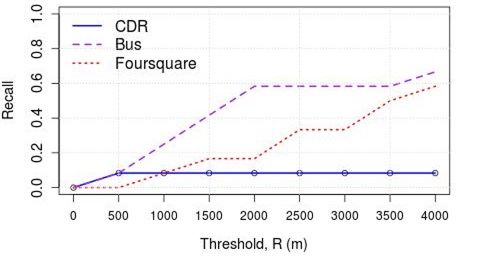
4.2 Choosing the Temporal Granularity
We first evaluate the ability of CDR data (in Singapore) to localize events with observation windows of several
sizes. The analysis was restricted to the 85 subzones as described earlier. Although the data is available at
an hourly granularity, we aggregated the discrete visits from each subzone and day into 5 time-bins spanning
multiple hours: 00:00-06:00AM, 07:00-10:00AM (AM-Peak), 11:00AM-05:00PM (Off-Peak), 06:00-08:00PM (PM-
Peak) and 09:00-11:00PM. Such binning allows us to investigate the utility of a larger observation window that
is more attuned to the natural “rhythm” of the city (e.g., morning peak hours, lunch hours, etc.)
    The median, first quartile, third quartile, inter-quartile range and z-score values were obtained for the week-
days and weekends, separately, for each subzone. If a particular value for a given time-bin, day and subzone
was away from the first or third quartile by more than 1.5*times the IQR, it was declared an outlier. This
way, a total of 864 outliers were identified across 42 weekdays, 5 time-bins and 85 subzones. Among these, it
was also found that 747 were in the month of May, with more outliers observed during the first two weeks of
May. The outliers were also overwhelmingly on the lower side showing diminished flow of people across many
of the zones. This may be attributed to the holiday period (1 May and 10 May being public holidays) when
several of the residents could have taken a break from their regular life. A similar effect could be found around
the public holiday on June 25. A key takeaway here was that although the large time windows are useful in
detecting large-scale anomalies such as holidays, they fail to detect anomalies that span only over a few hours
(e.g., concerts). Hence, in the following analyses, we continue to use the finest temporal granularity in order to
capture both small and large events.

4.3 Spatio-temporal Sensitivity of Individual Sources
It is our conjecture in this work that different sensor modalities, albeit all capturing aggregated mobility dynamics,
will have observable differences in terms of their ability to detect urban anomalies. In this section, we seek answers
for two specific questions:

  1. Spatial localization - Does the event detection capability and the accuracy to which the event can be
     localized vary across the multiple sources?

  2. Temporal localization - Are the sources capable of detecting the onset of an event (closer to the start of an
     event when the crowds draw closer to the event venue) as it occurs?

    We measure the detection accuracy in terms of recall (i.e., proportion of events detected out of the known
events (e.g., in Table 3 for Singapore). We declare that an event is recalled by a source if the following criteria
is met: (1) a location s is an outlier for the day type d and window w corresponding to the event date and time,
and (2) s is within a radius R from the event venue. To understand the temporal bias, we vary window w as the
same hour as the event start time, and an hour prior to that. We vary R between 0 and 4000 meters. In Figure
4 and 5, we plot the distance threshold R on x−axis and the recall on the y−axis for each source, for Singapore
and NYC, respectively. We make the following observations:

  1. In Singapore, we note that the physical sensors, i.e., CDR and Bus Arrival, consistently perform better
     with the z − score based anomaly declaration. Nearly 40% of the events were detected with a localization
     error of less than 1.5 km with both CDR and Bus loading level as observed during the starting hour of the
     event.
  2. All three sensors show predictive capability with the events being detected an hour earlier than the sched-
     uled start time – however, we note that the recall is significantly better for the physical sensors. For
     instance, we observe a 10% improvement in detection for CDR, for the same distance threshold of 1.5 km.

  3. However, the detection capability drops significantly with the ESD-based approach for the physical sensors,
     whilst the performance of the social sensor is seen to have improved marginally.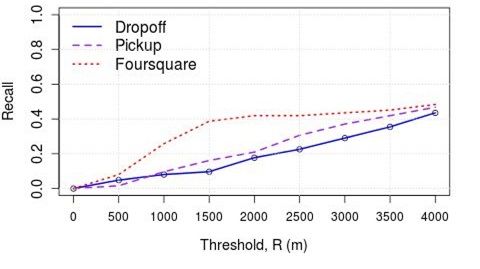
(a) Outlier declared with z−score ≥ 3, at the event start    (b) Outlier declared with z−score ≥ 3, at an hour prior
hour.                                                        to the event start.

 (c) Outlier declared with Seasonal Hybrid ESD, at the      (d) Outlier declared with Seasonal Hybrid ESD, at an hour
 event start hour.                                          prior to the event start.
Figure 4: The trade-off between event recall and localization accuracy during (1) the event start hour and (2)
and prior to the start, using the static threshold-based approach vs. ESD-based approach, on the Singapore
datasets.

   4. Unlike the observations in Singapore, venue check-ins performed the best in NYC, capturing at least 30% of
      the events within 1.5 km of the event venue during the event start hour. Consistent with our observations
      from Singapore, the detection capability is higher during the hour prior to the event. This validates our
      earlier hypothesis that the nature of people in arriving early for an event can in fact help detect events at
      their onset.
   5. Like Singapore, we see that, even in NYC, the physical sensors weaken in their ability with the ESD-based
      approach whilst the social sensor sees a significant boost. We believe that the bursty nature of social media
      check-ins/posts, i.e., low activity during normal days, and high bursts of activity during unusual days,
      makes it a better candidate for the ESD-based approach.
   6. We further note that the detection accuracy of the social sensor is starkly less in Singapore as opposed
      to with the NYC data – we believe that this may be due to the popularity of the platform during the
      initial years of its existence which coincides with the period of observation of the NYC setting. This may
      have resulted in denser check-in behavior during that time which may have influenced the observations.
      Understanding the impact of data sparsity, we believe, is an open question which we defer to future work
      for further analysis.

4.4 Fusing Multiple Sources
Finally, we investigate the efficacy of fusing the disparate sensor sources in the context of event detection, using
baseline methods. Following from the previous analysis, we now quantify the recall performance of the individual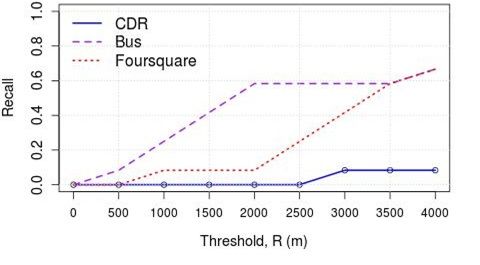
(a) Outlier declared with z−score ≥ 3, at the event start     (b) Outlier declared with z−score ≥ 3, at an hour prior
hour.                                                         to the event start.

 (c) Outlier declared with Seasonal Hybrid ESD, at the       (d) Outlier declared with Seasonal Hybrid ESD, at an hour
 event start hour.                                           prior to the event start.
Figure 5: The trade-off between event recall and localization accuracy during (1) the event start hour and (2)
and prior to the start, using the static threshold-based approach vs. ESD-based approach, on the New York City
datasets.

sensors against combinations of sensors in detecting events based on the z− scores. We fix the distance threshold
to R = 1.5km, and the threshold for declaring an observation as anomaly as S = 0.8 on the normalized z−
scores (effectively, scaling the absolute values of the scores to between 0 and 1). In Figure 6, we plot the recall
performance on the y−axis whilst the x−axis represents the mixture weight for the best performing sensor (i.e.,
CDR for Singapore, and Check-ins for New York City) assuming a weighted linear combination. Here, we fix
the weight of Check-ins and Dropoffs to 0.1, for Singapore and NYC, respectively, due to their low performance.
Whilst the dashed line represents the performance using the best individual sensor alone and the dotted purple
line represents the performance of the arithmetic mean of across the three sources. Majority voting, represented
by the dashed orange line, declares an anomaly when at least k out of N channels, individually, observe anomalies.
In our settings, k = 2 and N = 3, meaning at least two out of the three individual sensor modalities should have
observed an anomaly. We make the following key observations:

   1. In both settings, it is clear that a simple fusion techniques such as an average sensor which shows the
      weakest performance, does not suffice, and that this application requires more sensible forms of fusion.
   2. By repeating the analysis over different values for R (ranging between 500 m to 2 km) and s (0.7-0.9), we
      find that fusing at the decision level (e.g., majority voting over decisions made independently per sensor)
      performs better than fusing at the data-level (e.g., averaging of outlier scores across the multiple sensors)
      in the settings we consider. We plot the recall performance observed in the case of Singapore in Figure 7.
   3. Whilst the overall recall of majority voting is significantly less than that of the individual sensor, we believe
      that this also can help reduce false positives.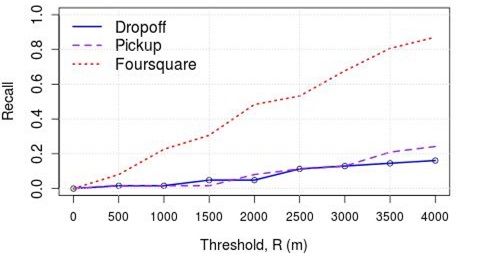
(a) Singapore.                                              (b) New York City
Figure 6: Recall performance with baseline sensor fusion techniques with distance threshold, R = 1.5km, and
threshold on normalized z− score, s = 0.6.

                                               5. DISCUSSION
Whilst the investigations carried out in this work are rudimentary, we find that the preliminary findings to
be encouraging. Event detection systems such as that described in this work can be useful to a multitude of
users. Clearly, such timely event detection is valuable in homeland security or civil defence operations, where
the authorities can identify potential anomalies or disturbances proactively and activate an appropriate response
protocol. In addition, such event detection has a wide variety of civilian/municipal uses as well. The general
public will be able to query for current events related to their interests (e.g., condo launch) or by locality (e.g.,
events in a specific neighborhood). This allows for serendipitous exploration of the event landscape, as an
alternative to advertised and/or ticketed events on channels such as SISTIC.13 Similarly, being able to visualize
the impact of a road incident allows commuters to change their routes such that they avoid congested and possibly
affected streets. On the other hand, for planning authorities, a generative model of spatiotemporal impact of
events based on systematic understanding of events via multiple modalities, may help reveal previously unseen
bottlenecks or unexpected anomalies that an event may cause. We next briefly describe some of the limitations
in our current studies and plans for future work.
   Current Limitations and Future Work: One of the key drawbacks in studies in event detection is the
unavailability of universal ground truth of events; i.e., although effort is made to scrape/extract events from
portals, news media and social media for evaluation, it is impractical to generate an exhaustive list. As a result,

                  Figure 7: Recall performance for varying R and s thresholds for Singapore.
most events captured are inherently large events which naturally get advertised more on multiple mediums. This
also leads to problems in evaluation in that we are only able to quantify the recall of detection, and not the
corresponding precision (i.e., whether or not our system falsely detected an event). A related problem is that
without complete ground-truth, it also becomes intractable to systematically tune the algorithm parameters.
For instance, we have chosen the threshold on z− scores as 3, or in the case of the ESD-based approach, we
have imposed that the top-2% of the observations are anomalies. However, it is not clear whether increasing or
decreasing these thresholds will, in fact, achieve better quality detection. Measures need to be taken for more
comprehensive ground truth collection as well as in finding alternative quantification of performance.
In addition, although presented as a component in the proposed framework, our current work does not
evaluate the quality of the semantic annotation of detected events in the current study. For example, the word
cloud in Figure 3 just represents the key Twitter words, but does not perform analyses (e.g., similar to Tf-Idf)
to determine which words are unusual or uncommon. The semantics can be useful in multiple ways; for e.g., in
disambiguating between multiple simultaneous, small scale events occurring in an area as opposed to a single,
large-scale event.
As we observe in our evaluation, a major takeaway is that traditional baseline fusion methods such as majority
voting lead to poor performance. This clearly warrants the need for more carefully constructed methodologies
for fusion that take in to account the spatiotemporal sensitivities of individual sensor modalities that we observe
and the granularity at which data is available. One particular direction of interest is the possibility of embedding
the city’s natural topological network (e.g., the street network) into the analytical framework. This is an open
question that we aim to tackle in future work.
6. RELATED WORK
Detecting anomalies in urban mobility patterns from physical sensors such as GPS traces and traffic cameras,1, 2
and CDR14, 15 is a well-studied topic in the context of optimizing traffic related infrastructure. CDR data have
also been used to detect unusual urban events (e.g., elections, emergency events, etc.16, 17 ). Previous works on
anomaly detection in transportation have looked at varied aspects of the problem including the detection of and
finding the root causes of the anomalies. Pang et al.18 detect anamolous regions using Likelihood Ratio Tests
and, Liu et al.19 proposed a formulation for detecting anomalous road blocks using observed minimum distortion
and associating causality using frequent subtree mining. Further still, Chawla et al.20 use Principal Component
Analysis to identify anomalous road sections. Further, in Jayarajah et al.21 and Nayak et al.,22 the authors
show that similar techniques can be used to detect anomalies based on occupancy levels indoors (e.g., campus
setting) as well as outdoors (e.g., city-scale).
Detecting events using social media is a particularly active area and has been since the initial work of Sakaki
et al.23 on detecting and tracking Earthquakes from user posted information on Twitter. Due to the low fraction
of geocoded posts from Twitter, recent works have studied Location-based Social Networks (e.g., Georgiev et
al.4 ) and image-rich platforms that are better geotagged (e.g., Jayarajah et al.24, 25 ).
However, these studies are largely unimodal in nature. A number of works that exploit multimodality have
emerged; however, these focus predominantly on anomalies related to traffic (e.g., accidents). For example, Wang
et al.26 utilized the combination of sparsely available GPS data and Tweets to measure the congestion along road
segments. Giridhar et al.6 make the case for identifying root causes for sensor anomalies using social media data.
Recently, multimodal sensing approaches have been attempted for urban event detection. Konishi et al.27 use
a two-step modeling process to predict irregularities (e.g., large scale events) from multimodal data. However,
this relies on App usage data that is only predictive of planned/anticipated events of large scale. Works such
as Gao et al.28 and Misra et al.29 acknowledge the need for systematic fusion of multimodal data sources and
discuss possible frameworks, as well as several challenges and opportunities.
7. CONCLUSION
In this work, we investigated the ability of multimodal urban data sources in detecting events both spatial and
temporally, across two Metropolitan cities: Singapore and New York City. We specifically considered 3 distinct
types of urban data sources: taxi & bus trajectories, social media feeds (from Foursquare and Twitter) and CDRdata obtained from telecom companies. Our results show that different sensing modes do have unique properties
and are not inherently substitutable. Moreover, the results from our preliminary investigations are encouraging
and show that appropriate fusion of the inferences from each sensing mode is likely to improve both the accuracy
(recall) of event detection and permit better spatiotemporal localization of such events. However, we acknowledge
the need for smarter sensor fusion techniques that account for the disparities in the spatiotemporal sensitivity
of individual sensor modalities.
ACKNOWLEDGMENTS
This material is based on research sponsored in part by the U.S. Army International Technology Center Pa-
cific (ITC-PAC), under Contract No. FA5209-17-C-0006, and partially supported by the National Research
Foundation, Prime Minister’s Office, Singapore under its International Research Centres in Singapore Funding
Initiative. The U.S. Government is authorized to reproduce and distribute reprints for Governmental purposes
notwithstanding any copyright notation thereon.
REFERENCES
[1] Chawla, S., Zheng, Y., and Hu, J., “Inferring the root cause in road traffic anomalies,” in [Data Mining
(ICDM), 2012 IEEE 12th International Conference on ], 141–150, IEEE (2012).
[2] Liu, W., Zheng, Y., Chawla, S., Yuan, J., and Xing, X., “Discovering spatio-temporal causal interactions
in traffic data streams,” in [Proceedings of the 17th ACM SIGKDD international conference on Knowledge
discovery and data mining ], 1010–1018, ACM (2011).
[3] Noulas, A., Shaw, B., Lambiotte, R., and Mascolo, C., “Topological properties and temporal dynamics of
place networks in urban environments,” in [Proceedings of the 24th International Conference on World Wide
Web], WWW ’15 Companion (2015).
[4] Georgiev, P., Noulas, A., and Mascolo, C., “The call of the crowd: Event participation in location-based
social services,” CoRR abs/1403.7657 (2014).
[5] Jayarajah, K., Subbaraju, V., Weerakoon, D., Misra, A., Tam, L. T., and Athaide, N., “Discovering
anomalous events from urban informatics data,” Proceedings of the SPIE, Volume 10190, id. 101900F
14 pp.(2017). 190 (2017).
[6] Giridhar, P., Amin, M. T., Abdelzaher, T., Wang, D., Kaplan, L., George, J., and Ganti, R., “Clarisense+:
An enhanced traffic anomaly explanation service using social network feeds,” Pervasive and Mobile Com-
puting 33, 140–155 (2016).
[7] Yang, D., Zhang, D., Chen, L., and Qu, B., “Nationtelescope: Monitoring and visualizing large-scale collec-
tive behavior in lbsns,” Journal of Network and Computer Applications 55, 170–180 (2015).
[8] Yang, D., Zhang, D., and Qu, B., “Participatory cultural mapping based on collective behavior in location
based social networks,” ACM Transactions on Intelligent Systems and Technology (2015). in press.
[9] Granger, C. W., “Investigating causal relations by econometric models and cross-spectral methods,” Econo-
metrica: Journal of the Econometric Society , 424–438 (1969).
[10] Elastic.co, “Restful, distributed search and analytics.” https://www.elastic.co/products/
elasticsearch (2017). Accessed: March 17, 2018.
[11] Barria, J. A. and Thajchayapong, S., “Detection and classification of traffic anomalies using microscopic
traffic variables,” IEEE Transactions on Intelligent Transportation Systems 12(3), 695–704 (2011).
[12] Vallis, O., Hochenbaum, J., and Kejariwal, A., “A novel technique for long-term anomaly detection in the
cloud.,” in [HotCloud], (2014).
[13] SISTIC.COM, “Singapore event and tickets online,” (Mar. 2013).
[14] Widhalm, P., Yang, Y., Ulm, M., Athavale, S., and González, M. C., “Discovering urban activity patterns
in cell phone data,” Transportation 42(4), 597–623 (2015).
[15] Yin, M., Sheehan, M., Feygin, S., Paiement, J.-F., and Pozdnoukhov, A., “A generative model of urban
activities from cellular data,” IEEE Transactions on Intelligent Transportation Systems (2017).[16] Dong, Y., Pinelli, F., Gkoufas, Y., Nabi, Z., Calabrese, F., and Chawla, N. V., “Inferring unusual crowd
events from mobile phone call detail records,” in [Joint European Conference on Machine Learning and
Knowledge Discovery in Databases ], 474–492, Springer (2015).
[17] Gundogdu, D., Incel, O. D., Salah, A. A., and Lepri, B., “Countrywide arrhythmia: emergency event
detection using mobile phone data,” EPJ Data Science 5(1), 25 (2016).
[18] Pang, L. X., Chawla, S., Liu, W., and Zheng, Y., “On mining anomalous patterns in road traffic streams,”
in [Proceedings of the 7th International Conference on Advanced Data Mining and Applications - Volume
Part II], ADMA’11.
[19] Liu, W., Zheng, Y., Chawla, S., Yuan, J., and Xing, X., “Discovering spatio-temporal causal interactions
in traffic data streams,” in [Proceedings of the 17th ACM SIGKDD International Conference on Knowledge
Discovery and Data Mining ], KDD ’11.
[20] Chawla, S., Zheng, Y., and Hu, J., “Inferring the root cause in road traffic anomalies,” in [Proceedings of
the 2012 IEEE 12th International Conference on Data Mining ], ICDM ’12.
[21] Jayarajah, K., Misra, A., Ruan, X.-W., and Lim, E.-P., “Event detection: Exploiting socio-physical in-
teractions in physical spaces,” in [Advances in Social Networks Analysis and Mining (ASONAM), 2015
IEEE/ACM International Conference on ], 508–513, IEEE (2015).
[22] Nayak, S., Misra, A., Jayarajah, K., Prasetyo, P. K., and Lim, E.-p., “Exploring discriminative features for
anomaly detection in public spaces,” in [SPIE Defense+ Security], 946403–946403, International Society for
Optics and Photonics (2015).
[23] “Earthquake shakes twitter users: Real-time event detection by social sensors,” in [Proceedings of the 19th
International Conference on World Wide Web ], WWW ’10.
[24] Jayarajah, K., Yao, S., Mutharaju, R., Misra, A., De Mel, G., Skipper, J., Abdelzaher, T., and Kolodny,
M., “Social signal processing for real-time situational understanding: A vision and approach,” in [Mobile Ad
Hoc and Sensor Systems (MASS), 2015 IEEE 12th International Conference on ], 627–632, IEEE (2015).
[25] Jayarajah, K. and Misra, A., “Can instagram posts help characterize urban micro-events?,” in [Information
Fusion (FUSION), 2016 19th International Conference on], 130–137, IEEE (2016).
[26] Wang, S., He, L., Stenneth, L., Philip, S. Y., Li, Z., and Huang, Z., “Estimating urban traffic congestions
with multi-sourced data,” in [Mobile Data Management (MDM), 2016 17th IEEE International Conference
on], 1, 82–91, IEEE (2016).
[27] Konishi, T., Maruyama, M., Tsubouchi, K., and Shimosaka, M., “Cityprophet: city-scale irregularity predic-
tion using transit app logs,” in [Proceedings of the 2016 ACM International Joint Conference on Pervasive
and Ubiquitous Computing ], 752–757, ACM (2016).
[28] Gao, M., Singh, V. K., and Jain, R., “Eventshop: From heterogeneous web streams to personalized situation
detection and control,” in [Proceedings of the 4th Annual ACM Web Science Conference ], WebSci ’12.
[29] Misra, A., Jayarajah, K., Nayak, S., Prasetyo, P. K., and Lim, E.-p., “Socio-physical analytics: challenges
& opportunities,” in [Proceedings of the 2014 workshop on physical analytics], 19–24, ACM (2014).You can also read


