Real-Time Forecasting of the COVID-19 Outbreak in Chinese Provinces: Machine Learning Approach Using Novel Digital Data and Estimates From ...
←
→
Page content transcription
If your browser does not render page correctly, please read the page content below
JOURNAL OF MEDICAL INTERNET RESEARCH                                                                                                              Liu et al

     Original Paper

     Real-Time Forecasting of the COVID-19 Outbreak in Chinese
     Provinces: Machine Learning Approach Using Novel Digital Data
     and Estimates From Mechanistic Models

     Dianbo Liu1,2*, PhD; Leonardo Clemente1,2,3*, MSc; Canelle Poirier1,2*, PhD; Xiyu Ding1,4, MSc; Matteo Chinazzi5,
     PhD; Jessica Davis5, BSc; Alessandro Vespignani5,6, PhD; Mauricio Santillana1,2,4, PhD
     1
      Computational Health Informatics Program, Boston Children’s Hospital, Boston, MA, United States
     2
      Department of Pediatrics, Harvard Medical School, Boston, MA, United States
     3
      Tecnologico de Monterrey, Monterrey, Mexico
     4
      Harvard TH Chan School of Public Health, Boston, MA, United States
     5
      Laboratory for the Modeling of Biological and Socio-technical Systems, Northeastern University, Boston, MA, United States
     6
      ISI Foundation, Turin, Italy
     *
      these authors contributed equally

     Corresponding Author:
     Mauricio Santillana, PhD
     Computational Health Informatics Program
     Boston Children’s Hospital
     300 Longwood Avenue
     Landmark 5th Floor East
     Boston, MA, 02215
     United States
     Phone: 1 (617) 919 1795
     Email: msantill@g.harvard.edu

     Related Article:
     This is a corrected version. See correction statement in: https://www.jmir.org/2020/9/e23996/

     Abstract
     Background: The inherent difficulty of identifying and monitoring emerging outbreaks caused by novel pathogens can lead to
     their rapid spread; and if left unchecked, they may become major public health threats to the planet. The ongoing coronavirus
     disease (COVID-19) outbreak, which has infected over 2,300,000 individuals and caused over 150,000 deaths, is an example of
     one of these catastrophic events.
     Objective: We present a timely and novel methodology that combines disease estimates from mechanistic models and digital
     traces, via interpretable machine learning methodologies, to reliably forecast COVID-19 activity in Chinese provinces in real
     time.
     Methods: Our method uses the following as inputs: (a) official health reports, (b) COVID-19–related internet search activity,
     (c) news media activity, and (d) daily forecasts of COVID-19 activity from a metapopulation mechanistic model. Our machine
     learning methodology uses a clustering technique that enables the exploitation of geospatial synchronicities of COVID-19 activity
     across Chinese provinces and a data augmentation technique to deal with the small number of historical disease observations
     characteristic of emerging outbreaks.
     Results: Our model is able to produce stable and accurate forecasts 2 days ahead of the current time and outperforms a collection
     of baseline models in 27 out of 32 Chinese provinces.
     Conclusions: Our methodology could be easily extended to other geographies currently affected by COVID-19 to aid decision
     makers with monitoring and possibly prevention.

     (J Med Internet Res 2020;22(8):e20285) doi: 10.2196/20285

     http://www.jmir.org/2020/8/e20285/                                                                   J Med Internet Res 2020 | vol. 22 | iss. 8 | e20285 | p. 1
                                                                                                                        (page number not for citation purposes)
XSL• FO
RenderX
JOURNAL OF MEDICAL INTERNET RESEARCH                                                                                                       Liu et al

     KEYWORDS
     COVID-19; coronavirus; digital epidemiology; modeling; modeling disease outbreaks; emerging outbreak; machine learning;
     precision public health; machine learning in public health; forecasting; digital data; mechanistic model; hybrid simulation; hybrid
     model; simulation

                                                                           outbreaks [22,23], our method is capable of reliably forecasting
     Introduction                                                          COVID-19 activity even when limited historical disease activity
     First detected in Wuhan, China, in December 2019, severe acute        observations are available. From a methodological perspective,
     respiratory syndrome coronavirus 2 (SARS-CoV-2) infection             the novelty in our approach comes from a clustering technique
     had rapidly spread by late January 2020 to all Chinese provinces      that enables the exploitation of geospatial synchronicities of
     and many other countries [1-4]. On January 30, 2020, the World        COVID-19 activity across Chinese provinces and a data
     Health Organization (WHO) issued a Public Health Emergency            augmentation technique to mitigate the scarcity of historical
     of International Concern (PHEIC) [5-8]; and on March 11th,            data for model training.
     the WHO declared the coronavirus disease (COVID-19) a
     pandemic [5]. By April 18, 2020, the virus had affected more          Methods
     than 2,300,000 people and caused the deaths of 150,000 in more
     than 180 countries [7].
                                                                           Experimental Design
                                                                           Our method was designed for forecasting COVID-19 2 days
     In the last decade, methods that leverage data from                   ahead of the current time. We used as inputs the following data
     internet-based data sources and data from traditional surveillance    sources: COVID-19 activity reports from China CDC; internet
     systems have emerged as a complementary alternative to provide        search frequencies from Baidu; a number of related news reports
     near real-time disease activity estimates (eg, for influenza and      from 311 media sources, as reported by the Media Cloud
     dengue) [9-13]. Despite the fact that these methodologies have        platform; and COVID-19 daily forecasts from a metapopulation
     successfully addressed delays in the availability of health reports   mechanistic model. Our machine learning methodology also
     as well as case count data quality issues, developing predictive      used a clustering and data augmentation technique. We provide
     models for an emerging disease outbreak such as COVID-19 is           details about data sources and statistical methods in the
     an even more challenging task [14]. There are multiple reasons        following sections.
     for this; for example, the availability of epidemiological
     information for this disease is scarce (there is no historical        Data Sources
     precedent about the behavior of the disease); the daily/weekly
                                                                           Daily Reports of COVID-19
     epidemiological reports that become available are frequently
     revised and corrected retrospectively to account for mistakes         Case counts of COVID-19 were obtained from China CDC.
     in data collection and reporting (a common practice in public         These data are curated and publicly available via the Models of
     health reports); and the presence of a diverse array of               Infectious Disease Agent Study (MIDAS) association [24]. All
     uncertainties about disease burden due in part to underreporting      data were collected on the original date they became available.
     of cases [15].                                                        Indeed, case counts released by China CDC can be revised, up
                                                                           to several weeks later. In this study, we only used unrevised
     Most efforts to estimate the time evolution of COVID-19 spread        data, which is the real case scenario to produce real-time
     and the effect of public health interventions have relied on          estimates. The reports, available for all the provinces, include
     mechanistic models that parameterize transmission and                 various activity trends such as new diagnosed cases, new
     epidemiological characteristics to produce forecasts of disease       suspected cases, and new reported deaths. For our study, we
     activity [16,17]. In contrast, only a limited number of studies       selected the number of confirmed cases as the epidemiological
     have investigated ways to track COVID-19 activity, leveraging         target and collected activity reports from January 10, 2020, to
     internet search data [1,13,18], and few to the best of our            February 21, 2020.
     knowledge have combined internet-based data sources and
     mechanistic estimates to forecast COVID-19 activity [19].             Baidu Internet Search Activity: Data Exclusion
     We present a novel hybrid methodology that combines                   We collected the daily search fraction for three different
     mechanistic and machine learning methodologies to successfully        COVID-19–related search terms in Mandarin (“COVID-19
     forecast COVID-19 in real time at the province level in China         symptoms” [“新冠肺炎症状”], “how many degree is fever”
     [20,21]. We used a data-driven approach to incorporate inputs         [“多少度算发烧”], and “symptoms of fever” [“发烧症状”]).
     from (a) official health reports from Chinese Center for Disease      These terms were selected based on their correlation and
     Control and Prevention (China CDC), (b) COVID-19–related              potential association with case counts of COVID-19 [25] and
     internet search activity from Baidu, (c) news media activity          collected individually for each province from January 1, 2020,
     reported by Media Cloud, and (d) daily forecasts of COVID-19          to February 21, 2020. Our decision to use internet activity as a
     activity from the simulation epidemiological model GLEAM              source of information is based on the hypothesis that search
     (global epidemic and mobility), a metapopulation mechanistic          frequencies from COVID-19–related keywords reflect, to an
     model [16]. Inspired by a methodology previously used to              extent, the number of people presenting symptoms related to
     successfully forecast seasonal influenza in the United States at      COVID-19 before their arrival at a clinic. Given Baidu imposes
     the state level [11] and previous methods to monitor emerging         limits to data access for researchers, we were unable to conduct

     http://www.jmir.org/2020/8/e20285/                                                            J Med Internet Res 2020 | vol. 22 | iss. 8 | e20285 | p. 2
                                                                                                                 (page number not for citation purposes)
XSL• FO
RenderX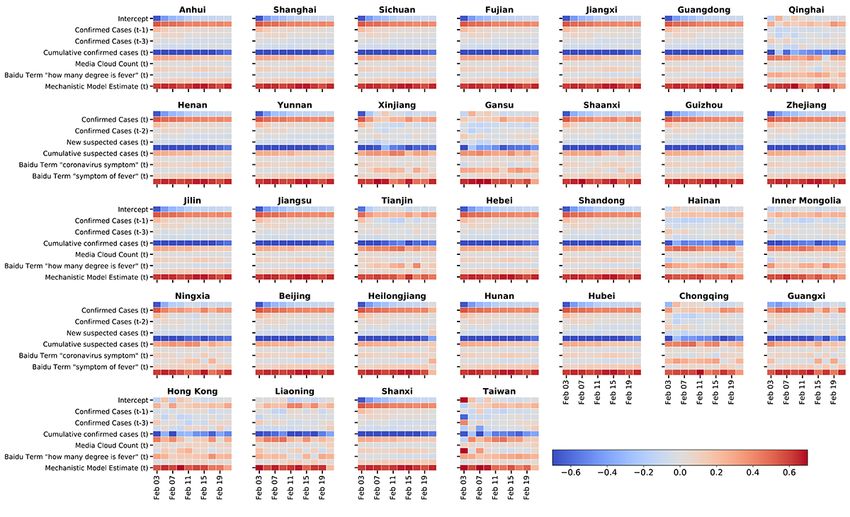
JOURNAL OF MEDICAL INTERNET RESEARCH                                                                                                          Liu et al

     a broad analysis on a wide range of keywords. A visualization          of the Baidu search term time series can be seen in Figure 1.
     Figure 1. Visualization of the evolution of coronavirus disease (COVID-19) cases and Baidu search trends. The evolution of COVID-19 cases is
     represented in gray and Baidu search trends in green and orange. All-time series have been smoothed for visualization purposes.

                                                                            “pneumonia,” “fever,” “cough,” and the name of each province
     News Reports                                                           to generate province-specific news activity trends. Media data
     An online open-source platform called Media Cloud, which               from January 1, 2020, to February 21, 2020 were collected and
     allows the tracking and analysis of media for any topic of             used as additional source information.
     interest through the matching of keywords, was used. We
     obtained volumes of the number of news articles available over         Global Epidemic and Mobility Model
     time from a collection of 311 Chinese media websites using the         The global epidemic and mobility model, GLEAM, is an
     keywords “coronavirus,” “COVID-19,” “2019-nCoV,”                       individual-based, stochastic, and spatial epidemic model [26-28]

     http://www.jmir.org/2020/8/e20285/                                                               J Med Internet Res 2020 | vol. 22 | iss. 8 | e20285 | p. 3
                                                                                                                    (page number not for citation purposes)
XSL• FO
RenderX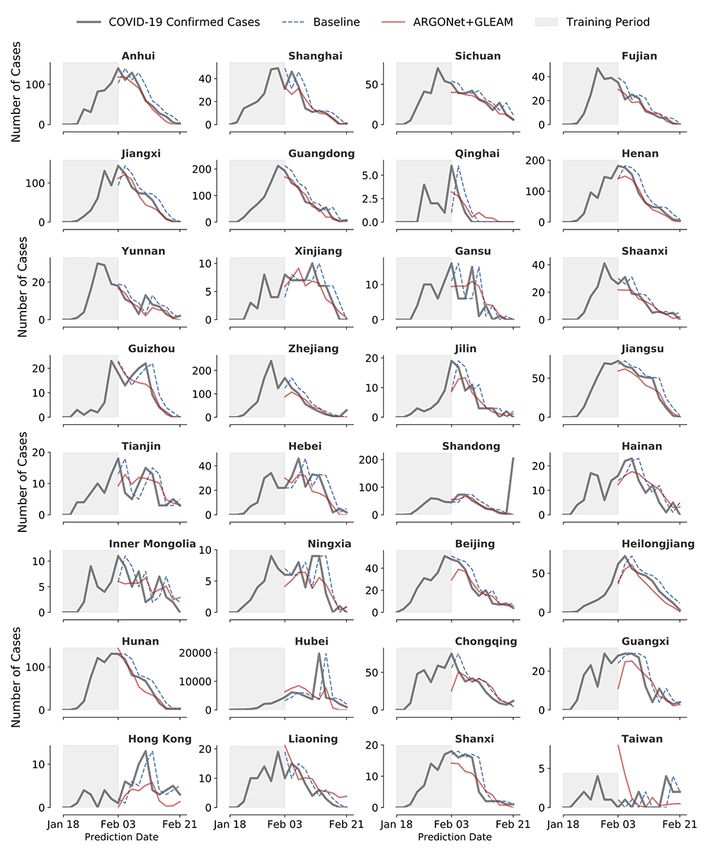
JOURNAL OF MEDICAL INTERNET RESEARCH                                                                                                         Liu et al

     that has been used to simulate the early stages of the COVID-19       As COVID-19 is an emerging outbreak, the amount of
     epidemic in mainland China and across the world [16]. GLEAM           epidemiological information, either official or unofficial, is low,
     is based on a metapopulation approach in which the world              and thus, limits our capacity to build predictive models. To
     population is divided into subpopulations centered around major       maximize usage of data, we applied the strategies below.
     transportation hubs (usually airports). Over 3000 subpopulations
     in about 200 different countries and territories are included in
                                                                           Clustering
     the model. The subpopulations are connected by short-range            We clustered the 32 provinces into several groups and trained
     commuting and long-range travel networks that determine the           a model for each group. Clustering and model retraining
     flow of individuals traveling daily among them. Short-range           processes were repeated on every single new prediction date.
     mobility patterns (eg, daily commuting) are derived from data         To determine the similarities in outbreak patterns across Chinese
     collected from the National Statistical Offices of 30 countries       provinces, we calculated the pairwise correlation matrix for
     on five continents [26]. In addition, for the COVID-19 epidemic,      confirmed COVID-19 cases by using all historical data available.
     mobility variations in mainland China are further calibrated          Then, based on similarity matrix, provinces were clustered by
     using deidentified and aggregated domestic population                 using complete linkage hierarchical clustering, which is an
     movement data as derived from Baidu Location-Based Services.          agglomerative hierarchical clustering method, creating clusters
     The airline transportation data consider daily origin-destination     based on most dissimilar pairs [38]. The number of clusters K
     traffic flows obtained from the Official Aviation Guide and the       was determined by choosing the K, thereby maximizing the
     International Air Transport Association databases (updated in         Calinski-Harabasz index [39]. Our clustering method gained
     2019), and accounting for travel restrictions in 2020. Within         higher stability when more data points were available for
     each subpopulation, the human-to-human transmission of                clustering [40]. More details of the clustering method are
     COVID-19 is modeled using a compartmental representation              presented in Multimedia Appendix 1 [41-43].
     of the disease where each individual can occupy one of the
                                                                           Data Augmentation
     following four states: susceptible (S), latent (L), infectious (I),
     and removed (R). Susceptible individuals can acquire the virus        We conducted data augmentation by using a bootstrap method
     through contacts with individuals in the infectious state, and        to resample each data point of the training data set. We made
     become latent, meaning they are infected but cannot transmit          100 bootstrap samples for each data point to which we added
     the infection yet. Latent individuals progress to the infectious      a random Gaussian noise with a mean of 0 (SD 0.01). Due to
     stage with a rate inversely proportional to the latent period.        the stochasticity of both the clustering algorithm and the model
     Infectious individuals progress into the removed stage with a         training processing, on each prediction day, we run the whole
     rate inversely proportional to the infectious period. Removed         clustering-training process 20 times and take an average of the
     individuals represent those who can no longer infect others,          outputs as our final prediction. Our multistep approach may
     meaning they were isolated, hospitalized, died, or have               introduce stochasticity in three different steps: (a) the clustering
     recovered.                                                            process, (b) the data augmentation process, and (c) the regression
                                                                           algorithm. To ensure robustness of our prediction results, the
     The model produces an ensemble of possible epidemic scenarios         whole process (from clustering to out-of-sample prediction) on
     providing epidemic indicators, such as the number of newly            each prediction date was repeated at least 20 times and the
     generated infections and deaths in each subpopulation. The            ensemble (via an averaging approach) predictions were reported
     model is initialized by a starting date of the epidemic between       as the final prediction. We chose to use an empirical approach
     November 15, 2019, and December 1, 2019, with 20 to 40 cases          to explore whether the number of computational experiments
     caused by zoonotic exposure [29-32]. The transmission dynamic         were sufficient to lead to a stable performance. In order to
     is calibrated by using an Approximate Bayesian Computation            achieve this, we conducted ensemble prediction experiments
     approach to estimate the posterior distribution of the basic          using realizations from 1 to 50 prediction efforts. We
     reproductive number R0 that uses as evidence the detection of         documented the performance of these ensemble predictions
     infections imported from China at international locations across      using root mean square error (RMSE) and correlation in
     the world [33-37]. A sensitivity analysis has been performed          (Multimedia Appendix 2, Table S1). The performance of the
     on the initial conditions of the model considering different          ARGONet + GLEAM method plateaued after about 10-15
     values for the mean latency period (range 3-6 days), the mean         realizations as seen on this table. Therefore, we concluded that
     infectious period (range 2-8 days), the generation time (range        20 realizations of our algorithm was an adequate number to
     6-11 days), and the initial number of zoonotic cases (range           ensure robustness and stability of the prediction while not
     20-80). The calibrated model is then used to generate the             imposing too much computational burden.
     out-of-sample ensemble of stochastic epidemic evolutions across
     mainland China.                                                       Predictive Model
                                                                           For our prediction task, we fitted a LASSO (least absolute
     Statistical Analysis                                                  shrinkage and selection operator) multivariable regularized
     Aggregation of Daily Reports                                          linear model for every data set generated from our clustering
                                                                           and augmentation steps at time t.
     To enhance signal and reduce noise, we aggregated case count,
     search volumes, and media article count for each δt = 2 days          The LASSO technique minimizes the mean squared error
     window.                                                               between observations and predictions subject to a L1 norm
                                                                           constraint (more details of this method are provided in

     http://www.jmir.org/2020/8/e20285/                                                              J Med Internet Res 2020 | vol. 22 | iss. 8 | e20285 | p. 4
                                                                                                                   (page number not for citation purposes)
XSL• FO
RenderX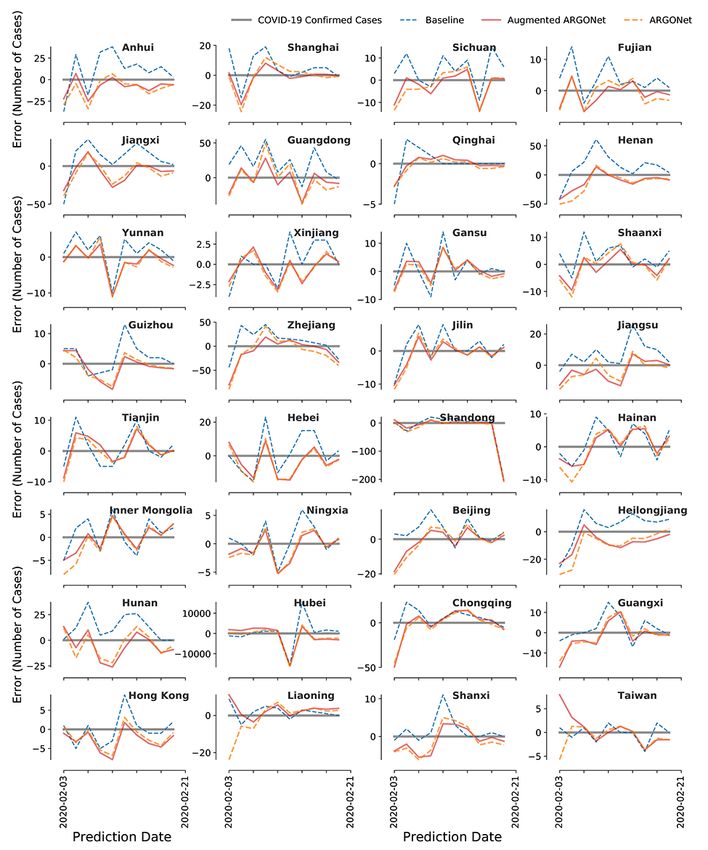
JOURNAL OF MEDICAL INTERNET RESEARCH                                                                                                          Liu et al

     Multimedia Appendix 1). The number of new confirmed                    of deaths at date T; CT is the number of cumulative cases at date
     COVID-19 cases for the next bi-day can be then expressed as:           T; and T + δt is the normally distributed error term.
                                                                            Models were dynamically recalibrated, similar to the method
                                                                            presented by Santillana et al [44] and Lu et al [11]. Our method,
                                                                            ARGONet + GLEAM, was implemented in an R 3.5.3
     where yT + δt is the estimate at date T + δt; δt = 2 days; yT is the   environment with a glmnet 3.0-2 library.
     number of cases at date T; ST is the search volume at date T;          A summary of our method can be seen in Figure 2.
     MT is the number of media articles at date T; DT is the number
     Figure 2. Summary of the methods used to obtain our coronavirus disease (COVID-19) estimates. GLEAM: global epidemic and mobility.

                                                                            deviations the predicted new cases yT + δt will change if 1
     Performance of Model and Relevance of Predictors
                                                                            standard deviation changes in the predictor.
     Two different metrics were used to measure the performance
     of ARGONet + GLEAM: (1) the RMSE and (2) the Pearson                   Data Sharing
     correlation. To assess the predictive power of our methodology,        All codes and data will be made available via the Harvard
     we compared our performance against the following models:              dataverse.
     1.   Persistence rule (baseline): a rule-based model that uses
          the new case count at date T as an estimate of the prediction     Results
          for T+δt so that yT+δt = yT
                                                                            We produced 2-day-ahead (strictly out-of-sample) and real-time
     2.   Autoregressive (AR): a simple AR model built on
                                                                            COVID-19 forecasts for 32 Chinese provinces for the time
          COVID-19 cases that occurred in the previous three AR
                                                                            period spanning February 3, 2020, to February 21, 2020. A
          lags (2-day reports) (see Multimedia Appendix 1 for more
                                                                            visual representation of our out-of-sample model forecasts is
          information on this model)
                                                                            shown in Figure 3 along with the subsequently observed
     3.   ARGONet: an alternate version of our methodology that
                                                                            COVID-19 cases, as reported by China CDC.
          does not include any mechanistic information but including
          clustering and data augmentation approaches.                      Our results show that ARGONet + GLEAM outperforms the
                                                                            persistence model in 27 out of 32 Chinese provinces. Even in
     As linear models are used in this study, the relevance of
                                                                            provinces where ARGONet + GLEAM failed to produce
     predictors in predicting new cases can be defined thanks to the
                                                                            improvements to the baseline model, our model produced
     associated factor of each term in the trained model. As all data
                                                                            reasonable disease estimates as seen in Figure 3. These
     were normalized using the z-score (strictly within the training
                                                                            provinces include Shanxi, Liaoning, Taiwan, Hong Kong, and
     data sets) during training and prediction, the associated factor
                                                                            Guangxi (the latter three with very different administration, and
     can be approximately understood as how many standard
                                                                            likely health care, systems compared to the rest of the
                                                                            provinces).

     http://www.jmir.org/2020/8/e20285/                                                               J Med Internet Res 2020 | vol. 22 | iss. 8 | e20285 | p. 5
                                                                                                                    (page number not for citation purposes)
XSL• FO
RenderX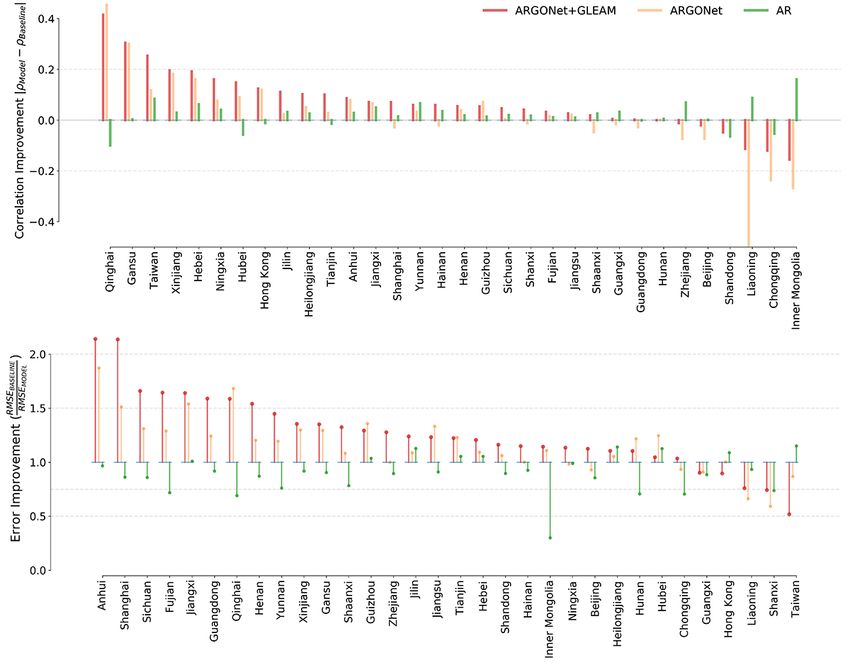
JOURNAL OF MEDICAL INTERNET RESEARCH                                                                                                         Liu et al

     Figure 3. Graphical visualization of the estimates obtained by ARGONet + GLEAM. The number of new confirmed cases for coronavirus disease
     (COVID-19), as reported by China CDC (solid black), along with ARGONet + GLEAM (solid red) 2-day, ahead-of-time estimates between February
     3, 2020, to February 21, 2020. As a comparison, the dotted blue line represents the persistence model.

                                                                           in Multimedia Appendix 2 for a detailed description of our
     Experimental Design AR Model                                          model results), labeled AR, show that the AR model’s predictive
     We analyzed the performance of models built using only local,         power was overall inferior to baseline performance, with
     province-level epidemiological data as input. We generated an         exception to Jilin, Tianjin, Hebei, Hubei, and Heilongjiang.
     AR model for each province, built on COVID-19 cases that              Subsequently, we incorporated local disease-related internet
     occurred in the previous three AR lags (ie, the previous three        search information from Baidu and news alert data from Media
     2-day reports), and compared our estimates with the baseline.         Cloud as inputs to build ARGO-type models [9]. These
     Our results, presented in Figure 4 (also see Tables S2 and S3
     http://www.jmir.org/2020/8/e20285/                                                              J Med Internet Res 2020 | vol. 22 | iss. 8 | e20285 | p. 6
                                                                                                                   (page number not for citation purposes)
XSL• FO
RenderX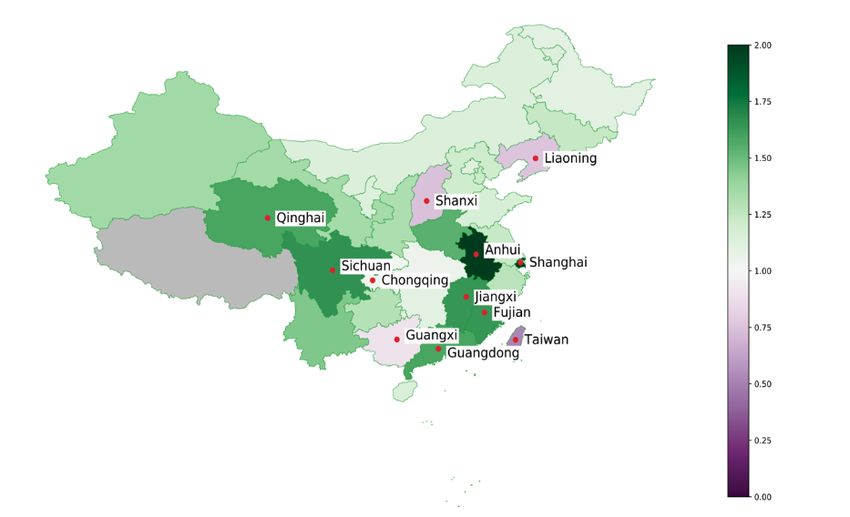
JOURNAL OF MEDICAL INTERNET RESEARCH                                                                                                                 Liu et al

     ARGO-type models showed marginal predictive power                           outperformed the baseline in seven provinces.
     improvements when compared with AR models and only
     Figure 4. Graphical visualization of the models’ performances. Comparison of the improvement in terms of root mean square error (RMSE) (top) and
     Pearson correlation (bottom) for each model used in the study. To facilitate comparison between model scores in each province in terms of RMSE, we
     normalized the RMSE score of each model by the baseline’s RMSE and visualized its inverse value. In this way, scores above one imply an improvement
     (RMSE reduction), whereas a score below one implies the model had a bigger RMSE in comparison to the baseline. In the case of correlation, we plotted
     the difference between the absolute values between each model’s correlation and the baseline. Each panel is ordered, from left to right, based on the
     metric performance of ARGONet + GLEAM (solid red). AR: autoregressive.

                                                                                 our (clustered) predictive models, we combined the data
     Dynamic Clustering of Chinese Provinces                                     available from several provinces with similar trends (in terms
     Based on prior work on influenza activity prediction [11], we               of correlation, which was strictly calculated within our training
     added historical COVID-19 activity information for all Chinese              period at the time-step of prediction). The clustering modeling
     provinces to the input of our local models. We calculated the               approach, which incorporated internet-based data sources as
     pairwise correlation matrix for confirmed COVID-19 cases                    the ARGO-type models, produced forecasts that led to error
     between all Chinese provinces, between February 1 and                       reductions for 17 out of 32 provinces compared to the
     February 21, 2020 (Figure 5). Our results showed that most of               persistence model and improved correlation values in 20 out of
     the provinces experienced similar epidemic trends. To build                 32 provinces.

     http://www.jmir.org/2020/8/e20285/                                                                      J Med Internet Res 2020 | vol. 22 | iss. 8 | e20285 | p. 7
                                                                                                                           (page number not for citation purposes)
XSL• FO
RenderX
JOURNAL OF MEDICAL INTERNET RESEARCH Liu et al
Figure 5. Visualization of the pairwise correlation matrices of confirmed cases and human mobility from Wuhan to each Chinese province. During
the period of January, we can see a similar trend of mobility for a big cluster of provinces as well as a similar trend of number of confirmed cases for
the period of February.
ARGONet Model
Data Augmentation
The results of incorporating both clustering and augmentation
As an additional way to increase the number of observations in
techniques can be seen in Figure 4 and a visualization of the
the training set of each cluster, we implemented a data
errors can be seen in Figure 6. For simplicity, we labeled these
augmentation technique. This process consisted of generating
predictions ARGONet, even though this implementation of
new observations via a Bootstrap method and addition of random
ARGONet is an enhanced version specifically designed for
Gaussian noise to every randomly selected emerging outbreaks where data are scarce. In terms of RMSE,
observation. our results show that ARGONet’s predictive power was able
to outperform AR and the persistence model in 25 of the 32
Chinese provinces. In terms of correlation, ARGONet
outperformed the baseline (persistence) model in 18 provinces.
http://www.jmir.org/2020/8/e20285/ J Med Internet Res 2020 | vol. 22 | iss. 8 | e20285 | p. 8
(page number not for citation purposes)
XSL• FO
RenderXJOURNAL OF MEDICAL INTERNET RESEARCH Liu et al
Figure 6. Visualization of the errors. Graphical visualization of the out-of-sample coronavirus disease (COVID-19) error (ŷ–y) between February 3,
2020, and February 21, 2020.
improved ARGONet’s predictive power across most provinces.
ARGONet + GLEAM Model ARGONet + GLEAM led to error reductions in 27 out of 32
We included forecasts produced by mechanistic model as an provinces compared to the baseline. In terms of correlation, it
additional input in our models (prior to the clustering and improved in 26 out of 32 provinces. Provinces like Qinghai,
augmentation steps). The results of incorporating these estimates Hunan, and Jiangxi showed the biggest improvement, whereas
can be seen in Figure 4 with the name of ARGONet + GLEAM Taiwan, Hong Kong, Shanxi, and Liaoning did not display error
and a visualization of the errors can be seen in Figure 6. Our reductions.
results show that the inclusion of mechanistic model estimates
http://www.jmir.org/2020/8/e20285/ J Med Internet Res 2020 | vol. 22 | iss. 8 | e20285 | p. 9
(page number not for citation purposes)
XSL• FO
RenderXJOURNAL OF MEDICAL INTERNET RESEARCH Liu et al
Visualization of the Results Hong Kong, and Guangxi are the provinces where our models
As an alternative way to visualize ARGONet + GLEAM’s were not able to reduce the error compared to the baseline.
predictive performance, we plotted a map with Chinese While ARGONet + GLEAM’s performance in these provinces
provinces (Figure 7), color coded based on the improvement was not superior to the baseline, its predictions were within a
shown in Figure 4. From a geographical perspective, the reasonable range, as seen in Figures 2 and 3. We were not able
provinces where ARGONet + GLEAM had the most to perform any analysis on Tibet, one of the largest provinces
improvement (Anhui, Jiangxi, Fujian, Sichuan, and Guangdong) in China, and Macau given their low count of detected
were located in south central China. Shanxi, Liaoning, Taiwan, COVID-19 cases.
Figure 7. Geographical visualization of the relative improvement of ARGONet + GLEAM compared to the baseline. Chinese provinces that show an
increase in performance relative to the baseline are shaded green, while provinces that did not perform better than our baseline are shaded purple.
Provinces with the highest improvement (Anhui, Shanghai, Sichuan, Fujian, Jiangxi, Guangdong, and Qinghai) and underperformance (Taiwan, Shanxi,
Liaoning, Hong Kong, and Guangxi) are identified by a red dot over the province.
shows that historical COVID-19 confirmed cases and suspected
Analysis of the Importance of the Sources of cases were consistently relevant sources of information over
Information Over Time most of the study period. Internet-based search terms from Baidu
To minimize the prediction errors in our estimates, the dynamic were also frequently used. Daily news counts were used by our
design of our methodology utilizes different sources of models in a selected number of provinces. However, for many
information as needed over time. This means that for each of these provinces, the importance of media article counts
province (or group of provinces within a cluster), we can decrease over time. Estimates from mechanistic models
quantify the predictive power of different features used in our contributed to our model prediction, especially in early February
models as time evolves. Our analysis, visualized in Figure 8, 2020.
http://www.jmir.org/2020/8/e20285/ J Med Internet Res 2020 | vol. 22 | iss. 8 | e20285 | p. 10
(page number not for citation purposes)
XSL• FO
RenderXJOURNAL OF MEDICAL INTERNET RESEARCH Liu et al
Figure 8. Graphical visualization of the relevance of data sources. Time evolution of the value (averaged over the 20 experiments) of the linear
coefficients for the features used in our methodology, visualized per province. Every heatmap includes the same number of features (rows) and is
organized in the same order.
learning model can accurately produce real-time estimates for
Discussion COVID-19 outbreaks.
Principal Findings In terms of prediction error, our proposed methodology,
We presented a methodology capable of producing meaningful ARGONet + GLEAM, was able to outperform the persistence
and reliable short-term (2 days ahead) forecasts of COVID-19 model in 27 out of 32 provinces. While our method does not
activity, at the province level in China, by combining show prediction error improvements in Guangxi, Liaoning,
information from reports from China CDC, internet search Shanxi, Taiwan, and Hong Kong, our forecasts are still within
trends, news article trends, and information from mechanistic range in all provinces except for Taiwan, where very few cases
models. Our approach is capable of overcoming multiple were reported during the time period of this study. It is important
challenges characteristic of emerging outbreaks caused by novel to note that Taiwan, Hong Kong, and Guangxi have different
pathogens. These challenges include the lack of historical administrative (and likely health care) systems compared with
disease activity information to calibrate models, the low volume the other provinces. This could explain the differences in
of case count data, and the inherent delay in gaining access to COVID-19 trends in these regions and could help explain why
data. Methodologically speaking, our method maximizes the our models do not seem to add value to the persistence model.
use of a limited number of observations as the outbreak unfolded Features studies should investigate if incorporating disease
by (a) choosing an appropriate aggregation time-window (2 activity estimates from other mechanistic models, likely
days) to improve the signal-to-noise ratio, (b) leveraging designed with different assumptions and mathematical
synchronicities in the spatiotemporal trends in COVID-19 across formulations, could lead to further improvements.
provinces to produce cluster-specific models of prediction, and We were unable to identify an accurate (daily) parametrization
(c) using data augmentation methods to increase stability in the of changes in human mobility due to the widespread local
training of our models. lockdowns during the period of our study (February 3-21, 2020),
Previous methods, such as the ARGONet model [11,45], have and thus, we did not include this data source as a potential
been shown to make accurate real-time prediction at the state predictor. Future studies may incorporate (high temporal
level in the United States for seasonal infectious diseases such resolution) human mobility data as a modulator of transmission
as influenza. In addition, Chinazzi et al [16] showed that it was and predictor of disease activity. When looking at the entire
possible to estimate the evolution of an emerging outbreak using time period of this study, however, we observed that the
a mechanistic model. Nevertheless, as far as we know, reliable data-driven clustering of provinces used in our approach and
real-time methodologies to forecast new case counts for an based on COVID-19 activity appears to have similarities with
emerging disease outbreak remained an unsolved problem. In the clustering one would obtain from using human mobility
this study, we showed that a dynamically trained machine data made available by Baidu (Figure 5). This result aligns with
http://www.jmir.org/2020/8/e20285/ J Med Internet Res 2020 | vol. 22 | iss. 8 | e20285 | p. 11
(page number not for citation purposes)
XSL• FO
RenderXJOURNAL OF MEDICAL INTERNET RESEARCH Liu et al
the conclusion of other available studies that found that the time model implementations in other locations where the growth
evolution of the COVID-19 outbreak in China was significantly phase has spanned longer time periods, like New York, United
influenced by changes in human mobility (consequence of public States, should investigate the ability of our models to properly
health interventions) [16,17,46], and associated with the identify peaks.
percentage of people traveling from Wuhan in the early stages.
Conclusions
Limitations Our findings suggest that it is possible to use very limited
One limitation of our study is that during the test time period amounts of data from multiple data sources to conduct real-time
of our methods a consistent decrease in COVID-19 cases (due forecasting in the early stage of an emerging outbreak. We
to strong public health interventions) was observed and thus believe that our method, ARGONet + GLEAM, could prove to
our methods could not be tested for their ability to identify the be useful for public health officials to monitor (and perhaps
epidemic peaks across provinces. The brevity of the COVID-19 prevent) the spread of the virus [8,11,25,47]. As the
epidemic outbreak in Chinese provinces was the limiting factor SARS-CoV-2 virus continues to spread around the world,
for this as the observations that corresponded to the growth extensions of our methods could be implemented to provide
phase of the outbreak were used for training purposes. Future timely and reliable disease activity estimates to decision makers.
Acknowledgments
We thank Dr Wei Luo for his assistance and guidance on the interpretation of mobility data for Chinese provinces. MC and AV
acknowledge support from Google Cloud Healthcare and Life Sciences Solutions via the GCP research credits program.
CP, AV, and MS were partially supported by the National Institute of General Medical Sciences of the National Institutes of
Health under Award Number R01GM130668. MC and AV report grants from Metabiota Inc, outside the submitted work. The
content is solely the responsibility of the authors and does not necessarily represent the official views of the National Institutes
of Health.
Authors' Contributions
DL, LC, CP, AV, and MS conceived and designed the study. DL, LC, CP, XD, and MC collected the different data sources. MC,
JD, and AV produced predictions using the GLEAM modeling platform. DL, LC, and CP implemented the ARGONet + GLEAM
methodology. DL, LC, CP, and MS analyzed the results. DL, LC, CP, and MS wrote the first draft of the manuscript. All authors
contributed to and approved the final version of the manuscript.
Conflicts of Interest
None declared.
Multimedia Appendix 1
Mobility data correlation.
[DOCX File , 18 KB-Multimedia Appendix 1]
Multimedia Appendix 2
Supplementary tables.
[DOCX File , 24 KB-Multimedia Appendix 2]
References
1. Li Q, Guan X, Wu P, Wang X, Zhou L, Tong Y, et al. Early Transmission Dynamics in Wuhan, China, of Novel
Coronavirus–Infected Pneumonia. N Engl J Med 2020 Mar 26;382(13):1199-1207. [doi: 10.1056/nejmoa2001316]
2. Zhu N, Zhang D, Wang W, Li X, Yang B, Song J, et al. A Novel Coronavirus from Patients with Pneumonia in China,
2019. N Engl J Med 2020 Feb 20;382(8):727-733. [doi: 10.1056/nejmoa2001017]
3. Chan J, Yuan S, Kok K, To K, Chu H, Yang J, et al. A familial cluster of pneumonia associated with the 2019 novel
coronavirus indicating person-to-person transmission: a study of a family cluster. The Lancet 2020 Feb;395(10223):514-523
[FREE Full text] [doi: 10.1016/S0140-6736(20)30154-9]
4. Gilbert M, Pullano G, Pinotti F, Valdano E, Poletto C, Boelle P. Preparedness and vulnerability of African countries against
introductions of 2019-nCoV. medRxiv 2020:e [FREE Full text] [doi: 10.1101/2020.02.05.20020792]
5. Statement on the second meeting of the International Health Regulations (2005) Emergency Committee regarding the
outbreak of novel coronavirus (2019-nCoV). World Health Organization. 2020. URL: https://www.who.int/news-room/
detail/
30-01-2020-statement-on-the-second-meeting-of-the-international-health-regulations-(2005)-emergency-committee-regarding-the-outbreak-of-novel-coronavirus-(2019-ncov)
[accessed 2020-02-18]
http://www.jmir.org/2020/8/e20285/ J Med Internet Res 2020 | vol. 22 | iss. 8 | e20285 | p. 12
(page number not for citation purposes)
XSL• FO
RenderXJOURNAL OF MEDICAL INTERNET RESEARCH Liu et al
6. Du Z, Wang L, Cauchemez S, Xu X, Wang X, Cowling BJ. Risk of 2019 novel coronavirus importations throughout China
prior to the Wuhan quarantine. medRxiv 2020:e [FREE Full text] [doi: 10.1101/2020.01.28.20019299]
7. Sun K, Chen J, Viboud C. Early epidemiological analysis of the 2019-nCoV outbreak based on a crowdsourced data.
medRxiv 2020:e [FREE Full text] [doi: 10.1101/2020.01.31.20019935]
8. Wang C, Horby PW, Hayden FG, Gao GF. A novel coronavirus outbreak of global health concern. The Lancet 2020
Feb;395(10223):470-473. [doi: 10.1016/s0140-6736(20)30185-9]
9. Yang S, Santillana M, Kou SC. Accurate estimation of influenza epidemics using Google search data via ARGO. Proc Natl
Acad Sci U S A 2015 Nov 24;112(47):14473-14478 [FREE Full text] [doi: 10.1073/pnas.1515373112] [Medline: 26553980]
10. Santillana M, Nguyen AT, Dredze M, Paul MJ, Nsoesie EO, Brownstein JS. Combining Search, Social Media, and Traditional
Data Sources to Improve Influenza Surveillance. PLoS Comput Biol 2015 Oct 29;11(10):e1004513 [FREE Full text] [doi:
10.1371/journal.pcbi.1004513] [Medline: 26513245]
11. Lu FS, Hattab MW, Clemente CL, Biggerstaff M, Santillana M. Improved state-level influenza nowcasting in the United
States leveraging Internet-based data and network approaches. Nat Commun 2019 Jan 11;10(1):147 [FREE Full text] [doi:
10.1038/s41467-018-08082-0] [Medline: 30635558]
12. Cleaton JM, Viboud C, Simonsen L, Hurtado AM, Chowell G. Characterizing Ebola Transmission Patterns Based on
Internet News Reports. Clin Infect Dis 2016 Jan 01;62(1):24-31 [FREE Full text] [doi: 10.1093/cid/civ748] [Medline:
26338786]
13. Li C, Chen L, Chen X, Zhang M, Pang C, Chen H. Retrospective analysis of the possibility of predicting the COVID-19
outbreak from Internet searches and social media data, China, 2020. Eurosurveillance 2020;25(10):e [FREE Full text] [doi:
10.2807/1560-7917.es.2020.25.10.2000199]
14. Lipsitch M, Santillana M. Enhancing Situational Awareness to Prevent Infectious Disease Outbreaks from Becoming
Catastrophic. Curr Top Microbiol Immunol 2019;424:59-74. [doi: 10.1007/82_2019_172] [Medline: 31292726]
15. Li R, Pei S, Chen B, Song Y, Zhang T, Yang W, et al. Substantial undocumented infection facilitates the rapid dissemination
of novel coronavirus (SARS-CoV-2). Science 2020 May 01;368(6490):489-493 [FREE Full text] [doi:
10.1126/science.abb3221] [Medline: 32179701]
16. Chinazzi M, Davis JT, Ajelli M, Gioannini C, Litvinova M, Merler S, et al. The effect of travel restrictions on the spread
of the 2019 novel coronavirus (COVID-19) outbreak. Science 2020 Apr 24;368(6489):395-400 [FREE Full text] [doi:
10.1126/science.aba9757] [Medline: 32144116]
17. Lai S, Ruktanonchai N, Zhou L, Prosper O, Luo W, Floyd J. Effect of non-pharmaceutical interventions for containing the
COVID-19 outbreak in China. medRxiv 2020:e [FREE Full text] [doi: 10.1101/2020.03.03.20029843]
18. Jung S, Akhmetzhanov A, Hayashi K, Linton N, Yang Y, Yuan B, et al. Real-Time Estimation of the Risk of Death from
Novel Coronavirus (COVID-19) Infection: Inference Using Exported Cases. J Clin Med 2020 Feb 14;9(2):9 [FREE Full
text] [doi: 10.3390/jcm9020523] [Medline: 32075152]
19. Gore R, Lynch C. Virginia County COVID-19 daily case total forecaster. VMASC. 2020. URL: https://vmasc.shinyapps.io/
va-county-covid-forecast/ [accessed 2020-07-16]
20. Eldabi T. Hybrid simulation: Historical lessons, present challenges and futures. : IEEE; 2016 Presented at: WSC '16:
Proceedings of the 2016 Winter Simulation Conference; 11-14 Dec 2016; Washington, DC, USA URL: https://ieeexplore.
ieee.org/document/7822192 [doi: 10.1109/WSC.2016.7822192]
21. Giabbanelli P. Solving challenges at the interface of simulation and big data using machine learning. : IEEE; 2019 Presented
at: 2019 Winter Simulation Conference (WSC); 8-11 Dec 2019; National Harbor, MD, USA, USA p. 572-583 URL: https:/
/ieeexplore.ieee.org/document/9004755 [doi: 10.1109/wsc40007.2019.9004755]
22. Aiken E, McGough S, Majumder M, Wachtel G, Nguyen A, Viboud C. Real-time Estimation of Disease Activity in Emerging
Outbreaks using Internet Search Information. medRxiv 2019:e [FREE Full text] [doi: 10.1101/19010470v1]
23. McGough SF, Brownstein JS, Hawkins JB, Santillana M. Forecasting Zika Incidence in the 2016 Latin America Outbreak
Combining Traditional Disease Surveillance with Search, Social Media, and News Report Data. PLoS Negl Trop Dis 2017
Jan 13;11(1):e0005295 [FREE Full text] [doi: 10.1371/journal.pntd.0005295] [Medline: 28085877]
24. Models of Infectious Disease Agent Study Association. midas-network / COVID-19. GitHub. URL: https://github.com/
midas-network/COVID-19/tree/master/data/cases [accessed 2020-08-07]
25. Phan LT, Nguyen TV, Luong QC, Nguyen TV, Nguyen HT, Le HQ, et al. Importation and Human-to-Human Transmission
of a Novel Coronavirus in Vietnam. N Engl J Med 2020 Feb 27;382(9):872-874. [doi: 10.1056/nejmc2001272]
26. Balcan D, Gonçalves B, Hu H, Ramasco JJ, Colizza V, Vespignani A. Modeling the spatial spread of infectious diseases:
the GLobal Epidemic and Mobility computational model. J Comput Sci 2010 Aug 01;1(3):132-145 [FREE Full text] [doi:
10.1016/j.jocs.2010.07.002] [Medline: 21415939]
27. Gomes MFC, Pastore Y Piontti A, Rossi L, Chao D, Longini I, Halloran ME, et al. Assessing the international spreading
risk associated with the 2014 west african ebola outbreak. PLoS Curr 2014 Sep 02;6:e [FREE Full text] [doi:
10.1371/currents.outbreaks.cd818f63d40e24aef769dda7df9e0da5] [Medline: 25642360]
28. Zhang Q, Sun K, Chinazzi M, Pastore Y Piontti A, Dean NE, Rojas DP, et al. Spread of Zika virus in the Americas. Proc
Natl Acad Sci U S A 2017 May 30;114(22):E4334-E4343 [FREE Full text] [doi: 10.1073/pnas.1620161114] [Medline:
28442561]
http://www.jmir.org/2020/8/e20285/ J Med Internet Res 2020 | vol. 22 | iss. 8 | e20285 | p. 13
(page number not for citation purposes)
XSL• FO
RenderXJOURNAL OF MEDICAL INTERNET RESEARCH Liu et al
29. Rambaut A. Phylogenetic analysis of 23 nCoV-2019 genomes, 2020-01-23. Virological.org. 2020. URL: https://virological.
org/t/phylogenetic-analysis-of-23-ncov-2019-genomes-2020-01-23/335 [accessed 2020-02-05]
30. Imai N, Cori A, Dorigatti I, Baguelin M, Donnelly CA, Riley S, et al. Report 3: Transmissibility of 2019-nCoV. Imperial
College London COVID-19 Response Team. 2020 Jan. URL: https://www.imperial.ac.uk/
mrc-global-infectious-disease-analysis/news--wuhan-coronavirus [accessed 2020-02-05]
31. Andersen K. Estimates of the clock and TMRCA for 2019-nCoV based on 27 genomes. Virological.org. 2020. URL: http:/
/virological.org/t/clock-and-tmrca-based-on-27-genomes/347 [accessed 2020-02-05]
32. Bedford T, Neher R, Hadfield J, Hodcroft E, Ilcisin M, Muller N. Genomic analysis of nCoV spread. Situation report
2020-01-23. Nextstrain. 2020. URL: https://nextstrain.org/narratives/ncov/sit-rep/2020-01-23 [accessed 2020-02-05]
33. Sunnåker M, Busetto AG, Numminen E, Corander J, Foll M, Dessimoz C. Approximate Bayesian computation. PLoS
Comput Biol 2013 Jan 10;9(1):e1002803 [FREE Full text] [doi: 10.1371/journal.pcbi.1002803] [Medline: 23341757]
34. Niehus R, De Salazar PM, Taylor A, Lipsitch M. Quantifying bias of COVID-19 prevalence and severity estimates in
Wuhan, China that depend on reported cases in international travelers. medRxiv 2020 Feb 18:e [FREE Full text] [doi:
10.1101/2020.02.13.20022707] [Medline: 32511442]
35. De Salazar PM, Niehus R, Taylor A, Buckee C, Lipsitch M. Using predicted imports of 2019-nCoV cases to determine
locations that may not be identifying all imported cases. medRxiv 2020 Feb 11:e [FREE Full text] [doi:
10.1101/2020.02.04.20020495] [Medline: 32511458]
36. Sun K, Chen J, Viboud C. Early epidemiological analysis of the coronavirus disease 2019 outbreak based on crowdsourced
data: a population-level observational study. The Lancet Digital Health 2020 Apr;2(4):e201-e208. [doi:
10.1016/s2589-7500(20)30026-1]
37. Pinotti F, Di Domenico L, Ortega E, Mancastroppa M, Pullano G, Valdano E. Lessons learnt from 288 COVID-19
international cases: importations over time, effect of interventions, underdetection of imported cases. medRxiv 2020:e
[FREE Full text] [doi: 10.1101/2020.02.24.20027326]
38. Defays D. An efficient algorithm for a complete link method. The Computer Journal 1977 Apr 01;20(4):364-366. [doi:
10.1093/comjnl/20.4.364]
39. Calinski T, Harabasz J. A dendrite method for cluster analysis. Comm in Stats 1974;3(1):1-27. [doi:
10.1080/03610927408827101]
40. Henelius A, Puolamäki K, Boström H, Papapetrou P. Clustering with Confidence: Finding Clusters with Statistical Guarantees.
arXiv 2016:e [FREE Full text]
41. Sasirekha K, Baby P. Agglomerative Hierarchical Clustering Algorithm - A Review. International Journal of Scientific and
Research Publications 2013;3(3):1-3 [FREE Full text] [doi: 10.1007/978-1-4419-9863-7_100033]
42. Seal HL. Studies in the History of Probability and Statistics. XV The historical development of the Gauss linear model.
Biometrika 1967;54(1-2):1-24. [doi: 10.1093/biomet/54.1-2.1]
43. Tibshirani R. Regression Shrinkage and Selection Via the Lasso. Journal of the Royal Statistical Society: Series B
(Methodological) 1996;58(1):267-288. [doi: 10.1111/j.2517-6161.1996.tb02080.x]
44. Santillana M, Nsoesie E, Mekaru S, Scales D, Brownstein J. Using clinicians' search query data to monitor influenza
epidemics. Clin Infect Dis 2014 Nov 15;59(10):1446-1450 [FREE Full text] [doi: 10.1093/cid/ciu647] [Medline: 25115873]
45. Poirier C, Hswen Y, Bouzille G, Cuggia M, Lavenu A, Brownstein J. Influenza forecasting for the French regions by using
EHR web and climatic data sources with an ensemble approach ARGONet. medRxiv 2019:e [FREE Full text] [doi:
10.1101/19009795]
46. Kraemer MUG, Yang C, Gutierrez B, Wu C, Klein B, Pigott DM, Open COVID-19 Data Working Group, et al. The effect
of human mobility and control measures on the COVID-19 epidemic in China. Science 2020 May 01;368(6490):493-497
[FREE Full text] [doi: 10.1126/science.abb4218] [Medline: 32213647]
47. Wu J, Leung K, Leung G. Nowcasting and forecasting the potential domestic and international spread of the 2019-nCoV
outbreak originating in Wuhan, China: a modelling study. The Lancet 2020 Feb;395(10225):689-697. [doi:
10.1016/s0140-6736(20)30260-9]
Abbreviations
AR: autoregressive
China CDC: Chinese Center for Disease Control and Prevention
COVID-19: coronavirus disease
GLEAM: global epidemic and mobility
I: infectious
L: latent
LASSO: least absolute shrinkage and selection operator
MIDAS: Models of Infectious Disease Agent Study
PHEIC: Public Health Emergency of International Concern
R: removed
http://www.jmir.org/2020/8/e20285/ J Med Internet Res 2020 | vol. 22 | iss. 8 | e20285 | p. 14
(page number not for citation purposes)
XSL• FO
RenderXJOURNAL OF MEDICAL INTERNET RESEARCH Liu et al
RMSE: root mean square error
S: susceptible
SARS-CoV-2: severe acute respiratory syndrome coronavirus 2
WHO: World Health Organization
Edited by G Eysenbach; submitted 14.05.20; peer-reviewed by P Giabbanelli, G Fagherazzi; comments to author 13.07.20; revised
version received 24.07.20; accepted 24.07.20; published 17.08.20
Please cite as:
Liu D, Clemente L, Poirier C, Ding X, Chinazzi M, Davis J, Vespignani A, Santillana M
Real-Time Forecasting of the COVID-19 Outbreak in Chinese Provinces: Machine Learning Approach Using Novel Digital Data and
Estimates From Mechanistic Models
J Med Internet Res 2020;22(8):e20285
URL: http://www.jmir.org/2020/8/e20285/
doi: 10.2196/20285
PMID: 32730217
©Dianbo Liu, Leonardo Clemente, Canelle Poirier, Xiyu Ding, Matteo Chinazzi, Jessica Davis, Alessandro Vespignani, Mauricio
Santillana. Originally published in the Journal of Medical Internet Research (http://www.jmir.org), 17.08.2020. This is an
open-access article distributed under the terms of the Creative Commons Attribution License
(https://creativecommons.org/licenses/by/4.0/), which permits unrestricted use, distribution, and reproduction in any medium,
provided the original work, first published in the Journal of Medical Internet Research, is properly cited. The complete bibliographic
information, a link to the original publication on http://www.jmir.org/, as well as this copyright and license information must be
included.
http://www.jmir.org/2020/8/e20285/ J Med Internet Res 2020 | vol. 22 | iss. 8 | e20285 | p. 15
(page number not for citation purposes)
XSL• FO
RenderXYou can also read