Predicting Aircraft Landing Time in Extended-TMA using Machine Learning Methods - ICRAT
←
→
Page content transcription
If your browser does not render page correctly, please read the page content below
Predicting Aircraft Landing Time in Extended-TMA
         using Machine Learning Methods
        Imen Dhief1 , Zhengyi Wang2 , Man Liang3 , Sameer Alam1 , Michael Schultz4 , and Daniel Delahaye2
                                       1 ATMRI,  Nanyang Technological University, Singapore
                               2 OPTIM    Lab, Ecole Nationale de l’Aviation Civile, Toulouse, France
                             3 School of Engineering, University of South Australia, Adelaide, Australia
                   4 Institute of Logistics and Aviation, Dresden University of Technology, Dresden, Germany

    Abstract—Accurate prediction of aircraft arrival times is one of   scheduled departure, and arrivals, then maintaining an orderly
the fundamental elements for air traffic controllers to manage an      and safe flow in TMA (around 25 NM from the airport). These
optimal arrival and departure sequencing on the runway, reduce         could lead to larger ground taxi times on airports and delays
flight delays, and achieve a good collaboration with airports
and airlines. In this work, we analyze the feature engineering         in the air. On the other hand, with an accurate prediction
problem to predict Aircraft Landing Time (LDT) in Extended-            of arrival and departure times before reaching TMA, airport
TMA with machine learning models. Two main contributions are           ground equipment and crews can be more effectively deployed
highlighted in this work. First, the impact of different features      in advance.
in LDT prediction is investigated. Second, a machine learning             In this paper, we are going to propose a data-based approach
prediction model is presented to predict LDT. Our case of study
is the E-TMA of Singapore Changi Airport (WSSS) with a                 to predict the Landing Time (LDT) of an aircraft in the
radius of 100NM. Firstly, data analysis is conducted to check          Extended-TMA (E-TMA) airspace. With the available data, we
the availability of different resource data, as well as cleaning the   will emphasize on the feature selection and extraction problem
raw trajectory data. Then, feature construction and extraction         in Machine learning methods. Changi airport is considered as
are discussed in details, machine learning prediction models           the case in our study to validate the proposed methodology.
are proposed to address the LDT prediction. The experimental
results show that 4 sets of features play a significant impact on         The structure of this paper is organized as follows. First,
LDT prediction for primary runway-in-use, they are: (1) Control        section II presents an overview of the background, and a
intent: traffic demand, current traffic density, and adjacent flow;    literature review summarizing the previous main works that
(2) Weather: surface wind; (3) Trajectory: the position of aircraft;   belong to the scoop of our topic. Second, section III describes
(4) Seasonality: parts of a day and a week. Moreover, comparing
                                                                       our proposed methodology, which is divided into two sub-
three Machine Learning algorithms, in our study case, Extra-
Trees is the best prediction algorithm compared with other             sections: data preparation and data exploration. Then, section
machine learning models in terms of Root Mean Square Error             IV highlights the feature extraction and prediction model. Sec-
(RMSE) and Mean Absolute Error (MAE). It is also found that            tion V discusses the computational results. Finally, conclusions
Machine learning models perform much better than the current           are drawn in section VI.
operational system. In summary, two main conclusions are drawn
from the present work. First, predicting the aircraft LDT is                              II. S TATE OF THE ART
strongly correlated with the TMA density at the flight operation
time. Second, feature selection with domain knowledge and expert       A. Arrival management in TMA
opinions is very important, and with good features, the model is
less sensitive to the choice of machine learning algorithm.              The ATCO is responsible for guiding each arrival aircraft
    Keywords—Terminal Maneuvering Area, Trajectory predic-             entering the TMA until reaching the runway. In reality, this
tion, Machine learning, Data mining, Aircraft Landing Time.            process is performed as follows:
                                                                         • ATCO assigns to each aircraft the STAR route, which
                                                                            represents a set of way-points to be flown.
                       I. I NTRODUCTION                                  • The Flight Management System (FMS) computes the

   The increase of air traffic demand all over the world                    optimal descent plan and transmits the Estimated Time
emphasizes the pressure around airports, yielding to a high                 of Arrival (ETA) and the feasible time window at the
congestion level on Terminal Maneuvering Area (TMA),                        metering fix to the ATCO.
which causes several air transportation problems, such as flight         • ATCO assigns a Controlled Time of Arrival (CTA) within

delays, the high workload for Air Traffic Controllers (ATCO),               the feasible window.
and non-optimal usage of ground resources [16].                          • FMS computes the optimal descent plan complying with

   Accurate knowledge of aircraft arrival times is one of the               the CTA.
fundamental factors for ATCO to efficiently handle air traffic           • FMS executes the descent plan and meets the CTA.

flows around the airport [13]. With more accurate information          Furthermore, in order to meet the required level of safety
about arrival traffic, arrival manager systems, such as AMAN,          and efficiency, ATCO relies on decision support tools, such
will be more efficient in predicting the arrival sequencing,           as Arrival Manager System (AMAN) to compute the optimal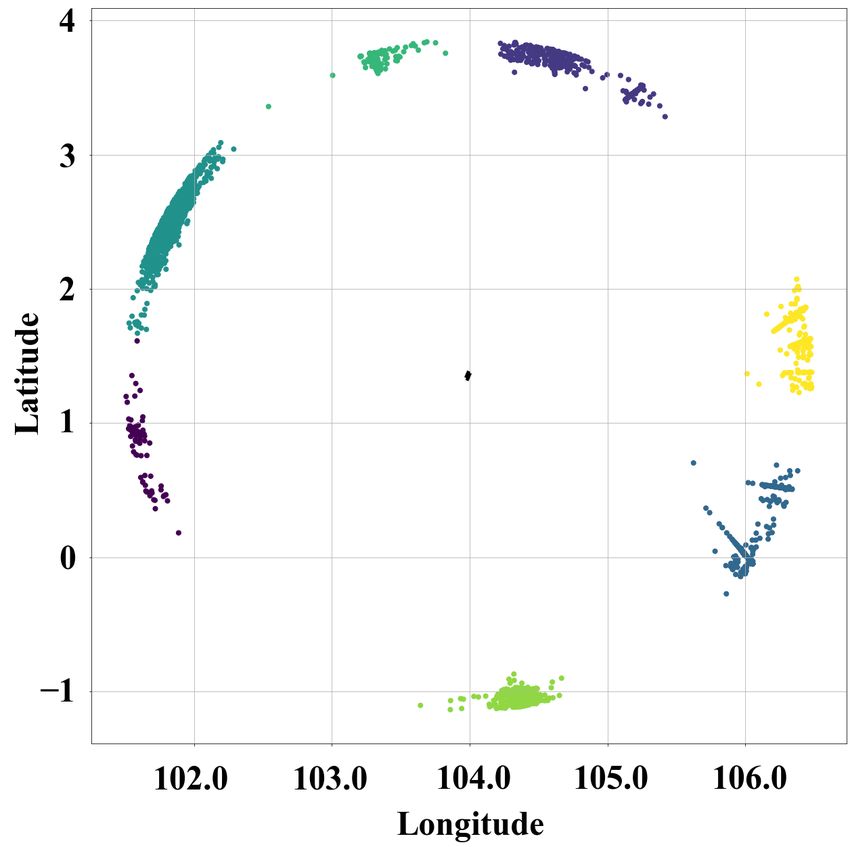
sequences and scheduling of landings flights at the runway.             In particular, predicting LDT using data-based approaches
To this end, the AMAN systems apply prediction models                has been proposed as well. For example, Glina et al. [8] apply
to predict the time of arrival of the aircraft to the runway.        Quantile Regression Forests (QRF) to estimate aircraft landing
The used prediction models heavily rely on mathematical              times. Their model is validated with flight data from the
approaches, which usually fail in accurately predicting flight       Dallas/Fort Worth International Airport. Their findings consist
arrival times due to its inefficiency in handling uncertainties.     of a short-term prediction (with a radius of prediction ranging
As a result, the arrival sequencing has to be updated constantly     between 20-30 NM) of flight arrival times with accuracy about
so as to provide precise information to ATCOs [14], [15]. An         60 seconds for 68% of flights. In the same context, [10]
accurate prediction of aircraft LDT is a challenging task due        presents a short-term trajectory prediction in TMA based on
to the non-deterministic nature of both environmental and air        4D trajectory prediction. Their model consists of data mining
traffic factors which are summarized as follows:                     and Deep Neural Networks (DNNs) model. They predict the
   • Uncertainty in the wind and temperature calculation:            LDT at the TMA (within 25NM from the airport) with a MAE
      FMS uses a typical wind forecast generated by Numerical        of 70 seconds. We believe that controllers need to have an
      Weather Prediction (NWP) models, which is several hours        accurate prediction not only in TMA, but also in larger areas.
      before aircraft reaching the Top Of Descent (TOD).             This will help in better handling the traffic for an optimal flight
   • Inaccuracy in-flight parameter, such as weight and veloc-       sequencing on the runway.
      ity.                                                              Furthermore, feature engineering is the process of trans-
   • The trajectory assigned by the ATCO to the flight is            forming raw data into features that better represent the under-
      unknown in advance.                                            lying problem to the predictive models, resulting in improved
   • ATCO frequently vectors the aircraft from the STAR              model accuracy on unseen data. In data-based LDT prediction
      routes, either by elongating the trajectory or by shortening   researches, several researchers emphasize the importance of
      it. These reroutings are caused by many factors, such          feature selection. For example, the work presented in [9]
      as meeting time constraints at the runway, maintaining         aimed at improving the Estimated Time of Arrival (ETA)
      separation with surrounding traffic, avoiding bad weather,     predictions generated by the Federal Aviation Administration
      or minimizing fuel consumption.                                (FAA)’s Enhanced Traffic Management System (ETMS). In
Those last-minute perturbations of flight sequencing yield to        their work, intensive feature analysis was presented in order
penalizing flight withholding time and trajectory deviations,        to understand the main feature influencing the prediction of
which in turn cause delays and non-optimal flight sequencing.        ETA. By applying Random Forest (RF), they predicted ETA
                                                                     with 78.8% more accurately than the FAA’s ETMS. In [9], they
B. Literature review                                                 did not take trajectory shape into features, but in [11], [12],
   Predicting flight arrival times has attracted numerous atten-     authors propose to cluster trajectories in feature engineering
tion from worldwide researchers in the past decades. Early           before applying the prediction model. Numerical experiments
works focused on LDT prediction by applying deterministic            demonstrated that Neural Network (NN) with DBSCAN pre-
and probabilistic approaches that heavily rely on aircraft           possessing performs best in terms of Mean Absolute Error
performance models, along with either parametric or physics-         (MAE) and Root Mean Square Error (RMSE). However, the
based trajectory models. The models are based on kine-               aircraft trajectories with holding pattern are all considered as
matic assumptions where parameters are determined based              noise and not served as input for the prediction model. As
on aircraft performance, planned flight routes and predicted         inspired by Hong et al. [1], in our research, controllers intent
atmospheric conditions [5]–[7]. Despite the significant contri-      will be considered as an important feature in our prediction
butions of these aircraft performance models, their main issues      model. We are trying to build up the features to reflect
are that they rely on ideal assumptions while overlooking the        the controllers’ decisions impact on the trajectory prediction.
actual constraints and human behavior factors.                       We would like to investigate the assumption that the LDT
   On the other hand, when dealing with uncertainty and pre-         prediction model may achieve higher accuracy with more
diction problems, machine learning approaches are powerful           operational features.
tools that have proved their efficiencies in many fields for            Thus, given a set of historical flight data, our objective is
several years. In the context of aviation, several methods from      to implement a data-based approach to predict the LDT for
the field of artificial intelligence are used to cluster [24]–       each arrival aircraft in E-TMA. The framework of concept
[27], detect anomalies [28], [29], [33], [34] and predict aircraft   is illustrated in Figure 1. We will address the following
trajectories [35]–[37], predict and resolve conflicts [30], [31],    challenges:
develop dynamic airspace designs [38], [39], analyse runway             • All features related to arrival time prediction are consid-
and apron operations [32], [33], [40]–[42], determine airport              ered and discussed in detail. Especially, wind data and
performance including the impact of local weather events [43],             controllers’ decision intent will be considered in feature
[44], and for airport terminal operations (turnaround) [45].               engineering.
More initiatives to leverage ADS-B open data in order to                • Some deviations of the flight trajectories from the as-
improve the state of the art are already commonplace, esp.                 signed STAR route are considered. Trajectories with
in the field of aircraft modelling [46], [47].                             normal holding are included in the experiments.
aircraft located up to 400 km far away, while the range is much
lower for aircraft flying in low altitude or on the ground. For
each flight trajectory, ADS-B data are recorded with unequal
frequency. Thus, interpolation was performed on trajectory
points in order to fix the time difference between 2 adjacent
records as 5 seconds.
Fig. 1: Framework
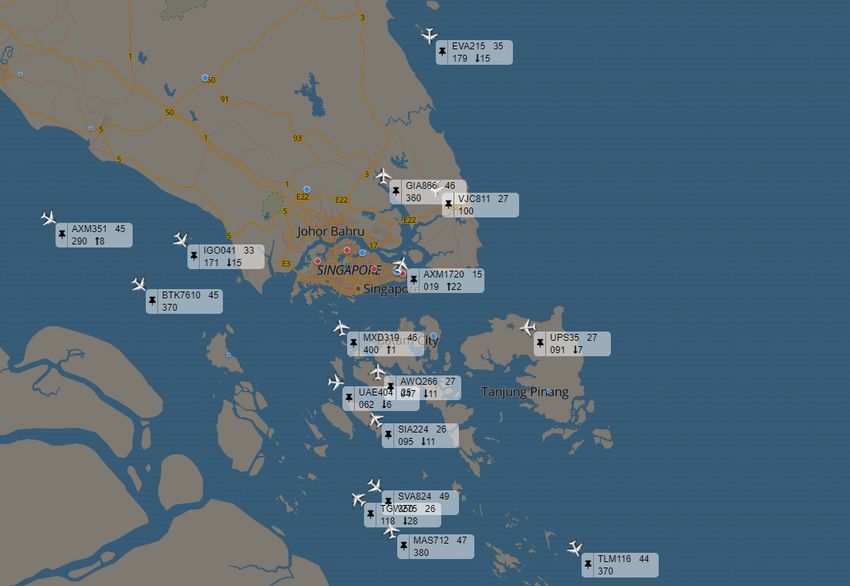
III. DATA ANALYSIS Fig. 2: ADS-B messages received from arriving and departing
The performance of data-based algorithms is directly related aircraft at Changi airport (https://opensky-network.org/)
to the quality of the data. A common problem affecting the
quality of data is the presence of noise and outliers. Noise 3) Flight operational data: The flight operational data
instances refer to unnecessary information with missing or include Scheduled Time of Departure (STD), Actual Time
invaluable attributes, while outliers refer to instances with of Departure (ATD), Scheduled Time of Arrival (STA), and
exceptional values in comparison with the rest of the data. Actual Time of Arrival (ATA) for each flight. Flight plan
In this section, we describe the data we use in our model, information (STD and STA) are provided by the website of
as well as the techniques applied to remove both noise and Changi airport. Furthermore, ATA is calculated using a data-
outliers. driven milestone approach [19], [42].
4) Meteorological data: The meteorological data comes
A. Data source from Singapore Changi airport station. This data contains
The data used in this work is related to arrival flights to surface wind information, including wind direction (relative
Changi International Airport (ICAO: WSSS) in March and to true north) and wind speed. Each record is stated as the
April of 2019. They are collected from the following sources: measured or estimated mean value of each component over the
1) TMA airspace data: WSSS has two parallel runways for 10 minutes prior to the issue time, unless there are significant
domestic use, designated as 02L/20R and 02C/20C. variations during this period. This data updates every half-
2) Trajectory data: The trajectory data source of this hour.
study is Automatic Dependent Surveillance-Broadcast (ADS- B. Data cleaning
B) flight data. The public availability of aircraft ADS-B
messages has contributed to the development of online services 1) Noise filtering: The following points are considered as
that display the current air traffic in real-time with worldwide noise data, which should be removed:
receiver networks (depending on the local coverage), such as • Duplicated data;
The OpenSky Network [17] (see Figure 2) or Flightradar24 • Trajectories with less than 30 recording points;
(flightradar24.com). However, aircraft that are not equipped • Trajectories with missing points are retained and missing
with ADS-B transponder are not considered in the current points are tuned by interpolation. However, if one of the
study since we do not have their flight data. ADS-B is a co- flight or airport features are missing, this flight is not
operative surveillance technology, which provides situational considered. Also, if STD, ATD, STA are missing, this
awareness in the air traffic management system. Aircraft deter- flight is removed from the dataset.
mine their position via satellite, inertial and radio navigation 2) Outliers removing: In statistics, an outlier is an observa-
and periodically emit it (roughly one sample per second) tion point that is distant from other observations. To keep our
with other relevant parameters to ground stations and other data coherent in terms of remaining flight time (or travel time
equipped aircraft. Signals are broadcast at 1090 MHz: a decent in E-TMA), flights with very long trajectories (generally the
ADS-B receiver antenna can receive messages from cruising trajectory with very long holding time) should be removed.For this reason, we apply the standard deviation method. This IV. M ETHODOLOGY
approach ensures that 85% of remaining flight time is within A. Feature construction and extraction
the standard deviation from the mean. As a result, trajectories
with reasonable holding are still included in the experiments. In ADS-B data, there are a list of features could be used
to predict the LDT. However, based on the discussions with
domain experts in Air Traffic Management (ATM), other
C. Data exploration factors may significantly influence the LDT prediction as well,
Data exploration aims to investigate the main characteristics they could be included as features in LDT prediction problem.
of the dataset. Firstly, raw data contains 4985 flight trajectories Detailed discussions are listed as following:
in WSSS area. After removing outliers and missing data, the • Entry zone: Figure 5 plotted the points 100NM away from
remaining dataset includes 3762 flight trajectories. Further- the airport of trajectories in the training set. It can be
more, it is found that runways 02L and 02C accommodate seen that flights are coming from mainly 7 directions. we
about 90% of the traffic (3376 flight). Thus, this research cluster the flights into different entry zones according to
focus on runway 02L and runway 02C. All aircraft trajectories the angle with the runway. The entry zone of each flight
landing to North are illustrated in Figure 3. Furthermore, it is then becomes a feature to specify the coming direction
of flights.
Fig. 3: Arrival trajectories with primary runway-in-use 02L
and 02C at WSSS
of significance to explore the distribution of predicted value.
The histogram and distribution of remaining flight time are
shown in Figure 4. The distribution is estimated with the kernel
density estimate. The mean is 25.17 min and the standard Fig. 5: Flight entry zone clusters
deviation is 2.25 min. The magnitude and variation of the
predicted values provide another perspective on the difficulty • Traffic density and capacity: generally, if the traffic den-
of this prediction task. sity is lower, then the traffic demand may be lower than
capacity; If the traffic density is super higher, then the
traffic demand may be higher than capacity. The traffic
demand, density, and flow conditions directly link the
current or potential complexity of the airport. As a result,
the flight trajectories more likely deviated from the STAR
route and longer than normal. More seriously, even with
holding and delay may happen. In order to measure this
aspect, the following features are considered:
– Number of flights entering the E-TMA in the past
15 minutes.
– Number of flights expected to enter the E-TMA in
the next 15 minutes.
– Number of flights departing from WSSS in the past
15 minutes.
– Number of flights departing from WSSS in the next
15 minutes.
Fig. 4: Remaining flight time distribution – Number of flights entering the E-TMA from the same
flight entry zone in the past 15 minutes.– Number of flights expected to enter the E-TMA from Forests (RF) [22] and Extra-Trees (ET) [23]. Deep learning
the same flight entry zone in the next 15 minutes. techniques and linear models are not used, since deep learning
• Landing sequencing: deviation of trajectories is strongly is hard to be implemented with limited data, and linear
related to the arrival sequencing on the runway. The flight models are not suitable for this task. GBM is a famous
trajectory could be elongated or shortened in order to ensemble learning method and can be viewed as iterative
satisfy an optimal and safe use of the runway. There- functional gradient descent algorithms. RF are popular tree-
fore, based on First-Come-First-Serve (FCFS) arrival based ensemble learning method. They are combinations of
sequencing on the runway, we are considering to add the tree predictors such that each tree in the forest depends on the
following features for each flight: values of a random vector sampled independently and with
– Decision intent: it can be either elongation if the the same distribution. With the combination of weak learners,
flight is expected to shift its initial landing slot a stronger learner will be generated. As an ideal candidate for
backward; or nominal if the flight is expected to keep bootstrap aggregating (bagging) algorithm, the idea in RF is
its initial landing slot, or short-cut if the flight is to improve the variance reduction of bagging by reducing the
expected to shift its initial landing slot forward. correlation between the trees, without increasing the variance
– Time shift: represents the time window needed in too much. ET are also a popular tree-based ensemble learning
order to satisfy the optimal sequencing on the runway model. ET are very similar to RF, except for the sampling and
resulting from the FCFS algorithm. The time shift is split strategy.
positive in case of elongation, null in case of nominal
and negative in case of short-cut. V. R ESULTS
• Seasonality: the chronological information is important A. Feature discussion
to consider when tracking air traffic data. traffic flow in All possible feature types are summarized in Table I.
the airport can be affected by different seasonal factors, These features could be grouped into 6 types: aircraft-related
including the time of the day, holiday, etc. Limited by the features, airport-related features, trajectory related features,
size of the dataset, we only focus on the daily and weekly weather-related features, control intent related features and
patterns. To avoid creating too many features (24 hours seasonality related features. All categorical features are en-
per day, 7 days per week), for each record, the hour is coded into dummy variables, namely one-hot encoding. The
classified into the morning, afternoon, or dark by sunrise final feature set contains 244 features. Remark that the avail-
time, solar noon and sunset time. The date is classified able data is not rich enough for training given such number
into weekday or weekend. In the dark, the traffic demand, of features. Besides, the large number of dummy variables
density, and flow become few. On the contrary, they are make the feature set very sparse. Some of the features may be
more likely dense in the morning and afternoon, but with either redundant or irrelevant. Thus, feature selection should
opposite trends. The air traffic flow also links with days be performed.
of the week. To have an initial impression on the relationship between
• Wind: firstly, surface wind direction and speed will affect features and target variable, Pearson correlation coefficient is
the runway-in-use for arrival flights, because generally, used as a measure of the linear correlation between variables.
aircraft need to land in headwind condition. In excep- It’s absolute value is between 0 and 1, 0 is no linear correlation
tional tailwind conditions, the maximum tailwind limita- and 1 is total linear correlation. Figure 6 highlights the 20
tion for a safe landing is normally 15 knots. Secondly,
tailwind conditions at high altitudes will increase aircraft
ground speed. Thus, if the remaining distance is fixed,
then the required flight time will be shorter. In our case,
if the traffic density in TMA is low, and there is no
capacity limitation at airport, then a tailwind condition
will definitely accelerate the aircraft to land at the airport;
however, if there is already frequent delay happening
at the airport, then the tailwind effect on aircraft land-
ing time prediction could be ignored. In brief, tailwind
conditions in high altitudes will benefit the aircraft with
decision intent labeled by short-cut. Currently, we don’t
have the wind field data, as the wind energy will increase
with the altitude in E-TMA airspace, so we will only use
surface wind data in this paper.
B. Prediction models
Several machine learning models are used in this study, Fig. 6: Absolute Pearson correlation efficient between features
including Gradient Boosting Machine (GBM) [21], Random and target variableTABLE I: Summary of All Possible Features
Group Feature Description
Airline Name of the airline
Aircraft
Aircraft type Type of the aircraft
Departure airport Airport the flight departs from
Airport Destination airport Airport the flight arrives to
Runway Runway the aircraft will be landing in
Latitude, longitude and altitude 3D position of the flight at each point
Speed Ground-speed of the aircraft at each position
RoC Rate of climb of the aircraft at each position
Heading Heading of the aircraft at each position
Trajectory
STD Scheduled Time of Departure at the runway
ATD Actual Time of departure at the runway
STA Scheduled Time of Arrival at the runway
Entry zone The zone that flight is coming from in E-TMA
Weather Surface wind Wind direction and speed
Current traffic density Number of arrival and departure aircraft in the last 15 minutes in E-TMA
Traffic demand Number of arrival and departure aircraft in the next 15 minutes in E-TMA
Control intent Adjacent flow Number of aircraft in the last and next 15 minutes in the same entry zone
Landing sequencing decision Elongation, Short-cut, or Nominal based on FCFS sequencing
Sequencing time shift The amount of shift time for safe sequencing and landing
Parts of a day Morning, afternoon, or dark
Seasonality
Parts of a week weekday or weekend
highest Pearson correlation coefficients between the model B. Prediction results
features and the flight LDT. It can be seen that even the The LDT prediction model evaluation is based on two
highest coefficient is less than 0.2, which indicates that there metrics : Mean Absolute Error (MAE) and Root Mean Square
is no obvious linear correlation between features and LDT. Error (RMSE), computed as follows:
The nonlinear relationship between the explanatory variable
n
and the response variable illustrate again the great challenge 1X
of this study. MAE = |yi − y˜i | (1)
n i=1
To select the features, permutation feature importance is
introduced [20]. It is defined to be the decrease in a model v
u n
score when a single feature value is randomly shuffled. Figure u1 X
RMSE = t (yi − y˜i )2 (2)
7 illustrates the first 20 important features in the training set of n i=1
three models. These features are selected as the input variables
for each model. Each feature is permuted for 20 times. The where n is the number of flights in the test flight set, y˜i is the
overall permutation importance of each feature is illustrated LDT predicted value of the i-th flight and yi is its true value.
by the box plot. The prediction results are shown in Table II. The perfor-
These feature ranking results give an insight into the impact mance of the three machine learning models is compared
of the model attributes on the prediction results. However, for the two runway in-use. By comparing the results of the
each model has a different view of features for the prediction. three models we notice that our problem is less sensitive to
Therefore, the feature importance differs for different models. the choice of the machine learning model. In fact, the MAE
In RF, the traffic demand, current traffic density, parts of a day difference between the three models is less than 5 seconds for
and surface wind are considered more important than other runway 02L, and 10 seconds for runway 02C. Nevertheless,
features. These features are also important in ET, but the parts in our model, ET provides better results than RF and GBM in
of a day are more focused on. In terms of GBM, the case terms of MAE and RMSE for the two runway-in-use.
is overall similar to other models, but a certain aircraft type To further evaluate the prediction result of machine learning
A388, the world’s largest passenger airliner, is thought to be models, we demand the ETA data predicted by the current
relevant to LDT. Among the three models, 4 groups of features operations system in WSSS and the ATA data of these flights
play a significant impact on LDT prediction, they are: from the airport operations control center. The operations
system is called baseline. For comparison, the best machine
1) Control intent: traffic demand, current traffic density and
learning model reduces the MAE over 50 seconds and the
adjacent flow;
RMSE nearly 150 seconds. In terms of runway 02L, MAE
2) Weather: surface wind;
is reduced by over 30 seconds and RMSE is reduced by
3) Trajectory: the position of aircraft;
nearly 100 seconds. This result also reflects the prediction
4) Seasonality: parts of a day and a week;
of LDT made by the current operations system is not stable,
The common important features provide a novel point of which contains very large errors. Machine learning models
view of the artificial intelligence point of view on the factors perform much better, which can be used to enhance the airport
that influence LDT. operations system.TABLE II: Aircraft LDT Prediction Results
02L 02C
Models
MAE (s) RMSE (s) MAE (s) RMSE (s)
Baseline 142.84 260.13 116.14 200.08
RF 101.92 125.94 94.19 115.2
ET 91.96 111.97 85.32 104.05
GBM 93.07 114.8 86.47 106.14
First, predicting the aircraft LDT is strongly correlated with
the TMA density at the flight operation time. This is not sur-
prising as in dense traffic controllers require more elongations
to handle the traffic sequencing on the runway, while in less
(a) RF dense situations, short-cut trajectories are frequently proposed.
Second, feature selection with domain knowledge and expert
opinions is very important, and with good features, the model
is less sensitive to the choice of machine learning algorithm.
In future works, we plan to include wind field data at the ex-
tended TMA, not only the runway surface wind. Furthermore,
in our current model, we do not consider dynamic runway
change. Thus, a classification model for runway prediction
should be investigated.
ACKNOWLEDGEMENT
This research is supported by the Civil Aviation Authority
of Singapore under the Aviation Transformation Program.
We appreciate the insightful discussion with domain experts
(b) ET in Eurocontrol.
R EFERENCES
[1] S. Hong and K. Lee, Trajectory prediction for vectored area navigation
arrivals, Journal of Aerospace Information Systems, vol. 12, no. 7, pp.
490–502, 2015.
[2] J. Zhang, Z. Zheng, P. Zhao and R. Hu, ”Multi-objective integrated
arrival departure aircraft sequencing under the influence of sequen-
tial flights,” 2018 Integrated Communications, Navigation, Surveillance
Conference (ICNS), Herndon, VA, 2018.
[3] S. Abba-Rapaya, P. Notry, D. Delahaye. Coordinated Sequencing of
Traffic on Multiple En-route Constraint Points. EIWAC 2019 Exploring
Ideas for World Aviation Challenges, ENRI, Oct 2019.
[4] M. Liang, D. Delahaye, M. Sbihi and J. Ma, ”Multi-layer Point Merge
System for dynamically controlling arrivals on parallel runways,” 2016
IEEE/AIAA 35th Digital Avionics Systems Conference (DASC), Sacra-
mento, CA, 2016.
[5] Krozel, Jimmy A. et al. Estimating time of arrival in heavy weather con-
(c) GBM
ditions, Book Chapter- Guidance, Navigation, and Control Conference
Fig. 7: Permutation importance of models and Exhibit, 1999.
[6] Levy, Benjamin S. and David Barkin Rappaport. Arrival Time Estima-
tion (ETA) from On-Final to Gate, Book Chapter- 7th AIAA ATIO
Conference, 2007.
VI. C ONCLUSIONS [7] Huang, Haomiao Roy, Kaushik Tomlin, Claire. Probabilistic Estimation
of State-Dependent Hybrid Mode Transitions for Aircraft Arrival Time
Prediction. Book Chapter- AIAA Guidance, Navigation and Control
In this work, a method to predict aircraft Landing Times Conference and Exhibit 2007.
(LDT) is presented. The proposed model includes data analysis [8] Glina, Van, Richard Jordan, and Mariya lshutkina. ”A Tree-Based
in order to determine the most important features that have Ensemble Method for the Prediction and Uncertainty Quantification
of Aircraft Landing Times.” American Meteorological Society -10th
an impact on predicting the arrival times on runway. Then, 3 Conference on Artificial intelligence Applications to Environmental
machine learning models are trained for the prediction. Science, New Orleans, LA. 2012.
In order to evaluate the performance of our models, com- [9] Kern, Christian and de Medeiros, Ivo and Yoneyama, Takashi. (2015).
Data-driven aircraft estimated time of arrival prediction. 9th Annual
putational results are conducted on real traffic data for Changi IEEE International Systems Conference, SysCon 2015 - Proceedings.
Extended TMA. Two important conclusions can be drawn. p. 727-733, 2015.[10] Zhengyi Wang, Man Liang, Daniel Delahaye. Short-term 4D Trajectory [33] Xavier Olive and Pierre Bieber. Quantitative Assessments of Runway
Prediction Using Machine Learning Methods. 7th SESAR Innovation Excursion Precursors using Mode S data. Proc. of the International
Days, Nov 2017. Conference for Research in Air Transportation, 2018.
[11] Zhengyi Wang, Man Liang, Daniel Delahaye. A hybrid machine learning [34] Basora, Luis and Olive, Xavier and Dubot, Thomas. Recent Advances
model for short-term estimated time of arrival prediction in terminal ma- in Anomaly Detection Methods Applied to Aviation. Aerospace, 2019.
noeuvring area. Transportation research. Part C, Emerging technologies, [35] Y. Lv and Y. Duan and W. Kang and Z. Li and F. Wang. Traffic flow
Elsevier, 2018. prediction with big data: A deep learning approach. IEEE Transactions
[12] Zhengyi Wang, Man Liang, Daniel Delahaye. Automated Data-Driven on Intelligent Transportation Systems, 2015.
Prediction on Aircraft Estimated Time of Arrival. 8th SESAR Innovation [36] Di Ciccio, Claudio and Van der Aa, Han and Cabanillas, Cristina
Days, Dec 2018. and Mendling, Jan and Prescher, Johannes. Detecting flight trajectory
[13] Eurocontrol Airport CDM Team. Airport CDM Implementation Manual, anomalies and predicting diversions in freight transportation. Decision
ver. 5, 2017. Support Systems, 2016.
[14] Tielrooij, Maarten Borst, Clark Van Paassen, Marinus M. Mulder, Max. [37] Yulin Liu and Mark Hansen and David J. Lovell and Michael O. Ball.
(2015). Predicting arrival time uncertainty from actual flight information. Predicting Aircraft Trajectory Choice – A Nominal Route Approach.
[15] Daichi Toratani, Application of merging optimization to an arrival man- Proc. of the International Conference for Research in Air Transportation,
ager algorithm considering trajectory-based operations, Transportation 2018.
Research Part C: Emerging Technologies, Volume 109, 2019. [38] Gerdes, I. and Temme, A. and Schultz, M. Dynamic airspace sectoriza-
[16] Performance Review Commission. Performance Review Report: An tion using controller task load. 6th SESAR Innovation Days, 2016.
Assessment of Air Traffic Management in Europe during the Calendar [39] I. Gerdes and A. Temme and M. Schultz. Dynamic airspace sectorisation
Year 2018, 2019. for flight-centric operations. Transportation Research Part C: Emerging
[17] A Schäfer, Matthias and Strohmeier, Martin and Lenders, Vincent and Technologies, 2018.
Martinovic, Ivan and Wilhelm, Matthias. Bringing up OpenSky: large- [40] Floris Herrema and Ricky Curran and Sander Hartjes and Mohamed
scale ADS-B sensor network for research, Proceedings of the 13th Ellejmi and Steven Bancroft and Michael Schultz. A machine learning
international symposium on Information processing in sensor networks, model to predict runway exit at Vienna airport. Transportation Research
pages 83-94, 2014. Part E: Logistics and Transportation Review, 2019.
[41] Schultz, M. and Post, J. and Alam, S. Concept of a data-driven airport
[18] Schultz, M. and Rosenow, J. and Olive, X. A-CDM Lite: situation
management using ADS-B data. EIWAC, 2019.
awareness and decision making for small airports based on ADS-B data,
[42] Schultz, M. and Rosenow, J. and Olive, X. A-CDM Lite: situation
9th SESAR Innovation Days, 2019
awareness and decision making for small airports based on ADS-B data.
[19] Schultz, M. and Olive, X. and Rosenow, J. and Fricke, H. and Alam, S.
9th SESAR Innovation Days, 2019.
Analysis of airport ground operations based on ADS-B data, 1st confer-
[43] Reitmann, S. and Schultz, M. Computation of Air Traffic Flow Man-
ence on Artificial Intelligence and Data Analytics for Air Transportation,
agement Performance with Long Short-Term Memories Considering
2020.
Weather Impact. Lecture Notes in Computer Science, 2018.
[20] André Altmann, Laura Toloşi, Oliver Sander, Thomas Lengauer, Per- [44] Reitmann, S. and Alam, S. and Schultz, M. Advanced Quantification
mutation importance: a corrected feature importance measure, Bioinfor- of Weather Impact on Air Traffic Management - Intelligent Weather
matics, Volume 26, Pages 1340–1347, 15 May 2010. Categorization with Machine Learning. 13th USA/Europe ATM R&D
[21] FRIEDMAN, Jerome H. Greedy function approximation: a gradient Seminar, 2017.
boosting machine. Annals of statistics, p. 1189-1232, 2001. [45] Schultz, M. and Reitmann, S. Machine learning approach to predict air-
[22] LIAW, Andy, WIENER, Matthew, et al. Classification and regression by craft boarding. Transportation Research Part C: Emerging Technologies,
randomForest. R news, 2002. 2019.
[23] GEURTS, Pierre, ERNST, Damien, et WEHENKEL, Louis. Extremely [46] Sun, Junzi and Ellerbroek, Joost and Hoekstra, Jacco M. Aircraft
randomized trees. Machine learning, 2006. initial mass estimation using Bayesian inference method. Transportation
[24] Basora, Luis and Courchelle, Valentin and Bedouet, Judicaël and Dubot, Research Part C: Emerging Technologies, 2018.
Thomas. Occupancy Peak Estimation from Sector Geometry and Traffic [47] Sun, Junzi. Open Aircraft Performance Modeling Based on an Analysis
Flow Data. 8th SESAR Innovation Days, 2018. of Aircraft Surveillance Data. Delft University of Technology, 2019.
[25] Gariel, Maxime and Srivastava, Ashok N and Feron, Eric. Trajectory
clustering and an application to airspace monitoring. IEEE Transactions
on Intelligent Transportation Systems, 2011.
[26] Basora, Luis and Morio, Jérôme and Mailhot, Corentin. A Trajectory
Clustering Framework to Analyse Air Traffic Flows. 7th SESAR Inno-
vation Days, 2017.
[27] Olive, Xavier and Morio, Jérôme. Trajectory clustering of air traffic
flows around airports. Aerospace Science and Technology, 2019.
[28] Olive, Xavier and Grignard, Jeremy and Dubot, Thomas and Saint-
Lot, Julie. Detecting Controllers’ Actions in Past Mode S Data by
Autoencoder-Based Anomaly Detection. 8th SESAR Innovation Days,
2018.
[29] Das, Santanu and Matthews, Bryan L and Srivastava, Ashok N and Oza,
Nikunj C. Multiple kernel learning for heterogeneous anomaly detection:
algorithm and aviation safety case study. Proc. of the 16th international
conference on Knowledge discovery and data mining, 2010.
[30] N. P. Tran and D. Pham and S. K. Goh and S. Alam and V. Duong,
An Intelligent Interactive Conflict Solver Incorporating Air Traffic Con-
trollers’ Preferences Using Reinforcement Learning, Integrated Com-
munications, Navigation and Surveillance Conference (ICNS), pp. 1-8,
2019.
[31] Duc-Thinh Pham and Ngoc Phu Tran and Sim Kuan Goh and Sameer
Alam and Vu Duong, Reinforcement Learning for Two-Aircraft Conflict
Resolution in the Presence of Uncertainty, IEEE-RIVF International
Conference on Computing and Communication Technologies (RIVF),
pp. 1-6, 2019.
[32] V. Ramanujam and H. Balakrishnan, ”Data-Driven Modeling of the
Airport Configuration Selection Process,” in IEEE Transactions on
Human-Machine Systems, vol. 45, no. 4, pp. 490-499, Aug. 2015.You can also read