Pain Assessment Tool With Electrodermal Activity for Postoperative Patients: Method Validation Study - XSL FO
←
→
Page content transcription
If your browser does not render page correctly, please read the page content below
JMIR MHEALTH AND UHEALTH                                                                                                                     Aqajari et al

     Original Paper

     Pain Assessment Tool With Electrodermal Activity for
     Postoperative Patients: Method Validation Study

     Seyed Amir Hossein Aqajari1, BSc; Rui Cao1, BSc; Emad Kasaeyan Naeini2, MSc; Michael-David Calderon3, BS;
     Kai Zheng4, PhD; Nikil Dutt2, PhD; Pasi Liljeberg5, PhD; Sanna Salanterä6,7, PhD; Ariana M Nelson3,8, MD; Amir
     M Rahmani1,2,9,10, PhD
     1
      Department of Electrical Engineering and Computer Science, University of California, Irvine, Irvine, CA, United States
     2
      Department of Computer Science, University of California, Irvine, Irvine, CA, United States
     3
      Department of Anesthesiology and Perioperative Care, University of California, Irvine, Irvine, CA, United States
     4
      Department of Informatics, University of California, Irvine, Irvine, CA, United States
     5
      Department of Future Technology, University of Turku, Turku, Finland
     6
      Department of Nursing Science, University of Turku, Turku, Finland
     7
      Turku University Hospital, University of Turku, Turku, Finland
     8
      School of Medicine, University of California, Irvine, Irvine, CA, United States
     9
      School of Nursing, University of California, Irvine, Irvine, CA, United States
     10
          Institute for Future Health, University of California, Irvine, Irvine, CA, United States

     Corresponding Author:
     Seyed Amir Hossein Aqajari, BSc
     Department of Electrical Engineering and Computer Science
     University of California, Irvine
     2200 Engineering Hall
     Irvine, CA
     United States
     Phone: 1 9495379373
     Email: saqajari@uci.edu

     Abstract
     Background: Accurate, objective pain assessment is required in the health care domain and clinical settings for appropriate
     pain management. Automated, objective pain detection from physiological data in patients provides valuable information to
     hospital staff and caregivers to better manage pain, particularly for patients who are unable to self-report. Galvanic skin response
     (GSR) is one of the physiologic signals that refers to the changes in sweat gland activity, which can identify features of emotional
     states and anxiety induced by varying pain levels. This study used different statistical features extracted from GSR data collected
     from postoperative patients to detect their pain intensity. To the best of our knowledge, this is the first work building pain models
     using postoperative adult patients instead of healthy subjects.
     Objective: The goal of this study was to present an automatic pain assessment tool using GSR signals to predict different pain
     intensities in noncommunicative, postoperative patients.
     Methods: The study was designed to collect biomedical data from postoperative patients reporting moderate to high pain levels.
     We recruited 25 participants aged 23-89 years. First, a transcutaneous electrical nerve stimulation (TENS) unit was employed to
     obtain patients' baseline data. In the second part, the Empatica E4 wristband was worn by patients while they were performing
     low-intensity activities. Patient self-report based on the numeric rating scale (NRS) was used to record pain intensities that were
     correlated with objectively measured data. The labels were down-sampled from 11 pain levels to 5 different pain intensities,
     including the baseline. We used 2 different machine learning algorithms to construct the models. The mean decrease impurity
     method was used to find the top important features for pain prediction and improve the accuracy. We compared our results with
     a previously published research study to estimate the true performance of our models.
     Results: Four different binary classification models were constructed using each machine learning algorithm to classify the
     baseline and other pain intensities (Baseline [BL] vs Pain Level [PL] 1, BL vs PL2, BL vs PL3, and BL vs PL4). Our models
     achieved higher accuracy for the first 3 pain models than the BioVid paper approach despite the challenges in analyzing real
     patient data. For BL vs PL1, BL vs PL2, and BL vs PL4, the highest prediction accuracies were achieved when using a random

     https://mhealth.jmir.org/2021/5/e25258                                                               JMIR Mhealth Uhealth 2021 | vol. 9 | iss. 5 | e25258 | p. 1
                                                                                                                        (page number not for citation purposes)
XSL• FO
RenderX
JMIR MHEALTH AND UHEALTH Aqajari et al
forest classifier (86.0, 70.0, and 61.5, respectively). For BL vs PL3, we achieved an accuracy of 72.1 using a k-nearest-neighbor
classifier.
Conclusions: We are the first to propose and validate a pain assessment tool to predict different pain levels in real postoperative
adult patients using GSR signals. We also exploited feature selection algorithms to find the top important features related to
different pain intensities.
International Registered Report Identifier (IRRID): RR2-10.2196/17783
(JMIR Mhealth Uhealth 2021;9(5):e25258) doi: 10.2196/25258
KEYWORDS
pain assessment; recognition; health monitoring; wearable electronics; machine learning; electrodermal activity; post-op patients
skin produces sweat via over 3 million small tubular sweat
Introduction glands. Sweat glands are distributed across the body but with
Pain assessment is a key factor in successful pain management the highest densities on the soles of the feet, palms and fingers,
[1]. Inaccurate postoperative pain assessment may cause and forehead and cheeks. If a patient is exposed to a certain
illnesses [2] and even long-term chronic issues [3]. Pain group of stimuli, they can be triggered to secrete moisture,
assessment tools for clinical use are in great demand. If termed emotional sweating. This results in a decrease in skin
communication ability is limited or even lost due to surgery or resistance, or in other words, an increase in skin conductance
illness complications, it is difficult for a doctor to determine [16], which is also known as EDA or galvanic skin response
the patient's feelings. A proper pain assessment tool can offer (GSR). Other than pain, the EDA signal can extract a variety
an approximate pain level of that patient for further treatment. of valuable information from the human body. Rostami et al
For now, the wide range of pain assessment methods still cannot [17] highlighted an important insight that, by using the GSR
determine the precise pain prevalence and levels for adults in signal, the biological impact of food on a person’s body can be
hospitals [4]. That may cause incorrect treatment and lead to captured.
various problems and risks for patients. Painkillers have many Pain assessment research only using EDA data is limited.
side effects, and overtreatment of pain can trigger respiratory Eriksson et al [18] and Munsters et al [19] validated the
depression in the short term or substance use disorder in the relationship between EDA and pain for newborn infants, suitable
long term [5]. However, undertreatment of pain may result in for automated pain assessment due to their inability to
chronic pain, more health care costs, and physiological and communicate. By monitoring the EDA data during routine blood
psychological suffering [3,6]. All these issues mentioned are sampling or care intervention, they found EDA can differentiate
prevalent among noncommunicative patients [7]. A valid pain between pain and no pain; however, more research is needed
assessment tool would be truly transformative to health care to achieve a clinical-grade level. Manivannan et al [20] verified
delivery as clinicians could deliver pain treatments and assess whether the EDA could be used as a valid pain indicator for
response in real time. This would decrease unwanted side effects hypnotic analgesia with 10 participants. They used an iron disk
and recovery time from illness or a procedural intervention. to create mechanical pain in a laboratory setup. The
With the rapid development of Internet-of-Things (IoT) devices, experimental results show a clear relation between pain scores
including wearable devices, automated and continuous objective and EDA. None of these mentioned works used machine
pain intensity assessment is possible [8]. The accuracy of these learning algorithms to create a classification model for pain
wearable devices has been evaluated in several studies. As an assessment. Furthermore, their dataset includes healthy patients
example, Mehrabadi et al [9] validated the accuracy of these with various stimulus methods to cause pain. In another work,
devices in terms of sleep. Researchers try to identify nervous Susam et al [21] attempted to assess postoperative pain using
reaction to pain by monitoring the fluctuation in patients' EDA through a machine learning model. Their model could
physiological data, including electromyography, distinguish between clinical moderate-to-severe pain and no-pain
electrocardiography, photoplethysmography, and electrodermal conditions. However, their work only focused on children as a
activity (EDA) in real time [10,11]. Other research uses facial population.
expression and head movement to accompany the physiological To the best of our knowledge, for the first time in this paper,
data [12,13]. These methods can quantify pain intensity, we present an automatic and versatile pain assessment tool to
especially for poorly communicating patients [14]. However, predict different pain levels in postoperative adults using only
all these methods to date use stimulated pain and were evaluated EDA signals as a physiological signal. In our pain assessment
on healthy participants. Based on this observation, we developed tool, we used 11 different time-domain features extracted from
the UCI iHurt Dataset (UCI_iHurtDB) [15]. The UCI_iHurtDB EDA signals for prediction. A feature selection algorithm is
is the first multimodal dataset collected from postoperative adult used to increase our tool's prediction accuracy and find the
patients suffering from real pain in hospitals. This dataset is top-most important features related to pain intensity. To evaluate
planned to be released for research purposes in the near future. our results, we used different types of machine learning
Skin conductance or the EDA signal is considered a useful algorithms. Machine learning techniques and neural networks
biomedical data point that corresponds to pain perception. Our have been widely used in health monitoring domains. Zargari
et al [22] used a combination of convolutional neural networks
https://mhealth.jmir.org/2021/5/e25258 JMIR Mhealth Uhealth 2021 | vol. 9 | iss. 5 | e25258 | p. 2
(page number not for citation purposes)
XSL• FO
RenderXJMIR MHEALTH AND UHEALTH Aqajari et al
and recurrent neural networks to accurately track the position selected if they satisfied the inclusion and exclusion criteria and
of in-mouth nutrient sensors. Mehrabadi et al [23] used determined to be enrolled in this study voluntarily. Verbal and
convolutional neural networks to detect COVID-19 in patients written consent was acquired before initiation of the study.
with acute respiratory distress syndrome. These techniques are
not limited only to health care domains. Ashrafiamiri et al [24]
Study Design
used deep neural networks to secure autonomous driving. To After the recruitment procedure, GSR data were collected for
accurately validate our pain assessment algorithm's performance, approximately 30 minutes continuously from the patients in
we compared our results with the accuracy achieved for the pain their private room. We separated these 30 minutes of data
models presented in [13]. Werner et al [13] used the BioVid monitoring into 2 phases. In the first phase, an artificial pain
Heat Pain database in their work in which participants were generator called a transcutaneous electrical nerve stimulation
subjected to painful heat stimuli under controlled settings. This (TENS) [25] unit was used to let participants have an initial
comparison aims to show that despite all the challenges in real impression of multiple pain levels and let researchers obtain
hospital settings, our models can achieve comparable results. baseline biosignals from the person. The TENS unit stimulates
This also shows the feasibility of using artificial different levels of acute pain by delivering small electrical
intelligence–based objective pain assessment for real patients. impulses through electrodes attached to the participant's skin
with adhesive pads. Participants were told to gradually increase
Methods the TENS unit's intensity to a tolerable level for them and then
hold it for at least 10 seconds. After this, we decreased the
All methods of the study, including the data collection and pain intensity back to level 0. In the second phase, participants
assessment, were approved by the University of California Irvine engaged in low-intensity activities such as walking, coughing,
Institutional Review Board (IRB, HS: 2017-3747). Potential sitting up, or lifting legs that caused an expected degree of pain.
candidates were screened for eligibility using the Acute Pain To improve data reliability for the following analysis, the entire
Service schedule and provided with a copy of the consent form data monitoring process was repeated sequentially. The
to review for at least 24 hours before participation in research monitored person's self-report of pain was measured using the
procedures. Numeric Rating Scale (NRS), a segmented numeric version of
the Visual Analogue Scale (VAS). The VAS is a validated,
Study Description, Participants, and Recruitment
subjective measure for acute and chronic pain. Pain scores are
This study is a biomedical data collection study with recorded by making a mark on a 10-cm line representing a
postoperative patients reporting varying degrees of pain sequence between “no pain” and “worst pain.” NRS quantifies
symptoms under local IRB approval supervision. We recruited the pain intensity to 10 levels (0 is no pain, and integers 1 to 10
25 participants (age: 23-89 years) from the University of represent different pain levels, with 10 being the highest pain
California, Irvine Medical Center. We recruited similar numbers imaginable) [26,27].
of men and women (13 men and 12 women). We removed 3
participants' data from the final dataset due to data recording Data Collection
accidents such as excessive motion artifacts induced by hand We used the Empatica E4, the commercially available wristband,
movements, and 2 participants’ data were excluded since they to monitor the EDA data. The wristband is simple to position,
were wearing the Empatica E4 watch on their IV arm, which and participants can maneuver easily without the device
resulted in unreliable EDA signal due to conditions such as skin impeding their movements in any way. The wristband's internal
rash and itching. The criteria for participant selection were as memory allows recording up to 36 hours of data and wireless
follows: (1) 18 years of age or older, (2) would receive a consult data transmission. The E4 wristband is rechargeable, with a
by the Acute Pain Service, (3) no barriers to communication, charging time of fewer than 2 hours. An EDA sensor is
(4) able to provide written informed consent, and (5) have intact embedded in the E4 wristband. This sensor measures the
and healthy facial skin. Participants were excluded if they had fluctuating changes in certain electrical properties of the skin.
any of the following: (1) any diagnosed condition affecting
cognitive function like dementia or psychosis; (2) any diagnosed GSR Feature Extraction Pipeline Architecture
condition affecting the central nervous system, facial nerves, Figure 1 shows our pipeline architecture for preparing the data
or muscles; (3) deformities on the hand or other parts of the and extracting the set of features for classification. There are 3
body that prevent sensor placement; and (4) significant facial different sections in this pipeline: (1) Data Preparation, (2)
hair growth in the area for sensor attachment. Patients were pyEDA [28], (3) Post Feature Extraction.
Figure 1. Galvanic skin response (GSR) feature extraction pipeline. EDA: electrodermal activity.
https://mhealth.jmir.org/2021/5/e25258 JMIR Mhealth Uhealth 2021 | vol. 9 | iss. 5 | e25258 | p. 3
(page number not for citation purposes)
XSL• FO
RenderXJMIR MHEALTH AND UHEALTH Aqajari et al
Data Preparation of GSR data and their labels are collected in this part to be fed
The primary purpose of the Data Preparation in our pipeline is to the pyEDA for pre-processing and feature extraction.
to synchronize the data with the labels. To prepare the data for pyEDA
feature extraction, we extracted the original signals’ slices that
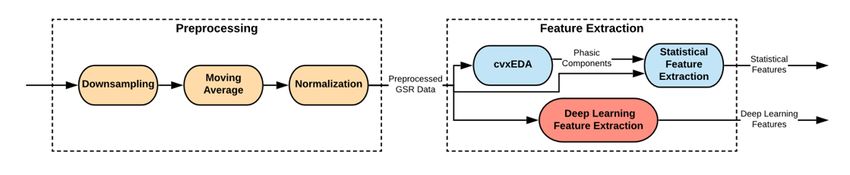
The architecture of the pyEDA is shown in Figure 2. According
match with their corresponding labels. With this aim, the slices
to this figure, Preprocessing and Feature Extraction are the 2
main stages in this pipeline.
Figure 2. Pipeline architecture of the pyEDA. EDA: electrodermal activity; GSR: galvanic skin response.
In the preprocessing stage of the pyEDA pipeline, at first, the important part in extracting the peaks of the GSR signal is to
data are down-sampled; then, a moving average is used to extract its phasic component. Based on Figure 2, the pyEDA
smooth the data and reduce the artifacts such as body gestures tool uses the cvxEDA algorithm [29] to extract the phasic
and movements. In the end, the data are normalized to become component. Then, the phasic component and the preprocessed
suitable for classification models. GSR data are fed to the Statistical Feature Extraction module
to extract the 3 mentioned features (number of peaks, mean
If the GSR data are collected at 128 Hz, it can safely be
GSR, and max peak amplitude).
down-sampled to a 20 Hz sampling rate. This down-sampling
has been done to conserve memory and processing time of the Post Feature Extraction
data. In this work, we did not down-sample the data since the We also extracted the features that were used in the work by
original data are already sampled at 4 Hz, which is good in Werner et al [13] for the GSR signals. The preprocessed GSR
terms of time and memory usage. signals and the set of features (number of peaks, mean GSR,
In this work, several steps were taken to remove motion artifacts and max peak amplitude) were fed into the Post Feature
from the GSR signal. First, we used a moving average across Extraction module to extract these features.
a 1-second window to remove the motion artifacts and smooth The maximum value of the peaks, range, standard deviation,
the data. Second, a low-pass Butterworth filter on the phasic interquartile range, root mean square, mean value of local
data was applied to remove the line noise. Lastly, preprocessed maxima, mean value of local minima, mean of the absolute
GSR signals corresponding to each different pain level were values of the first differences, and mean of the absolute values
visualized to ensure the validity of the signals. of the second differences are the extra features that were
The pyEDA uses 2 different algorithms for feature extraction extracted in this part. Table 1 shows all the extracted features
(Statistical Feature Extraction and Deep Learning Feature with their descriptions.
Extraction). The parameters of the Deep Learning Feature The mean of the absolute values of the first differences (mavfd)
Extraction part of the pipeline are set and tuned for stress is calculated as:
detection; therefore, in this work, we only used the features
extracted by the Statistical Feature Extraction algorithm.
The number of peaks, the mean, and the max peak amplitude
are the 3 different statistical features that are extracted in the The mean of the absolute values of the second differences
pyEDA. The GSR signals consist of 2 main components: skin (mavsd) is calculated as:
conductance level, also known as the tonic level of GSR, and
skin conductance response, also called the phasic component
of GSR. The GSR peaks or bursts are considered the variations
in the phasic component of the signal. Therefore, the most
https://mhealth.jmir.org/2021/5/e25258 JMIR Mhealth Uhealth 2021 | vol. 9 | iss. 5 | e25258 | p. 4
(page number not for citation purposes)
XSL• FO
RenderXJMIR MHEALTH AND UHEALTH Aqajari et al
Table 1. Extracted galvanic skin response (GSR) features with their descriptions.
Feature Description
Number of peaks The number of peaks
Mean The mean value of the signal
Max The maximum value of the peaks
Range The difference between the maximum and the minimum value of the signal
STD Standard deviation of the signal
IQR The difference between upper and lower quartiles of the signal
RMS Root mean square of the signal
Mean minima The mean value of local minima of the signal
Mean maxima The mean value of local maxima of the signal
mavfd The mean of the absolute values of the first differences
mavsd The mean of the absolute values of the second differences
Mean decrease impurity is also sometimes called Gini
Classification importance. Random forest is an ensemble learning algorithm
Feature Selection consisting of several decision trees. The decision tree is a
tree-like model of decisions in which every node is a condition
One of the key components in machine learning is to select the
on one of the features. These nodes separate the data into 2
set of features that has the highest importance in classification.
different sets so that in the optimal scenario, the data with the
Performing feature selection on the data reduces overfitting,
same labels end up in the same set. Impurity is the measure
reduces training time, and improves accuracy. By removing the
based on which the optimal condition is chosen on every node.
set of features that are not informative for our classification and
Mean decrease impurity for each feature is defined as the total
only add complexity to our model, there is less opportunity to
decrease in node impurity averaged over all ensemble trees.
make decisions based on noise, making the model less
The features are ranked according to this measure.
over-fitted. Fewer data means less training time. In the end, by
having more informative data and fewer misleading data, the Labeling the Features
accuracy of the model increases. Table 2 shows the distribution of labels in the UCI_iHurtDB.
Random forests [30] are among the most popular machine There exists 11 different pain levels in this dataset. It is
learning methods. They provide 2 methods for feature selection: noticeable that the distribution of different pain levels for the
mean decrease impurity and mean decrease accuracy. In this patients is imbalanced (4 occurrences of pain level 10, but 83
work, we used a mean decrease impurity method for feature occurrences of pain level 4, as an example). This is
selection. understandable due to the subjective nature and the different
sources of pain among our patients.
Table 2. Distribution of labels in the UCI_iHurtDB before down-sampling.
Pain level Frequency, n
PL0 37
PL1 52
PL2 37
PL3 61
PL4 83
PL5 44
PL6 32
PL7 16
PL8 46
PL9 26
PL10 4
In the work by Werner et al [13], there were 5 different pain pain assessment algorithm with their work, we down-sampled
levels, including the baseline level. To properly compare our our 11 classes to 5 classes. The key factor in this down-sampling
https://mhealth.jmir.org/2021/5/e25258 JMIR Mhealth Uhealth 2021 | vol. 9 | iss. 5 | e25258 | p. 5
(page number not for citation purposes)
XSL• FO
RenderXJMIR MHEALTH AND UHEALTH Aqajari et al
is to ensure that the distribution of the labels is as balanced as make sure (1) we were not reproducing any data and (2) the
possible. As a result, we considered pain levels 1-3 as new pain patients had the same pain level 0 for these new timestamps.
level 1 (PL1), pain level 4 as new pain level 2 (PL2), pain levels By doing this procedure for all the participants, our number of
5-7 as new pain level 3 (PL3), and pain levels 8-10 as new pain samples for pain level 0 increased from 37 to 86.
level 4 (PL4). Based on Table 2, there are only 37 data points
Table 3 shows the distribution of the down-sampled labels and
for the baseline. To increase the number of samples for the
the new baseline. The distribution of the new labels is
baseline to make our labels more balanced, we up-sampled PL0
appropriately balanced. Still, for PL1, the number of samples
based on the reported PL0 data by the patients. We ensured
is slightly higher than the rest of the classes. This is because we
these new baseline data were close enough to the reported pain
down-sampled our pain levels to 4 different classes to make our
level 0 labels (less than 10 seconds difference) and had no
settings comparable with the work by Werner et al [13].
overlap with other labels. These assumptions were made to
Table 3. Distribution of labels in the UCI_iHurtDB after down-sampling.
Pain level Frequency, n
PL0 86
PL1 150
PL2 83
PL3 92
PL4 76
pain model from scratch without considering the current test
Machine Learning Algorithms patient data or any information from the previous pain models.
We used machine learning–based algorithms to evaluate the The final accuracy of the model was obtained by averaging the
performance of our pain assessment algorithm. Two different accuracy of all constructed pain models.
classification methods were used here: (1) k-nearest-neighbor
with k between 1 and 20 and (2) random forest with a depth Results
between 1 and 10. The k-nearest-neighbor method uses k number
of nearest data points and predicts the result based on a majority A total of 25 patients with acute pain were engaged by the Acute
vote [31]. The random forest classifier is an ensemble learning Pain Service and recruited for this study. Of these 25
algorithm that fits several decision tree classifiers on various participants, 5 were removed from our study due to problems
subsamples of the dataset and uses averaging to improve the in the data collection process due to rapid hand movements or
predictive accuracy and control over-fitting [30]. We used the unreliable EDA signal due to conditions such as skin rash and
Scikit-learn library to create our classification models [32]. itching resulting from wearing the Empatica E4 watch on their
Scikit-learn is a free software machine learning library for the IV arm. The average age of patients in this study was 54.45 (SD
Python programming language. It features various classification, 17.44, range 23-89) years; 55% (11/20) of the patients were
regression, and clustering algorithms, including male, and 45% (9/20) of patients were female. All patients were
k-nearest-neighbor and random forest. taking the standard-of-care postoperative pain medications at
the time of the study. Enrolled participants agreed to perform
To accurately evaluate the performance of our classification
the research protocol for a median of 4 (IQR 3-6) days after
models, we used a cross-validation method [33].
surgical intervention. The nature of the procedures for each
Cross-validation is one of the most popular algorithms used to
participant included the following domains: 45% (9/20) general
truly estimate a machine learning model's accuracy on unseen
surgery (diagnostic laparoscopy, exploratory laparotomy, and
data. It achieves this by training a model using different subsets
vascular), 15% (3/20) trauma (thoracic pain and rib plating),
of data and obtaining the average accuracy on the rest of the
and 10% (2/20) urology (cystectomy and bladder augmentation).
data as a test. In this work, we used leave-one-out
Also, 40% (8/20) of enrolled participants received
cross-validation to evaluate our result. We considered all the
standard-of-care epidural analgesia provided by the acute pain
data acquired from one of the patients as a test and created our
service team at the time of research participation. The remaining
pain model using the rest of the patients. We repeated this
participants were receiving oral and intravenous analgesics for
procedure for each patient as a test. Each time, we created our
pain control (Table 4).
https://mhealth.jmir.org/2021/5/e25258 JMIR Mhealth Uhealth 2021 | vol. 9 | iss. 5 | e25258 | p. 6
(page number not for citation purposes)
XSL• FO
RenderXJMIR MHEALTH AND UHEALTH Aqajari et al
Table 4. Summary of patients’ demographic characteristics for this study including exclusions.
Variable Value Range
Patients excluded for hand movement noise, n (%) 3 (12) N/Aa
Patients excluded for IV arm effect, n (%) 2 (8) N/A
Age (years), mean (SD) 54.45 (17.44) 23-89
Gender, male, n (%) 11 (55) N/A
Weight (kg), mean (SD) 75.24 (14.60) 52.2-102
Height (cm), mean (SD) 170.07 (9.00) 154.9-185.9
BMI (kg/m2), mean (SD) 26.21 (5.75) 15.1-38.6
Nature of the procedure, n (%)
General surgery 9 (45) N/A
Orthopedics 6 (30) N/A
Trauma 3 (15) N/A
Urology 2 (10) N/A
a
N/A: not applicable.
To show that our pain assessment algorithm can achieve selection. The maximum value of the peaks, range, standard
comparable results to the work by Werner et al [13], we used deviation, interquartile range, root mean square, mean value of
identical settings as their work. Werner et al [13] used 5 different local maxima, mean value of local minima, mean of the absolute
pain levels, including the baseline. They also considered values of the first differences, and mean of the absolute values
5.5-second windows for the GSR data. Therefore, in the Data of the second differences are the features that were used here.
Preparation part of our pipeline, we considered 5.5-second
We used leave-one-person-out cross-validation using
windows for the slices of the GSR data for feature extraction
k-nearest-neighbor and random forest algorithms. We reported
(2.75 seconds before and after each timestamp). Furthermore,
the accuracy based on 4 different pain models (BL vs PL1, BL
as discussed in the Methods section, we down-sampled the pain
vs PL2, BL vs PL3, and BL vs PL4). Table 5 shows the
levels from 11 classes to 5 classes to make them similar with
comparison of the validation accuracy achieved by our
their labels.
classifiers with that by the pain models of Werner et al [13].
At first, we used the set of features that was used in the work
by Werner et al [13] for classification without any feature
Table 5. The validation accuracies in comparison with Werner et al [13] using the same set of features.
Binary classification RFa KNNb Werner et al [13]
BL vs PL1 84.0 74.4 55.4
BL vs PL2 66.3 67.5 60.2
BL vs PL3 57.2 65.0 65.9
BL vs PL4 55.2 53.0 73.8
a
RF: random forest.
b
KNN: k-nearest-neighbor.
According to these data, for the first 2 pain models (BL vs PL1 To obtain the best set of classification features, we ran
and BL vs PL2), we achieved a higher accuracy using both of leave-one-person-out cross-validation on different pain models
our classifiers in comparison with Werner et al [13]. For the using random forest classifiers. We computed the Gini
third pain model, our accuracy is also close to their models, importance of the features on the training data and selected the
with less than 1% difference using the k-nearest-neighbor top k number of features for training the model and classification
classifier. For the fourth model, the accuracy of our models was (2-11 were considered to be possible values for k). Since we
noticeably lower than their models. As the next step, we added had a different number of folds, we could have different sets of
2 more features (the number of peaks and the mean of the GSR features for each fold. We considered the set of features that
data) to our set of features and then selected the most important was used in most of the folds as the final set of features for the
ones using the mean decrease impurity method to improve the current pain model. Table 6 shows the selected features for each
accuracy. pain model. Descriptions for each of these features can be found
in Table 1.
https://mhealth.jmir.org/2021/5/e25258 JMIR Mhealth Uhealth 2021 | vol. 9 | iss. 5 | e25258 | p. 7
(page number not for citation purposes)
XSL• FO
RenderXJMIR MHEALTH AND UHEALTH Aqajari et al
Table 6. Selected set of features for each pain model.
Pain models Set of features
BL vs PL1 Mean, max, RMSa, and mean maxima
BL vs PL2 Mean, max, RMS, and mean maxima
BL vs PL3 Max and RMS
BL vs PL4 Mean, max, IQR, RMS, and mean maxima
a
RMS: root mean square.
According to this table, the maximum value and root mean and random forest algorithms using these sets of new selected
square of the signal are 2 features that were selected in all the features to achieve the final results.
pain models. The mean value of the local maxima and the mean
Table 7 shows the validation accuracy comparison of our models
value of the signal were also selected for all the pain models
with those by Werner et al [13] using feature selection for
except the third one. The difference between upper and lower
5.5-second windows. As shown in this table, by using feature
quartiles of the signal (IQR) is a feature that was selected as an
selection, our classifiers' accuracy improved compared to those
important feature for classification only for the BL vs PL4 pain
shown in Table 5. For all the pain models except the fourth one,
model.
we were able to achieve higher accuracy than the pain models
After the set of features for each pain model were obtained, we by Werner et al [13]. For BL vs PL4, our accuracy was still
ran one-person-leave-out cross-validation for k-nearest neighbor about 10% less than their work. In the Discussion section, we
explain the potential reasons for this difference in our model.
Table 7. Validation accuracies in comparison with the work by Werner et al [13] using feature selection.
Binary classification RFa KNNb Werner et al [13]
BL vs PL1 86.0 76.8 55.4
BL vs PL2 70.0 69.1 60.2
BL vs PL3 69.8 72.1 65.9
BL vs PL4 61.5 60.0 73.8
a
RF: random forest.
b
KNN: k-nearest-neighbor.
selection, we are using a much lower number of features in our
Discussion pain models. This reduces the complexity of our pain models.
Strengths Furthermore, we present the most important features for each
We are the first to develop an automatic and versatile pain classification model. According to Table 5, the maximum value
assessment tool using GSR signals to accurately predict different and root mean square of the signal appear to be the 2 most
pain intensities in postoperative adult patients. According to important features for pain classifications for postoperative
our results, using identical settings and even the exact GSR adult patients. The mean value and mean value of the local
features used in the work by Werner et al [13], we can achieve maxima of the signal are considered to be the next 2 important
higher accuracy in 2 of the 4 different pain models (BL vs PL1 features for classification.
and BL vs PL2). Also, for the third pain model (BL vs PL3), Our results show that, in addition to healthy participants from
using the k-nearest-neighbor classifier, we can achieve the same previous studies, we can detect different intensities of pain using
level of accuracy with less than 1% difference. Machine learning only GSR data in real-life patients in the hospital. GSR data
algorithms and feature selection are not a part of the pain can easily be collected using affordable wearable devices such
assessment algorithm settings. As a result, to show the true as the Empatica E4 used in our study. Therefore, our pain
strength of our pain assessment algorithm, first, we added 2 assessment algorithm is really beneficial in providing valuable
more features to our set of features (the number of peaks and information to hospital staff and caregivers to better manage
the mean value of the signal). Then, we used the mean decrease pain, especially for those patients who cannot communicate.
impurity method to select the most important features for
classification. According to Table 7, we can achieve higher Limitations
accuracy for the first 3 pain models using this procedure. Based As our work's limitations, we used data collected from
on our results, for the first pain model (BL vs PL1), our accuracy postoperative adult participants in our pain assessment
is considerably higher than the accuracy achieved by Werner algorithm. Data collection in real life may have led to more
et al [13] (with and without feature selection). By feature motion artifact noise in our physiological signals than data
collection in a lab setting (especially for GSR data collected
https://mhealth.jmir.org/2021/5/e25258 JMIR Mhealth Uhealth 2021 | vol. 9 | iss. 5 | e25258 | p. 8
(page number not for citation purposes)
XSL• FO
RenderXJMIR MHEALTH AND UHEALTH Aqajari et al
from Empatica E4 connected to their wrist). The motion artifacts According to our results, the accuracy of our pain models
were stronger for higher pain levels since the patient was in generally decreases with increasing pain levels. This is the
more unbearable pain. opposite of the models from Werner et al [13]. We believe this
is due to our work's limitations mentioned in the earlier
Another limitation in our work can be the lack of balanced pain
paragraph (motion artifact in signals and lack of balanced pain
levels for all the patients. Since our data were collected from
levels for all the patients). Both of these mentioned limitations
real postoperative adult participants, it is possible that the
could be more noticeable at higher pain levels. Therefore, it is
patients in the experiment did not experience and report all
understandable that in this work, where the data were collected
different pain levels. This limitation could be more noticeable
from postoperative patients in real life, our models' accuracy
at higher pain levels.
decreased with increasing pain levels.
Based on our results, we were not able to achieve the accuracy
of that by Werner et al [13] for BL vs PL4 (with a 10%
Conclusions
difference). The limitations mentioned in previous paragraphs In conclusion, according to our results, we can evaluate the
can explain the potential reasons behind this difference. performance of our pain assessment algorithm. This evaluation
shows that it is feasible to predict different pain levels in real
Furthermore, we could not find a significant difference between postoperative adult participants using only the EDA data.
different pain levels in our study. We believe this is because Furthermore, we showed that the mean value, maximum value,
the variations in GSR signal response to different pain levels root mean square, and mean value of the local maxima of the
are more alike to be distinguished easily. It is worth mentioning signal are the most important features for pain classification of
that most state-of-the-art pain assessments mainly focus on real patients in pain. Multimodel pain assessment methods can
comparing baseline with other pain levels (eg, Werner et al [13], be implemented as future work to increase our pain assessment
if the patient is in pain or not). models' performance.
Acknowledgments
This research was supported by the Academy of Finland project, Personalized Pain Assessment System based on IoT 313488.
Conflicts of Interest
None declared.
References
1. Serpell M. Handbook of pain management. New York, NY: Springer Healthcare; 2008.
2. Tompkins DA, Hobelmann JG, Compton P. Providing chronic pain management in the "Fifth Vital Sign" Era: Historical
and treatment perspectives on a modern-day medical dilemma. Drug Alcohol Depend 2017 Apr 01;173 Suppl 1:S11-S21
[FREE Full text] [doi: 10.1016/j.drugalcdep.2016.12.002] [Medline: 28363315]
3. McGreevy K, Bottros M, Raja S. Preventing Chronic Pain following Acute Pain: Risk Factors, Preventive Strategies, and
their Efficacy. Eur J Pain Suppl 2011 Nov 11;5(2):365-372 [FREE Full text] [doi: 10.1016/j.eujps.2011.08.013] [Medline:
22102847]
4. Gregory J, McGowan L. An examination of the prevalence of acute pain for hospitalised adult patients: a systematic review.
J Clin Nurs 2016 Mar;25(5-6):583-598. [doi: 10.1111/jocn.13094] [Medline: 26778249]
5. McQuay H, Moore A, Justins D. Treating acute pain in hospital. BMJ 1997 May 24;314(7093):1531-1535 [FREE Full text]
[doi: 10.1136/bmj.314.7093.1531] [Medline: 9183203]
6. Stites M. Observational pain scales in critically ill adults. Crit Care Nurse 2013 Jun;33(3):68-78. [doi: 10.4037/ccn2013804]
[Medline: 23727853]
7. Barr J, Fraser GL, Puntillo K, Ely EW, Gélinas C, Dasta JF, American College of Critical Care Medicine. Clinical practice
guidelines for the management of pain, agitation, and delirium in adult patients in the intensive care unit. Crit Care Med
2013 Jan;41(1):263-306. [doi: 10.1097/CCM.0b013e3182783b72] [Medline: 23269131]
8. Naeini EK, Shahhosseini S, Subramanian A, Yin T, Rahmani A, Dutt N. An Edge-Assisted and Smart System for Real-Time
Pain Monitoring. 2019 Presented at: 2019 IEEE/ACM International Conference on Connected Health: Applications, Systems
and Engineering Technologies (CHASE); September 25-27, 2019; Arlington, VA. [doi: 10.1109/chase48038.2019.00023]
9. Asgari Mehrabadi M, Azimi I, Sarhaddi F, Axelin A, Niela-Vilén H, Myllyntausta S, et al. Sleep Tracking of a Commercially
Available Smart Ring and Smartwatch Against Medical-Grade Actigraphy in Everyday Settings: Instrument Validation
Study. JMIR Mhealth Uhealth 2020 Nov 02;8(10):e20465 [FREE Full text] [doi: 10.2196/20465] [Medline: 33038869]
10. Werner P, Al-Hamadi A, Niese R, Walter S, Gruss S, Traue H. Towards Pain Monitoring: Facial Expression, Head Pose,
a new Database, an Automatic System and Remaining Challenges. 2014 Presented at: British Machine Vision Conference
2013; September 9-13, 2013; Bristol, England. [doi: 10.5244/c.27.119]
11. Walter S, Gruss S, Ehleiter H, Tan J, Traue H, Crawcour S, et al. The biovid heat pain database: Data for the advancement
and systematic validation of an automated pain recognition. 2013 Presented at: 2013 IEEE International Conference on
Cybernetics (CYBCO); June 13-15, 2013; Lausanne, Switzerland. [doi: 10.1109/cybconf.2013.6617456]
https://mhealth.jmir.org/2021/5/e25258 JMIR Mhealth Uhealth 2021 | vol. 9 | iss. 5 | e25258 | p. 9
(page number not for citation purposes)
XSL• FO
RenderXJMIR MHEALTH AND UHEALTH Aqajari et al
12. Hammal Z, Cohn JF. Automatic detection of pain intensity. 2012 Presented at: 14th ACM international conference on
Multimodal interaction; October 2012; Santa Monica, CA. [doi: 10.1145/2388676.2388688]
13. Werner P, Al-Hamadi A, Niese R, Walter S, Gruss S, Traue HC. Automatic pain recognition from video and biomedical
signals. 2014 Presented at: 22nd International Conference on Pattern Recognition; August 24-28, 2014; Stockholm, Sweden.
[doi: 10.1109/icpr.2014.784]
14. Herr K, Coyne PJ, McCaffery M, Manworren R, Merkel S. Pain assessment in the patient unable to self-report: position
statement with clinical practice recommendations. Pain Manag Nurs 2011 Dec;12(4):230-250. [doi:
10.1016/j.pmn.2011.10.002] [Medline: 22117755]
15. Kasaeyan Naeini E, Jiang M, Syrjälä E, Calderon M, Mieronkoski R, Zheng K, et al. Prospective Study Evaluating a Pain
Assessment Tool in a Postoperative Environment: Protocol for Algorithm Testing and Enhancement. JMIR Res Protoc
2020 Jul 01;9(7):e17783 [FREE Full text] [doi: 10.2196/17783] [Medline: 32609091]
16. Galvanic Skin Response - The Complete Pocket Guide. IMotions. 2017. URL: https://imotions.com/guides/eda-gsr/ [accessed
2021-04-11]
17. Rostami A, Pandey V, Nag N, Wang V, Jain R. Personal Food Model. USA: Association for Computing Machinery; 2020
Presented at: 28th ACM International Conference on Multimedia; October 2020; Seattle, WA. [doi:
10.1145/3394171.3414691]
18. Eriksson M, Storm H, Fremming A, Schollin J. Skin conductance compared to a combined behavioural and physiological
pain measure in newborn infants. Acta Paediatr 2008 Jan;97(1):27-30. [doi: 10.1111/j.1651-2227.2007.00586.x] [Medline:
18052991]
19. Munsters J, Wallström L, Agren J, Norsted T, Sindelar R. Skin conductance measurements as pain assessment in newborn
infants born at 22-27 weeks gestational age at different postnatal age. Early Hum Dev 2012 Jan;88(1):21-26 [FREE Full
text] [doi: 10.1016/j.earlhumdev.2011.06.010] [Medline: 21764228]
20. Shankar K, Manivannan M, Fernandez P. GSR analysis of hypnotic analgesia. International Journal of Systemics, Cybernetics
and Informatics 2008:35-38. [doi: 10.1016/b978-012370880-9.00212-7]
21. Susam B, Akcakaya M, Nezamfar H, Diaz D, Xu X, de Sa VR, et al. Automated Pain Assessment using Electrodermal
Activity Data and Machine Learning. Annu Int Conf IEEE Eng Med Biol Soc 2018 Jul;2018:372-375 [FREE Full text]
[doi: 10.1109/EMBC.2018.8512389] [Medline: 30440413]
22. Zargari AHA, Dautta M, Ashrafiamiri M, Seo M, Tseng P, Kurdahi F. NEWERTRACK: ML-Based Accurate Tracking of
In-Mouth Nutrient Sensors Position Using Spectrum-Wide Information. IEEE Trans. Comput.-Aided Des. Integr. Circuits
Syst 2020 Nov;39(11):3833-3841. [doi: 10.1109/tcad.2020.3013074]
23. Mehrabadi MA, Aqajari SAH, Azimi I, Downs CA, Dutt N, Rahmani AM. Detection of COVID-19 Using Heart Rate and
Blood Pressure: Lessons Learned from Patients with ARDS. arXiv Prepr arXiv201110470 2020 2020:1-7 [FREE Full text]
24. Ashrafiamiri M, Pudukotai DS, Afandizadeh ZA, Seo M, Kurdahi F, Homayoun H. R2AD: Randomization and
reconstructor-based adversarial defense for deep neural networks. 2020 Presented at: MLCAD 2020: 2020 ACM/IEEE
Workshop on Machine Learning for CAD; November 2020; Virtual. [doi: 10.1145/3380446.3430628]
25. HealthmateForever Therapeutic Solutions. URL: https://www.healthmateforever.com/products/
fda-cleared-otc-pain-relief-yk15ab-tens-units [accessed 2021-04-11]
26. Thong ISK, Jensen MP, Miró J, Tan G. The validity of pain intensity measures: what do the NRS, VAS, VRS, and FPS-R
measure? Scand J Pain 2018 Jan 26;18(1):99-107. [doi: 10.1515/sjpain-2018-0012] [Medline: 29794282]
27. Johnson C. Measuring Pain. Visual Analog Scale Versus Numeric Pain Scale: What is the Difference? Journal of Chiropractic
Medicine 2005 Dec;4(1):43-44. [doi: 10.1016/s0899-3467(07)60112-8]
28. Aqajari S, Naeini E, Mehrabadi M, Labbaf S, Rahmani A, Dutt N. GSR Analysis for Stress: Development and Validation
of an Open Source Tool for Noisy Naturalistic GSR Data. arXiv:2005.01834 2020:1 [FREE Full text]
29. Greco A, Valenza G, Lanata A, Scilingo E, Citi L. cvxEDA: a Convex Optimization Approach to Electrodermal Activity
Processing. IEEE Trans. Biomed. Eng 2016:1-1. [doi: 10.1109/tbme.2015.2474131]
30. Breiman L. Random forests. Machine Learning 2001;45:5-32. [doi: 10.1023/A:1010933404324]
31. Altman NS. An Introduction to Kernel and Nearest-Neighbor Nonparametric Regression. The American Statistician 1992
Aug;46(3):175. [doi: 10.2307/2685209]
32. Pedregosa F, Varoquaux G, Gramfort A, Michel V, Thirion B, Grisel O, et al. Scikit-learn: Machine learning in Python.
Journal of Machine Learning Research 2011;12:2825-2830 [FREE Full text]
33. Kohavi R. A Study of Cross-Validation and Bootstrap for Accuracy Estimation and Model Selection. 1995 Presented at:
14th International Joint Conference on Artificial Intelligence; August 1995; San Francisco, CA.
Abbreviations
EDA: electrodermal activity
GSR: galvanic skin response
IoT: Internet of Things
IRB: institutional review board
https://mhealth.jmir.org/2021/5/e25258 JMIR Mhealth Uhealth 2021 | vol. 9 | iss. 5 | e25258 | p. 10
(page number not for citation purposes)
XSL• FO
RenderXJMIR MHEALTH AND UHEALTH Aqajari et al
NRS: Numeric Rating Scale
TENS: transcutaneous electrical nerve stimulation
VAS: Visual Analogue Scale
Edited by L Buis; submitted 25.10.20; peer-reviewed by A Aminifar, I Shubina, N Taneja, D Firl; comments to author 23.11.20; revised
version received 18.01.21; accepted 25.03.21; published 05.05.21
Please cite as:
Aqajari SAH, Cao R, Kasaeyan Naeini E, Calderon MD, Zheng K, Dutt N, Liljeberg P, Salanterä S, Nelson AM, Rahmani AM
Pain Assessment Tool With Electrodermal Activity for Postoperative Patients: Method Validation Study
JMIR Mhealth Uhealth 2021;9(5):e25258
URL: https://mhealth.jmir.org/2021/5/e25258
doi: 10.2196/25258
PMID:
©Seyed Amir Hossein Aqajari, Rui Cao, Emad Kasaeyan Naeini, Michael-David Calderon, Kai Zheng, Nikil Dutt, Pasi Liljeberg,
Sanna Salanterä, Ariana M Nelson, Amir M Rahmani. Originally published in JMIR mHealth and uHealth (https://mhealth.jmir.org),
05.05.2021. This is an open-access article distributed under the terms of the Creative Commons Attribution License
(https://creativecommons.org/licenses/by/4.0/), which permits unrestricted use, distribution, and reproduction in any medium,
provided the original work, first published in JMIR mHealth and uHealth, is properly cited. The complete bibliographic information,
a link to the original publication on https://mhealth.jmir.org/, as well as this copyright and license information must be included.
https://mhealth.jmir.org/2021/5/e25258 JMIR Mhealth Uhealth 2021 | vol. 9 | iss. 5 | e25258 | p. 11
(page number not for citation purposes)
XSL• FO
RenderXYou can also read