Monitoring vertebrate abundance in Austria: developments over 30 years - Sciendo
←
→
Page content transcription
If your browser does not render page correctly, please read the page content below
Die Bodenkultur: Journal of Land Management, Food and Environment
Volume 71, Issue 1, 19–30, 2020. 10.2478/boku-2020-0003
ISSN: 0006-5471 online, https://content.sciendo.com/view/journals/boku/boku-overview.xml

Research Article

   Monitoring vertebrate abundance in Austria: developments
                         over 30 years

                   Die Entwicklung von Wirbeltierpopulationen in Österreich
                                   in den letzten 30 Jahren

                                           Katharina Semmelmayer, Klaus Hackländer*

Institute for Wildlife Biology and Game Management, Department of Integrative Biology and Biodiversity Research, University of Natural
Resources and Life Sciences Vienna (BOKU), Gregor-Mendel-Straße 33, 1180 Vienna, Austria
* Corresponding author: klaus.hacklaender@boku.ac.at
Received: 30 July 2019, received in revised form: 10 February 2020, accepted: 12 January 2020

                                                                Summary
Loss of biodiversity is one of the major challenges of the anthropocene. Various indices are used to quantify biodiversity. For ver-
tebrates, the World Wide Fund for Nature (WWF) uses the Living Planet Index (LPI). It is calculated globally as well as separately
for the species occurring in terrestrial, freshwater, and marine biomes. Action to prevent biodiversity loss can be taken by countries
or provinces, so it is important to understand the changes in biodiversity at local scales. We present LPIs for vertebrates in Austria,
both unweighted and weighted, according to species richness. Vertebrate populations seem to have declined strongly in Austria, and
their abundance was stabilized at about 60% of the initial population size in the base year 1990—the LPI declined from 1 in 1990
to ~0.6 (unweighted) or ~0.7 (weighted) in 2015. This is almost double the global decline for the same period. LPIs were calculated
separately for the terrestrial biome (~0.6), the freshwater biome (~0.9), birds (~0.7), and native species (~0.6). These indices give
evidence that conservation measure to halt biodiversity loss in Austria is necessary and show where more data are needed. In Austria,
more research is needed especially on populations of reptile species.
Keywords: autochthonous, Living Planet Index, biodiversity loss, biodiversity goals, vertebrate diversity

                                                          Zusammenfassung
Der Verlust an Biodiversität stellt eine der größten Herausforderungen des Anthropozäns dar. Um Biodiversität zu quantifizieren, wer-
den verschiedene Indizes herangezogen. Für Wirbeltiere hat der World Wide Fund for Nature (WWF) den Living Planet Index (LPI)
entwickelt. Er gibt die globale Entwicklung der Populationsgröße verschiedener Arten wieder und kann getrennt für die Biome Land,
Süßwasser und Meer berechnet werden. Maßnahmen zur Vermeidung von weiterem Verlust an Biodiversität müssen auf Landesebene
gesetzt werden. Daher ist es wichtig, über den lokalen Zustand der Biodiversität informiert zu sein. In der vorliegenden Studie wurde
daher ein LPI für Wirbeltiere in Österreich entwickelt. Dieser enthält je nach Artendiversität sowohl ungewichtete als auch gewichtete
Werte. Die Wirbeltierpopulationen gingen in Österreich stark zurück und haben sich, bezogen auf den Ausgangswert aus dem Jahr
1990, auf einem Niveau von 60 % eingependelt – der LPI Österreich ging von 1 in 1990 auf ~0,6 (ungewichtet) bzw. ~0.7 (gewich-
tet) im Jahr 2015 zurück. Damit ist der Rückgang beinahe doppelt so hoch wie der globale Rückgang im selben Zeitraum. LPI-Werte
wurden separat für das Biom Land (~0.6), für Süßwasserlebensräume (~0.9), aber auch für Vögel (~0.7) und autochthone Arten (~0.6)
berechnet. Diese Ergebnisse der Studie bieten die Grundlage für Maßnahmen zum Schutz der Biodiversität und zeigen auch, welche
Datenlücken vorhanden sind. So fehlen vor allen Dingen Informationen zu Reptilien.
Schlagworte: autochthon, Living Planet Index, Biodiversitätsverlust, Biodiversitätsstrategie, Wirbeltierdiversität

  Open Access. © 2020Katharina Semmelmayer, Klaus Hackländer, published by Sciendo.           This work is licensed under the Creative
Commons Attribution-NonCommercial-NoDerivatives 3.0 License. https://doi.org/10.2478/boku-2020-0003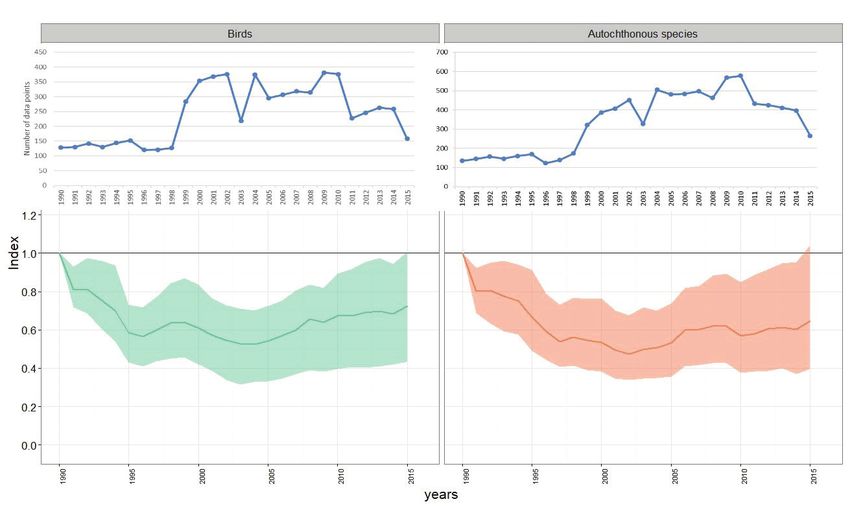
20                                                 Katharina Semmelmayer, Klaus Hackländer

1. Introduction                                                            One index of biodiversity, the Living Planet Index (LPI), is
                                                                           designed to compare the diversity of vertebrate species on
Humans have increasing impacts on fauna and flora                          a global scale or within smaller regions between different
(Overmars et al., 2014) and are responsible for causing                    years, in relation to a base year. The basic building blocks
the highest biological extinction rate in the history of the               of the index are population time series of vertebrate spe-
Earth (Balmford et al., 2003). In this context, the aim of                 cies, which require measurement of the population size of
the Convention on Biological Diversity (CBD) of 1993,                      each vertebrate species within a certain area for as many
signed by 168 countries including Austria, and ratified                    years as possible (Legg and Nagy, 2006).
since by 196 countries and unions (https://www.cbd.int/                    The LPI was first published in 1998 in the Living Planet
convention/, 08.02.2018), is to protect biological diver-                  Report of the World Wildlife Fund for Nature (WWF; Loh
sity (Secretariat of the Convention on Biological Diversity,               et al., 2005) and has been published periodically ever since
2005). One major goal of the convention was to reduce                      (http://www. livingplanetindex.org/home/index, 08.02.2018).
the loss of biodiversity significantly by 2010 (Secretariat of             A database of vertebrate population time series was set up
the Convention on Biological Diversity, 2005). The goal                    at a global scale and has been developed further as the basis
of the European Union was even more ambitious: to stop                     for the index. The calculation procedure has been revised
the loss of biodiversity by 2010 (EU European Council,                     several times to meet modern standards and to incorporate
2001). Neither goal was reached (Butchart et al., 2010),                   new analysis methods for big data sets (Loh et al., 2005;
so the deadlines were extended to 2020 (Conference of the                  Collen et al., 2008; McRae et al., 2017). However, the basic
Parties, 2010).                                                            structure of the index has not changed (Loh et al., 2005).
To assess whether or not the goals of the CBD are being                    As the calculation is performed in a stepwise manner, it is
reached, indices have been defined to measure biodiversity                 possible to disaggregate the global LPI into indices for the
and quantify changes in space and over time (Ten Brink,                    three biomes, for a climate region, or for a species (Figure 1).
2005). Quantifying global changes in biodiversity enables                  Although the database used for the calculation is one of the
us to understand more clearly threats to species and eco-                  largest on vertebrate species worldwide (WWF, 2016), it is
systems (McRae et al., 2017). Indices are suitable for this                not possible to generate an index for each country because
because they enable us to gain information; they are also                  of insufficient data (McRae et al., 2008).
a means of communication between scientists and politi-                    We aimed to generate enough data to calculate an LPI for
cians (Ten Brink, 2005).                                                   Austria (a mountainous land-locked country in Central

Figure 1. The structure of the Global Living Planet Index (LPI). The parts that are relevant for Austria, a land-locked country, are dark. Modified
from Loh et al. (2005).
Abbildung 1. Aufbau des Globalen Living Planet Index (LPI) mit Markierung der relevanten Schritte für den österreichischen LPI (dunkel). Qu-
elle: Loh et al., 2005, eigene Bearbeitung.

Die Bodenkultur: Journal of Land Management, Food and Environment                                                                     71 (1) 2020

Monitoring vertebrate abundance in Austria: developments over 30 years 21

Europe, with an area of ca. 84,000 km2) and also for each           2008). Fishing catch data, hunting bags, and other non-
of its nine provinces. This is a new approach for the coun-         scientific data are not used (Loh et al., 2005). Data from
try, as the conservation status of Austrian fauna has previ-        scientific research as well as from the gray literature are
ously been and still is described by using Red Lists (Gepp,         included (Collen et al., 2008).
1984). There are many projects and monitoring activities            Data were obtained from the Environment Agency Aus-
on species in Austria, especially to fulfill the documen-           tria, the Austrian Federal Ministry for Sustainability and
tation requirements of the European Council Directive               Tourism, Austrian State Forest, non-governmental organi-
2009/147/EC on the conservation of wild birds (Birds                zations, management units of protected areas, scientists,
Directive) and the European Council Directive 92/43/                and associations working in the field of nature protection.
EEC on the Conservation of natural habitats and of wild             In addition, the database zobodat.at, which focuses on sci-
fauna and flora (Habitats Directive) and also within other          entific literature on Austrian fauna and flora, was searched.
projects that are financed or co-financed by the European           To enable us to check the reliability of the data, sources
Union, such as Life- and Life+-projects. Furthermore,               and information on the study design and area (Collen et
monitoring has been performed in protected areas and                al., 2008) were gathered in a database (Microsoft Access
on species causing conflicts, such as the Eurasian beaver           2010). Furthermore, the information on the habitat used
(Castor fiber; e.g., Habenicht, 2014) and the Eurasian otter        by each species was gathered to enable the generation of
(Lutra lutra; e.g., Sittentaler et al., 2016). The data from        disaggregated indices (Collen et al., 2008).
all these projects have never been combined to gain insight
into the conservation status of vertebrate species in Aus-
                                                                    2.2. Statistical analysis
tria. Only certain classes or groups of species have been
analyzed by certain organizations, for example, by BirdLife         Data availability for each year and province were analyzed
Austria, an organization concentrating on birds and their           descriptively (Microsoft Excel 2010). For further statistical
protection, and by “Koordinationsstelle für Fledermauss-            analysis, the package rlpi (Freeman et al., NA) in the statisti-
chutz”, a non-governmental organization concentrating               cal program R version 3.3.1 (R Core Team, 2016) was used.
on bats. The aim of this study was to aggregate data from           For the global LPI, time series including 6 or more years of
different projects and organizations to calculate an LPI for        data are processed using generalized additive models (GAMs;
the stages of disaggregation relevant for Austria (Figure 1,        Collen et al., 2008), whereas those including fewer years are
dark boxes). Reaching this goal would allow to make use of          processed using a chain method (Loh et al., 2005). The chain
the index in several ways:                                          method is used to compare numbers of species over a time
1. To gain an insight into the conservation status of Aus-          period with missing values for some years (Ter Braak et al.,
     trian vertebrate populations.                                  1994). In order to calculate an index by this method, pairs
2. To show where ongoing monitoring and new moni-                   of successive years are first used to estimate the logarithm of
     toring projects are needed.                                    the ratio from one year to the preceding (Loh et al., 2005). If
3. To form a baseline for fulfilling reporting duties to the        there are several time series for the same species in one year,
     European Union or within the frame of the CBD.                 the mean is calculated first. Those values are then chained to
                                                                    the base year, resulting in the yearly index values (Ter Braak
                                                                    et al., 1994). GAMs were used for time series with a num-
2. Material and Methods                                             ber of observation years of >5. They are more flexible than
                                                                    the chain method, as the mean abundance may follow any
2.1. Data requirements and collection                               smooth curve, even a non-linear one. This is the advantage
                                                                    over the chain method (Collen et al., 2008). However, longer
To calculate an LPI, only population time series that are           time series are needed to generate reliable results. In the cal-
available for several (at least two) years for a vertebrate spe-    culation method, the geometrical mean is used to calculate
cies are included only if the data were collected using the         indices for the time series (Vačkář et al., 2012).
same method and intensity of collection in the same study           To generate reliable indices, only time series with at least
area in each of the study years (Collen et al., 2008). Time         three observation years should be used (Dobson, 2005).
series may be of total population counts or of proxies of           As most time series for Austrian vertebrate populations
population size such as density measures (McRae et al.,             had only two or three observation years and as GAMs are

Die Bodenkultur: Journal of Land Management, Food and Environment                                                        71 (1) 2020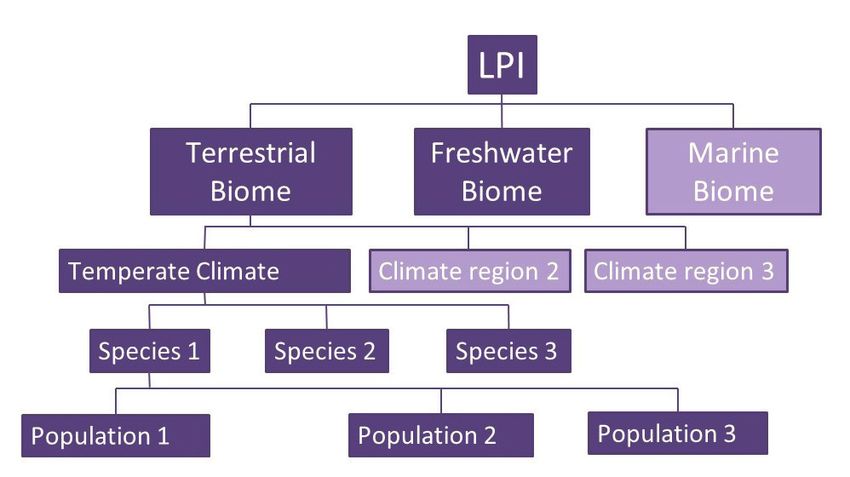
22 Katharina Semmelmayer, Klaus Hackländer
preferred over the chain method (Fewster et al., 2000), (mostly 2 or 3 years) and series with long gaps between
only time series with at least 5 observation years were used years of data collection, 873 time series, representing 268
for the calculation of the Austrian LPI. vertebrate species, could be used in the calculation of the
To calculate the GAM, data for amphibians and reptiles LPI. Most time series were obtained from the provinces
were combined into a “herpetological class” because of Upper Austria and Carinthia; there were few time series
insufficient data. Furthermore, according to data availabil- from the Tyrol and Vorarlberg (Figure 2).
ity, the base was set to 1990 instead of the global base 1970 Data availability increased overall from the mid-1990s to
(Loh et al., 2005). Apart from these changes, the calcula- 2010, with a decrease only in 2003. There were a mini-
tion was carried out in an automated way (McRae et al., mum of 125 data points in 1996 and a maximum of 636
2017) by the R-package rlpi, following the stepwise proce- in 2010. After 2010, the number of data points decreased
dure described by Collen et al. (2008): again (Figure 3).
• Fit a GAM in which log10 (Nt) is the dependent vari-
able, Year (t) is the independent variable, and Nt is the
3.2. The Living Planet Indices
population value N of a time series in year t.
• Set smoothing parameters. The LPI was calculated for Austria and separately for the
• Calculate population estimates for the whole time terrestrial biome, the freshwater biome, species that were
span, including log-linear interpolation for years with- classed as native (autochthonous) to Austria by the Inter-
out observations. national Union for Conservation of Nature (http://www.
• Calculate confidence intervals using the 100-repeti- iucnredlist.org/, 28.11.2017), and birds. Owing to insuffi-
tion boot-strapping method (Collen et al., 2008). cient data, separate LPIs could not be calculated for mam-
mals, fish, the herpetological class, or each of the Austrian
Bootstrapping is a widely used method to calculate confi- provinces.
dence intervals by drawing random samples with replace- The Austrian LPI was calculated unweighted and weighted
ment from the collected data (Collen at al., 2008). It is also according to species richness in each class (Table 2). The
important to mention that index values for missing years unweighted index shows a decrease in 1991, followed by
were exclusively generated by interpolation (Collen et al., a small increase in 1992 and decreases until 1997. Since
2008), thus no extrapolation to years before the first or then, it has been fluctuating between 0.4 and 0.7, being
past the last year of data collection was performed. closer to 0.7 in more recent years. The weighted LPI has
Data were processed according to MacRae et al. (2017), a more pronounced increase in the first half of the 1990s
using the unweighted approach and also with weighting. than the unweighted one and shows stronger fluctuations
Therefore, data were converted into .csv-tables (Table 1) in the following years until 2015, with peaks reaching
and further processed using infiles generated in R. Infiles almost 0.8 (Figure 4).
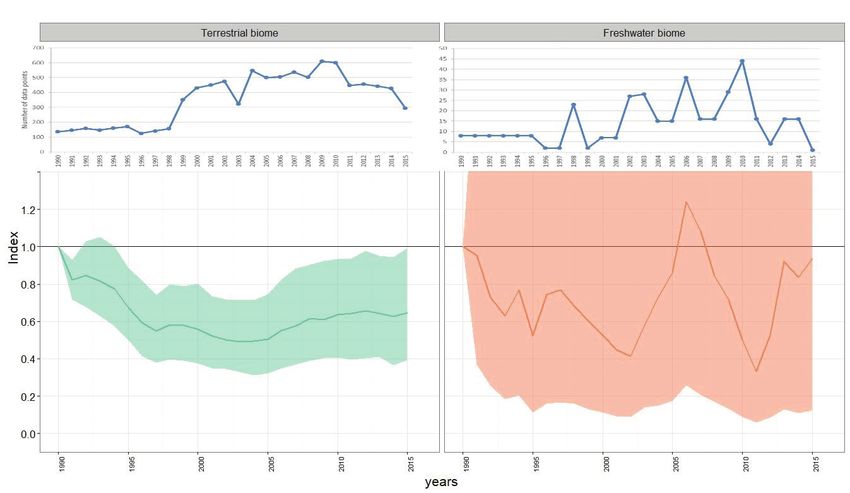
provide the information on the location of the data used The LPI for the terrestrial biome contained 837 time
for index calculation and on the weighting of time series series, representing 243 species, whereas only 60 time
within the index (MacRae et al., 2017). For detailed infor- series (representing 40 species) could be used for the calcu-
mation on the calculation, see https://github.com/Zoolog- lation of the freshwater LPI. Owing to data availability, the
ical-Society-of-London/rlpi (03.07.2018). terrestrial LPI was very similar to the Austrian index. For
Weighting according to species richness in each class was the freshwater index, no reliable results could be obtained
carried out (Table 2), but weighting was not carried out for because of the little data available resulting in extremely
each province (McRae et al., 2017). large confidence intervals (Figure 5).
The LPI for birds (Figure 6, left), based on 547 time
series representing 205 species, showed a decrease below
3. Results 0.6 in the mid-1990s and between 2000 and 2005, but
in between and since then, it has been increasing and
3.1. Data availability increased to ~0.7 by 2015.
The 812 time series representing 241 species were used to
A total of 2,145 time series for Austrian vertebrate popu- create the LPI for species native to Austria, which was simi-
lations were collected. After rejection of short time series lar to the unweighted LPI for Austria: it showed a decrease
Die Bodenkultur: Journal of Land Management, Food and Environment 71 (1) 2020
Monitoring vertebrate abundance in Austria: developments over 30 years 23
Figure 2. Number of time series for the calculation of the Austrian Living Planet Index per region and animal class.
Abbildung 2. Anzahl der für die Berechnung des österreichischen Gesamt-LPI zur Verfügung stehenden Datenreihen nach Bundesland und Tierklasse.
from the base year until the mid-1990s, followed by a 1990, as there were not enough data for the index calcula-
small increase, resulting in fluctuations around ~0.6 from tion before 1990. This choice of base year was a compromise
2006 until 2015 (Figure 6, right). between the aim to start as early as possible and the possibili-
ties given by the length of time series available. Nevertheless,
it must be seen critically that different vertebrate species are
4. Discussion not represented well in the data set and especially in the base
year. This namely applies for fishes and reptiles.
4.1. Limitations Thus, financial and personal resources for the systematic
long-term monitoring of animal populations are needed
The present study was limited by the data available, as suf- (Balmford et al., 2003; McRae et al., 2017). In the long-
ficient data are crucial for the calculation of valid indices term, it is especially important to collect data on groups
(Collen et al., 2008). This resulted, for example, in the such as amphibians and reptiles, which are underrepre-
change of base year from 1970, which is used globally, to sented in research in Austria and on a global scale (McRae
Table 1. Example of data format used to calculate the LPI.
Tabelle 1. Beispiel für das Format der Datensätze zur Berechnung des LPI.
Time series Location Red List Year 1 Year 2 Year 3 Year 4 Year 5 Year 6
Series 1 A LC 2.5 8 3 5 4
Series 2 B NT 66 10 18.9 5
Series 3 C NT 128 210 564
Die Bodenkultur: Journal of Land Management, Food and Environment 71 (1) 2020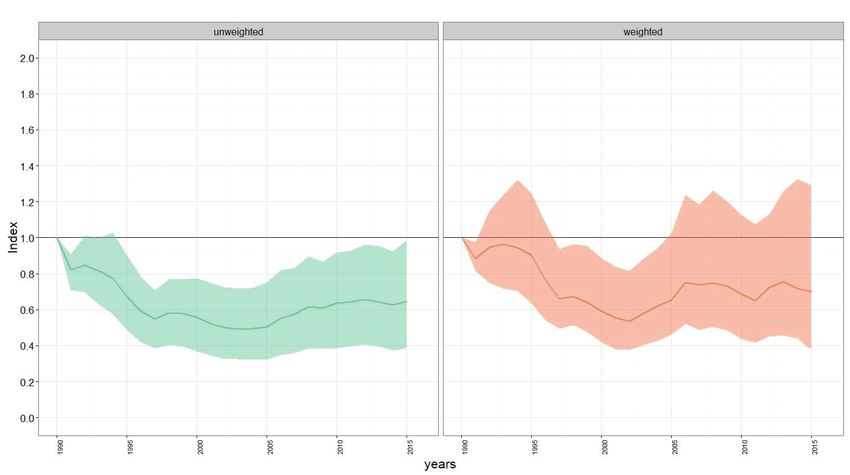
24                                              Katharina Semmelmayer, Klaus Hackländer

Figure 3. Number of observations per year that could be used to calculate the Austrian Living Planet Index.
Abbildung 3. Anzahl der für die Berechnung des österreichischen Gesamt-LPI zur Verfügung stehenden Beobachtungen pro Berechnungsjahr.

et al., 2008 and 2017). As a short-term solution, McRae                of an ecosystem. This state is neither known nor considered
et al. (2017) suggested the use of weighting, a method that            in the base year (Vačkář et al., 2012), which has also been
still needs research both globally and in Austria.                     criticized (Magurran et al., 2010). The lack of knowledge
The quality as well as the quantity of data is important. As           of the basic state makes comparison of indices using differ-
much of the data collection was performed voluntarily by               ent base years, or using the same base year, but describing
people who are interested in the results of the index; trust           ecosystems in different states, more difficult (Collen et al.,
may be placed in it (McRae et al., 2008). For the Austrian             2008; Magurran et al., 2010). Nevertheless, comparisons
LPI, the origin of all data was checked by the authors to              of different regions can be made if the same base year is
ensure the quality of each time series. Furthermore, the               used (Ten Brink, 2005 and 2007). In case of the LPI, the
focus on long time series (minimum 5 years of data) for the            first year of each time series is functioning as a base line for
calculation of the Austrian LPI provides further reliability.          this time series (Ten Brink, 2005). This is known as the
Nevertheless, it must be seen critically that data on certain          “shifting baseline syndrome” (Vačkář et al., 2012). It needs
classes, namely reptiles, is so scarce.                                consideration in the interpretation and comparison of dif-
The LPI is calculated using GAMs, so calculations include              ferent LPIs.
the geometric mean. Therefore, study years with popula-
tion estimates of zero can be problematic. Buckland et al.
                                                                       4.2. The Austrian LPI and its disaggregations
(2005) suggested that 1% of the arithmetic mean over the
whole time period should be added to any zeros before the              The stabilization of the unweighted Austrian LPI at ~0.6 in
calculation (Loh et al., 2005). The geometric mean under-              the recent years could be seen as a fulfillment of the CBD
estimates high values compared to the arithmetic mean,                 goal to reduce biodiversity loss significantly by 2010 (Loh et
and, therefore, the whole index may be slightly biased                 al., 2005). It even suggests that the more ambitious goal of
toward showing a trend that is too negative (Van Strien                the European Union, to stop the loss of biodiversity (Pereira
et al., 2012). Nevertheless, Van Strien et al. (2012) con-             and Cooper, 2006), has been reached in Austria. However,
sidered GAMs to be one of the best ways to calculate such              this is only true if two assumptions are met: first, the diver-
indices, which is widely accepted and a concern in all LPIs            sity of vertebrate populations is representative of a broader
calculated by the current method.                                      biodiversity (Collen et al., 2008), which has not yet been
The LPI shows changes over time (Loh et al., 2005) in rela-            assessed (Loh et al., 2005). It is, therefore, important to rec-
tion to a base year, rather than by considering the basic state        ognize that we can only comment on changes in vertebrate

Die Bodenkultur: Journal of Land Management, Food and Environment                                                               71 (1) 2020

Monitoring vertebrate abundance in Austria: developments over 30 years 25

Figure 4. The unweighted (left) and weighted (right, weighting based on species richness, see Table 2) Austrian Living Planet Index. According
to the data availability, the index (bold line) was calculated from the base year 1990 to 2015. The shaded areas are the 95% confidence intervals.
Abbildung 4. Der LPI für Gesamt-Österreich – ungewichtet (links) und gewichtet (rechts). Das Basisjahr ist 1990. Aufgrund der Datenlage konnte
der Index (durchgängige, dicke Linie) bis 2015 berechnet werden. Die schattierten Bereiche kennzeichnen die 95 %-Konfidenzintervalle.

populations (Collen et al., 2008). Second, the results are reli-          lack of data for fish and also more broadly for the freshwa-
able. This has been doubted, because of the limited amount                ter biome in Austria. More data would allow to calculate a
of data considered. However, even with a (hypothetical)                   more reliable and smoother index, because peaks of a small
increased amount of data, we do not know the real absolute                amount of species would not cause such big differences
decline in vertebrate populations because we do not know                  anymore. The similarity of the LPI for autochthonous
their state of decline before the first year of data collection,          species to the unweighted Austrian LPI confirms that the
which forms the base year (Vačkář et al., 2012).                          decline in vertebrate abundance occurs in native Austrian
Nevertheless, declines in population level are undoubt-                   species and cannot be attributed to a decline in introduced
edly more precise and sensitive than species-level rates of               or introduced and invasive species. Therefore, the decline
decline, as the first are a warning, and measures can still be            in species according to the Austrian LPI does not show the
taken based on the LPIs (Collen et al., 2011). Therefore,                 successful reduction of invasive species (Essl and Rabitsch,
the aim of forming a baseline for the reporting duties of                 2004) but rather points out a severe loss of autochthonous
Austria within international duties can be achieved partly                species. However, detailed assessment of the status of inva-
by the use of the Austrian LPI, but it should not be the                  sive species might, nevertheless, show a success in their
exclusive means to show trends in biodiversity.                           reduction and could be a goal for future analysis.
The similarities between the LPIs for the terrestrial biome               The data for mammals, fish, amphibians, and reptiles in
and native species result from many samples being included                Austria were insufficient in quantity and quality. This is sim-
in both of them. The freshwater LPI consists mainly of                    ilar to the global situation (McRae et al., 2017). Weighting,
data from fish and reflects trends in this vertebrate class,              as was performed by McRae et al. (2017) for the global LPI,
such as a peak in 2006 and a low level in 2011. However,                  may counteract this problem if adequate coefficients can be
the idea of a separate index for fish was abandoned because               defined for each class. It is necessary to find out potential
of unreliable results because of a small number of time                   bias in the data set (e.g., toward certain regions or groups
series with many missing values. This shows that there is a               of species; McRae et al., 2017) to implement reasonable

Die Bodenkultur: Journal of Land Management, Food and Environment                                                                    71 (1) 2020
26 Katharina Semmelmayer, Klaus Hackländer
Figure 5. The unweighted Austrian Living Planet Index for the terrestrial biome (left) and the freshwater biome in Austria (right). According to the
data availability, the index (bold line) was calculated from the base year 1990 to 2015. The shaded areas are the 95% confidence intervals. Upper
blue curve indicates number of observations per year that could be used to calculate the index.
Abbildung 5. Der ungewichtete LPI für das terrestrische Biom (links) und das Süßwasserbiom in Österreich (rechts), mit Basisjahr 1990. Die schat-
tierten Bereiche kennzeichnen die 95 %- Konfidenzintervalle. Die blaue Kurve spiegelt die Anzahl der für die Berechnung des Index zur Verfügung
stehenden Beobachtungen pro Berechnungsjahr wider.
weighting. The weighting tried out on the Austrian data set Vorarlberg, but it is necessary for certain vertebrate classes,
is based on the number of species per class occurring in Aus- namely, for reptiles, for fishes, and amphibians, in all prov-
tria (Table 2). This implicates that the highest coefficient inces, but in Burgenland it is necessary also for mammals.
is chosen for the class with the highest number of species, The short-term solution of weighting (McRae et al., 2017)
which in Austria is the class of birds. As a result, most weight may counteract data deficiency until more data are avail-
is put on a class that is already overrepresented in the data able. This may be performed by taking into account ecologi-
set. The weighting process carried out should thus be seen cal, geographical, and administrational units. For example,
as an experiment, and more research on reasonable weight- the number of time series per Austrian province could be
ing must be conducted. A better approach might be not to related to the size of the province to find out if the data set
weigh by species but by region, because there are areas with is biased toward some provinces. In addition, the amount of
large data deficiency in Austria. This conclusion is similar to data from protected areas must be put in relation to the size
the one drawn by McRae et al. (2017). Disaggregation by of protected areas in the country. A comparison of the num-
region has been carried out for the global LPI (WWF, 2016) ber of threatened species in Austria versus the proportion of
and for some country LPIs, for example, Canada (WWF- threatened and/or protected species in the data set could also
Canada, 2017), but was not possible for the Austrian LPI be an indication for a potential bias. We, therefore, suggest
because of insufficient data for each of the nine provinces. that weighting would technically work on the Austrian data
This indicates the necessity of data collection, not only on a set, but further research needs to be conducted to obtain
species level but also on a regional one. It, therefore, could reasonable results counteracting possible bias in the data set
be shown that data collection via long-term monitoring is (which has not been quantified in this study).
especially needed in the western provinces, the Tyrol and
Die Bodenkultur: Journal of Land Management, Food and Environment 71 (1) 2020
Monitoring vertebrate abundance in Austria: developments over 30 years 27
Table 2. Number of vertebrate species in each class occurring in Austria according to the Ministry of Sustainability and Tourism (2010) and the
proportion of species richness that was used for weighting in the calculation of the Austrian LPI.
Tabelle 2. Anzahl der in Österreich vorkommenden Wirbeltierarten laut Umweltbundesamt 2010, aufgeteilt auf Tierklassen, und die daraus resul-
tierende Gewichtung bei der Berechnung des LPI für Österreich.
Class Number of species occurring in Austria Proportion used for weighting in the calculation of the LPI
Amphibians 20 0.074
Reptiles 14
Fish 84 0.182
Mammals 101 0.219
Birds 242 0.525
Total 461 1.0
4.3. Conservation status of birds in Austria with agricultural land (Teufelbauer, 2015). A comparison
between the Austrian Farmland Bird Index (which starts
Birds are the only vertebrate class that is well represented in 1998; Teufelbauer and Seaman, 2017) and the Austrian
in the Austrian LPI. In Austria, changes in bird popula- LPI for birds indicates a greater decline in farmland birds
tions are also quantified by the Farmland Bird Index than in the broad spectrum of 205 bird species used to cal-
(Teufelbauer and Seaman, 2017) and the Woodland Bird culate the LPI for birds. This suggests that farmland birds
Index (Teufelbauer et al., 2014). The Farmland Bird are more negatively affected by habitat loss and/or human
Index includes 22 bird species that are directly associated activity (Teufelbauer, 2015) than the Austrian bird fauna
Figure 6. The unweighted Living Planet Index for birds (left) and vertebrate species native to Austria (right). According to the data availability,
the index (bold line) was calculated from the base year 1990 to 2015. The dark shaded areas are the 95% confidence intervals. Upper blue curve
indicates number of observations per year that could be used to calculate the index.
Abbildung 6. Der ungewichtete Living Planet Index für Vögel (links) und autochthone Arten in Östererreich (rechts), mit Basisjahr 1990. Die
schattierten Bereiche kennzeichnen die 95 %-Konfidenzintervalle. Die blaue Kurve spiegelt die Anzahl der für die Berechnung des Index zur Ver-
fügung stehenden Beobachtungen pro Berechnungsjahr wider.
Die Bodenkultur: Journal of Land Management, Food and Environment 71 (1) 202028 Katharina Semmelmayer, Klaus Hackländer
Table 3. Differences between the global LPI (Collen et al., 2008, WWF, 2016, Living Planet Database: http://www.livingplanetindex.org/home/
index) and the Austrian LPI.
Tabelle 3. Unterschiede zwischen globalem (Collen et al., 2008, WWF, 2016, Living Planet Database: http://www.livingplanetindex.org/home/
index) und österreichischem LPI.
Global LPI Austrian LPI
Base year 1970 1990
Last year (as of January 2020) 2014 2015
Number of time series (as of January 2020) More than 26,000 873
Length of time series used to calculate LPI Minimum 2 years Minimum 5 years
Weighting Started in 2017, regional and species level Species level within classes
Biomes Terrestrial, freshwater, marine Terrestrial, freshwater
as a whole. The results of the Austrian LPI are more con- LPI has stabilized at a decline of ~40% in a period between
sistent with the Woodland Bird Index, which shows that 1990 and 2015. However, if we compare the years covered
declines in populations of 19 bird species associated with by both indices and thus the decline between 1990 and
forests is much less severe than the decline in populations 2014, there is a decline of more than 20% in the global LPI
of farmland birds (Teufelbauer et al., 2014). The Farmland (WWF, 2018), whereas the decline in Austria in the same
Bird Index, therefore, is designed to show human impact period is almost 40%, so almost double the global decline.
on birds by deliberately looking on species associated with It is also important to point out that any decline before
an agricultural landscape (Teufelbauer and Seaman, 2017). 1990 is unknown for Austria. It might have been similar
On the contrary, the LPI on all data sets of Austrian birds or even more severe than the decline on the global level.
of all kind of different habitats puts focus on the overall Thus, the problem of shifting base lines and unknown
trends in population development without presuming a base states (Vačkář et al., 2012) needs to be kept in mind
cause for such a found trend. because it might hide severe losses from previous decades.
Although it, therefore, was possible to gain some insight in Nevertheless, when looking at temperate terrestrial systems
the conservation status of birds using the LPI, in combina- on a global level (Collen et al., 2008), the index does not
tion with the research conducted using the Farmland Bird show much change between 1970 and 2003. It stays within
Index (Teufelbauer and Seaman, 2017) and the Woodland a range of ~0.8–1.1 and thus even shows some increase
Bird Index (Teufelbauer et al., 2014), it was not possible to over the base level of 1, especially after 1990 (Collen, 2008;
do so for other vertebrate classes, as reliable disaggregation WWF, 2010). This is different for the Austrian terrestrial
of the LPI was not possible and habitat-specific indices for LPI, which declined until a level of about 0.6. Although
them do not exist in Austria. it declined in the first years of calculation, until a level of
about 0.5, it has been slowly increasing since 2004–2005,
which reflects the temperate terrestrial situation with about
4.4. The global LPI and the Austrian LPI
10–15 years delay. Difference in data availability and base
Technical differences between the global LPI and the Aus- year are two probable reasons for the differences between
trian LPI are summarized in Table 3. For the Austrian LPI, Austrian and the global temperate situation.
the base year, the last year of index calculation, and the
minimum length of time series used to calculate the index
were chosen according to the data availability. Weighting Conclusion
was conducted for the first time. The marine biome has
not been taken into account, because Austria is a land- In conclusion, it was shown that vertebrate abundance in
locked country. Austria declined ~40% between 1990 and 2014, which is
Although these differences complicate the comparison, almost double the decline calculated for the same period
it is clear from both LPIs that the decrease in vertebrate on a global level. However, more research needs to be con-
abundance is severe (WWF, 2016). The overall decline in ducted on the topic of weighting to get more precise results
the global LPI is 60% from 1970 to 2014 (WWF, 2018), as a short-term solution, whereas on the long-term, more
and this decline is likely to continue, whereas the Austrian data is needed for certain classes of species and some regions.
Die Bodenkultur: Journal of Land Management, Food and Environment 71 (1) 2020
Monitoring vertebrate abundance in Austria: developments over 30 years 29
Acknowledgments Aichi Biodiversity Targets. In: Secretariat of the Con-
vention on Biological Diversity, Nagoya.
This study would not have been possible without data Dobson, A. (2005): Monitoring global rates of biodiversity
from various Austrian scientists, scientific and governmen- change: challenges that arise in meeting the Convention
tal institutes, and non-governmental organizations. We on Biological Diversity (CBD) 2010 goals. Philosophi-
thank them for providing their knowledge and data for cal Transactions of the Royal Society B 360, 229–241.
this project. We would also like to thank Paul Griesberger, Essl, F. and W. Rabitsch (2004): Österreichischer Aktions-
Friedrich Leisch, and Louise McRae with her team for the plan zu gebietsfremden Arten (Neobiota). Bundesmi-
statistical support. We are grateful to Nancy Jennings for nisterium für Land- und Forstwirtschaft, Umwelt und
checking an earlier version of this manuscript. We would Wasserwirtschaft, Wien.
also like to thank two anonymous reviewers for their valu- EU European Council (2001): European Council
able suggestions for improvement on previous versions of Göteborg – Conclusions of the Presidency. Bulletin
the manuscript. 18.06.2001, PE 305.844.
Fewster, R.M., Buckland, S.T., Siriwardena, G.M., Bail-
lie, S.R. and J.D. Wilson (2000): Analyses of popula-
References tion trends for farmland birds using generalized additive
models. Ecology 81, 1970–1984.
Balmford, A., Green, R.E. and M. Jenkins (2003): Mea- Freeman, R., McRae, L., Deinet, S., Amin, R. and B. Col-
suring the changing state of nature. Trends in Ecology len (NA): rlpi: Tools for calculating indices using the
& Evolution 18, 326–330. Living Planet Index method. R package version 0.1.0.
Butchart, S.H.M., Walpole, M., Collen, B., van Strien, A., https://github.com/Zoological-Society-of-London/liv-
Scharlemann, J.P.W., Almond, R.E.A., Baillie, J.E.M., ing_planet_index.
Bomhard, B., Brown, C., Bruno, J., Carpenter, K.E., Carr, Gepp, J. (1984): Rote Liste gefährdeter Tiere Österreichs.
G.M., Chanson, J., Chenery, A.M., Csirke, J., David- 2.Auflage. Bundesministerium für Gesundheit und
son, N.C., Dentener, F., Foster, M., Galli, A., Galloway, Umweltschutz, Wien.
J.N., Genovesi, P., Gregory, R.D., Hockings, M., Kapos, Habenicht, G. (2014): Bibermanagement Oberösterreich.
V., Lamarque, J.-F., Leverington, F., Loh, J., McGeoch, Monitoringbericht 2014. Im Auftrag des Amts der
M.A., McRae, L., Minasyan, A., Hernández Morcillo, OÖ. Landesregierung Direktion für Landesplanung,
M., Oldfield, T.E.E., Pauly, D., Quader, S., Revenga, C., wirtschaftliche und ländliche Entwicklung, Abteilung
Sauer, J.R., Skolnik, B., Spear, D., Stanwell-Smith, D., Naturschutz.
Stuart, S.N., Symes, A., Tierney, M., Tyrrell, T.D., Vié, Legg, C.J. and L. Nagy (2006): Why most conservation
J.-C. and R. Watson (2010): Global biodiversity: Indica- monitoring is, but need not be, a waste of time. Journal
tors of recent declines. Science 328, 1164–1168. of Environmental Management 78, 194–199.
Buckland, S.T., Magurran, A.E., Green, R.E. and R.M. Loh, J., Green, R.E., Ricketts, T., Lamoreux, J., Jenkins,
Fewster (2005): Monitoring change in biodiversity M., Kapos, V. and J. Randers (2005): The Living Planet
through composite indices. Philosophical Transactions Index: using species population time series to track
of the Royal Society B 360, 243–254. trends in biodiversity. Philosophical Transactions of the
Collen, B., Loh, J., Whitmee, S., McRae, L., Amin, R. and Royal Society B 360, 289–295.
J.E.M. Baillie (2008): Monitoring change in vertebrate Magurran, A.E., Baillie, S.R., Buckland, S.T., Dick, J.,
abundance: the Living Planet Index. Conservation Biol- Elston, D.A., Marian Scott, E., Smith, R.I., Somerfield,
ogy 23, 317–327. P.J., and A.D. Watt (2010): Long-term datasets in bio-
Collen, B., McRae, L., Deinet, S., De Palma, A., Car- diversity research and monitoring: assessing change in
ranza, T., Cooper, N., Loh, J. and J.E.M. Baillie (2011): ecological communities through time. Trends in Ecol-
Predicting how populations decline to extinction. ogy & Evolution 25, 574–582.
Philosophical Transactions of the Royal Society B 366, McRae, L., Deinet, S. and R. Freeman (2017): The diver-
2577–2586. sity-weighted Living Planet Index: Controlling for
Conference of the parties (2010): COP-10 Decision X/2. taxonomic bias in a global biodiversity indicator. PLoS
Strategic Plan for Biodiversity 2011 – 2020 and the ONE 12, e0169156.
Die Bodenkultur: Journal of Land Management, Food and Environment 71 (1) 202030 Katharina Semmelmayer, Klaus Hackländer McRae, L., Loh, J., Bubb, P.J., Baillie, J.E.M., Kapos, V. Netherlands, Voorburg/Heerlen & SOVON, Beek- and B. Collen (2008): The Living Planet Index – guid- Ubbergen, pp. 663–673. ance for national and regional use. UNEP-WCMC, Teufelbauer, N. (2015): Farmland Bird Index: Aktuelle Cambridge, UK. Entwicklung und der Konnex zu Landschaftselemen- Overmars, K.P., Schulp, C.J.E., Alkemade, R., Ver- ten. Online-Fachzeitschrift des Bundesministeriums für burg, P.H., Temme, A.J.A.M., Omtzigt, N. and J.H.J. Land- und Forstwirtschaft, Umwelt und Wasserwirt- Schaminée (2014): Developing a methodology for a schaft. Ländlicher Raum – Ausgabe 03. species-based and spatially explicit indicator for biodi- Teufelbauer, N., Büchsenmeister, R., Berger, A., Seaman, versity on agricultural land in the EU. Ecological Indi- B. and B. Regner (2014): Waldvogelindikator für Öster- cators 37, 186–198. reich (Woodland Bird Index) im Auftrag des Bundesmi- Pereira, H.M. and H.D. Cooper (2006): Towards the nisteriums für Land- und Forstwirtschaft, Umwelt und global monitoring of biodiversity change. Trends in Wasserwirtschaft, Zahl: BMLFUW-LE.1.3.7/0029- Ecology & Evolution 21, 123–129. II/5/2012. Bundesforschungszentrum Wald & BirdLife R Core Team (2016): R: A language and environment for Österreich, Wien. statistical computing. R Foundation for Statistical Com- Teufelbauer, N. and B. Seaman (2017): Farmland Bird puting, Vienna, Austria. https://www.R-project.org/. Index 2016 – 2. Teilbericht des Projekts Farmland Bird Secretariat of the Convention on Biological Diversity Index für Österreich: Indikatorermittlung 2015 bis (2005): Handbook of the Convention on Biological 2020. BirdLife Österreich im Auftrag des Bundesmi- Diversity including its Cartagena Protocol on Biosafety, nisteriums für Land- und Forstwirtschaft, Umwelt und 3rd edition, Montreal, Canada. Wasserwirtschaft. Wien. Sittenthaler, M., Haring, E. and R. Parz-Gollner (2016): Vačkář, D., ten Brink, B., Loh, J., Baillie, J.E.M. and B. Erhebung des Fischotterbestandes in ausgewählten Reyers (2012): Review of multispecies indices for moni- Fließgewässern Niederösterreichs mittels nicht-invasiver toring human impacts on biodiversity. Ecological Indi- genetischer Methoden. Endbericht. Institut für Wild- cators 17, 58–67. biologie und Jagdwirtschaft, Universität für Bodenkul- Van der Sluis, T., Pedroli, B., Kristensen, S.B.P., Lavinia tur Wien. Cosorc, G. and E. Pavlis (2015): Changing land use Ten Brink, B. (2005): A long-term biodiversity, ecosystem intensity in Europe – Recent processes in selected case and awareness research network. indicators as commu- studies. Land Use Policy 57, 777–785. nication tools: an evaluation towards composite indi- Van Strien, A.J., Soldaat, L.L. and R.D. Gregory (2012): cators. Project no. GOCE-CT-2003-505298 ALTER- Desirable mathematical properties of indicators for bio- Net. WPR2-2006-D3b. diversity change. Ecological Indicators 14, 202–208. Ten Brink, B. (2007): Contribution to Beyond GDP “Vir- WWF-Canada (2017): Living Planet Report Canada Tech- tual Indicator Expo”. Beyond GDP – International nical Document. WWF-Canada, Toronto, Ontario. Conference 2007, Brussels. WWF (2010): Living Planet Report 2010. Biodiversity, Ter Braak, C.J.F., Van Strien, A.J., Meijer, R. and T.J. Ver- biocapacity and development. WWF International, strael (1994): Analysis of monitoring data with many Gland, Switzerland. missing values: which method? In: E.J.M. Hagemeijer WWF (2016): Living Planet Report 2016. Risk and resil- and T.J. Verstrael (Eds.): Bird Numbers 1992. Distri- ience in a new era. WWF International, Gland, Swit- bution, monitoring and ecological aspects. Proceed- zerland. ings of the 12th International Conference of IBCC and WWF (2018): Living Planet Report 2018. Aiming Higher. EOAC, Noordwijkerhout, The Netherlands. Statistics WWF, Gland, Switzerland. Die Bodenkultur: Journal of Land Management, Food and Environment 71 (1) 2020
You can also read