System Level Measures - Improvement Plan 2018-19 CANTERBURY HEALTH SYSTEM - Canterbury ...
←
→
Page content transcription
If your browser does not render page correctly, please read the page content below

CANTERBURY HEALTH SYSTEM

  System Level Measures
  Improvement Plan
  2018-19

                           1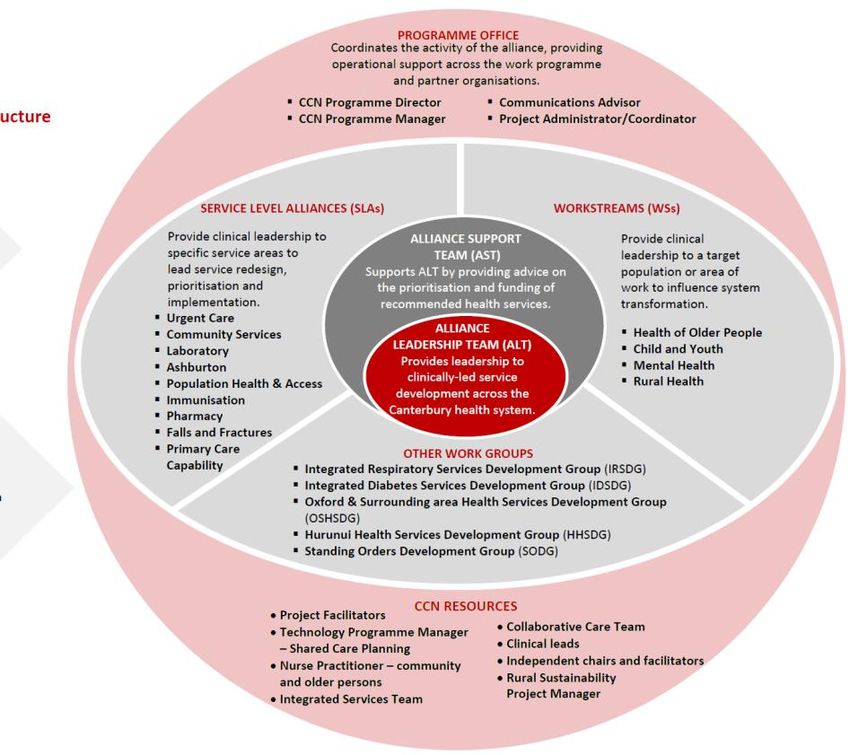
INTRODUCTION
The Canterbury Health System places a high priority on implementing the System Level Measures Framework to
support change and system improvement. We are pleased to report we have comprehensively progressed the
Actions to Improve Performance detailed in Canterbury’s 2017/18 Improvement Plan and the System Level
Measures continue to track favourably. These benefits have resulted from positioning the System Level Measures
Framework as an integral part of Canterbury’s mechanisms for engaging the relevant stakeholders including our
clinical teams from across the system in leading change.

The expert groups, including the Service Level Alliances and Workstreams within the Canterbury Clinical Network
District Alliance, have delivered on the agreed actions and monitored their performance against the contributory
measures. More recently these groups have undertaken a comprehensive review of their progress ahead of
prioritising future actions in their 2018/19 work plans, and where necessary, refining the contributory and
secondary measures used to track their progress.

With the System Level Measures Framework now established within Canterbury’s way of working, over the next 12
months a greater focus will be placed on strengthening the communication of the System Level Measures
Framework across our health system. This will include providing data to a breadth of providers and accompanying
it with relevant information on ways they can contribute to improving our identified priorities. Alongside this will
be the ongoing focus on addressing health inequities, including highlighting where ethnic variation in the measures
exist and prioritising actions that will reduce inequities.

Key changes in our 2018/19 Improvement Plan include updating the Actions to Improve Performance, refining some
contributory measures including presenting these by ethnicity where appropriate, and resetting the System Level
Measures milestones. We are pleased to continue demonstrating Canterbury Health System’s commitment to
improving the health outcomes of our population through our collective identification of priorities, redesign of
services and implementation of transformation changes in the way health care is delivered through this Plan.

                       MESSAGE FROM SIR JOHN HANSEN
                       ALLIANCE LEADERSHIP TEAM CHAIR | CANTERBURY CLINICAL NETWORK
                      We’re extremely fortunate to have people who are committed to achieving better health
                      outcomes for the people of Canterbury and putting in the hard work to make sure this
                      happens. Each and every day staff across the Canterbury health system play a major role
 in helping us achieve this goal – whether it’s delivering services at the coal face or keeping things running
 smoothly behind the scenes.
 Looking back over the past year reinforces that working collaboratively towards a shared set of improvement
 measures enables us to make significant gains in improving and enhancing health services for our community.
  But all transformational change needs a long-term approach. By establishing
 clear outcomes, continually reviewing progress and making improvements on an
 ongoing basis we’re creating a sustainable health system more intuitive,
 effective and meaningful for our community.

           David Meates         Prof. Les Toop          Dr Lorna Martin          Dr Angus Chambers
           Chief Executive      Chair                   Chair                    Chair
           Officer              Pegasus Health          Rural Canterbury PHO     Christchurch PHO
           Canterbury DHB       Charitable Ltd
                                                                                                                   2
INTEGRATING THE SYSTEM LEVEL MEASURES FRAMEWORK INTO OUR HEALTH SYSTEM
Canterbury’s way of working brings together expert groups, including Service Level Alliances, Workstreams, and
workgroups within the Canterbury Clinical Network Alliance with the aim of leading change in health services that
improve the health outcomes of our population. Typically these groups include urban and rural clinicians who
participate in the services, people that bring consumer, Māori, Pacific and rural perspectives, and management
from the relevant organisations.
An expert group has been identified to lead each of the System Level Measures contributory and system measures
and associated activity. A table illustrating which expert group(s) are leading each of the contributory measures is
included in Appendix One. Also shown in this table are the expert groups that link with and/or support this activity.
A System Outcomes Steering Group involving clinical leaders from across the system, public health experts, quality
improvement staff, analysts and planners is in place to guide Canterbury’s ongoing development of the System
Level Measures framework. Figure 1. Illustrates the roles of this Steering Group and various expert groups.
Expert groups including SLAs and workstreams within the
Alliance
Access and analyse the relevant data;
Agree on specific actions to achieve the priorities and
establish an annual work plan;
Progress any service redesign or development
required; and
Monitor / report on their work plan including the
actions contributing to improvements in the measures.
The System Outcomes Steering Group
Oversees and monitors Canterbury’s response to the
System Level Measures;
Analyses the national and local data;
Refines Canterbury’s priorities and contributory
measures;
Identifies the expert groups best placed to champion
the measures; and
Leads the communication / engagement of providers
across the system in a collective system wide response.
to the System level Measure.
Figure 1: Summary of the role of the System Outcomes Steering Group and the expert groups leading each contributory measure.
3
KEY ACHIEVEMENTS

Significant progress has been made against the Actions to Improve Performance identified in Canterbury’s
2017/18 Improvement Plan. A snapshot of some key achievements are highlighted below.

             More newborns are enrolled in Community Dental Services
             Implementation of the LinKids multiple enrolment form has contributed to an increase in the
             percentage of newborns enrolled in Community Dental Services to 76% in 2017 up from 61% in
             2016.

 Greater understanding of the ethnic variation in our 0-4 ASH rate
 The findings from research on why Pacific 0-4 year olds are more likely to end up in hospital
 with ASH conditions is helping inform the next steps to addressing the ethnic variation in
 Canterbury’s 0-4 year old ASH rate.

                  Improved access for pregnant women to specialist smoking cessation support
                  The implementation of an incentivised pregnancy smoking cessation programme has
                  contributed to 84 pregnant women receiving specialist smoking cessation support in the six
                  months to 31 December 2017, and referrals being received from a range of providers,
                  including Lead Maternity Carers, secondary care services, pharmacists, and general practice
                  teams.

 More general practices are accessing feedback from their enrolled population
 71 (62%) general practices in Canterbury are now using the Primary Care Patient Experience
 Survey to access feedback from their enrolled patients, up from 50 (42%) 12 months earlier.

                                                                                                                4
CANTERBURY’S SYSTEM LEVEL MEASURES
FRAMEWORK
The diagram below demonstrates Canterbury’s System Level Measures Framework. In the centre are the System
Level Measures and circling those are the locally-selected contributory measures. Further detail on each
contributory measure is provided below.

                                                            Engagement
                                                              in health         Physical health of
                                        Motivational
                                                             promoting               people
                                        conversation
                                                         lifestyle services       experiencing
                                           training
                                                                                 mental illness Reduced length
                      In-hospital        completion
                 Survey completion                                                                of stay & monitor
                 rate & engagement                                                                  readmissions
                                                         AMENABLE
                of family / whanau in
                                                       MORTALITY RATES
                         care                                                                                 Reduced acute
                                                       UNDER 75 YEARS
                                                                                                                admissions
       Primary care’s                                                                                         following a fall
      engagement with
         the Patient
                                 PATIENT                                                   ACUTE
                                EXPERIENCE                                                HOSPITAL                       Reduced
         Experience
                                                                                                                      inappropriate
           Survey                OF CARE                                                  BED DAYS
                                                                                                                      polypharmacy

     Understand ethnic
                                 ASH RATES                                       BABIES IN SMOKE FREE
                                                                                                                    Outcome of
    variation in the ASH        FOR 0-4 YEAR                                       HOUSEHOLDS AT 6
                                                                                                                 pregnant women
            rate                   OLDS                                           WEEKS POST BIRTH                 provided with
                                                                                                                 cessation support

              Improved
              oral health                                    ACCESS &                                    Referrals of
                                                          UTILISATION OF                             pregnant women to
                                                       YOUTH-APPROPRIATE                                stop smoking
                        Increased new
                                                         HEALTH SERVICES                                   services
                       born enrolments

                                         Increased understanding              Strengthen dentists’
                                         of youth accessing of oral            transfer and recall
                                              health services                      processes

                                                                                                                                      5
HOW IT ALL FITS TOGETHER
The Canterbury Health System has tracked performance of our increasingly integrated and patient-centred
approach through the Canterbury Health System Outcomes Framework since 2013. The System Level Measures and
contributory measures detailed in this Improvement Plan are integrated into our existing Outcomes Framework to
demonstrate their alignment with Canterbury’s approach. The measures identified in this document have been
highlighted below within Canterbury’s Outcomes Framework to illustrate this alignment.

                            Canterbury Health System Outcomes Framework

                                                                                    The System Level Measures
                                                                                    contribute to Canterbury’s
                                                                                      Outcomes Framework

                                                                     System Level Measures Framework

                                                                                                                 6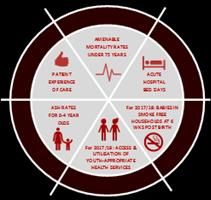
System level measure:
AMBULATORY SENSITIVE HOSPITALISATION RATE FOR 0-4 YEAR OLDS
CANTERBURY’S EXPERIENCE
Our priority is to reduce the ethnic variation in the ambulatory sensitive hospitalisation (ASH) rate between the
Pacific and Total populations.
At December 2017 Canterbury’s ASH rate for 0-4 year olds of 6,010 per 100,000 population is below the national
average for the Total population1 and, when viewed over the previous four years, continues to trend downwards.
Canterbury’s 0-4 year old ASH rate for the Pacific population of 10,595 per 100,000 is higher than the Total
population rate; however Canterbury’s 0-4 year old ASH
rate for the Māori population of 5,199 per 100,000 is
lower than Canterbury’s Total population rate. Viewing
Canterbury’s data by medical conditions illustrates:
The Upper Respiratory and Ear Nose and Throat
(ENT) Infections category is the largest contributor
to Canterbury’s ASH rate, at 2,002 per 100,000
Population.
Canterbury’s 0-4 year old ASH rates for Upper
Respiratory and ENT Infections and Lower
Respiratory Infections are higher than the national
average.
In 2017/18 work was undertaken to better understand the contributors to the ethnic variation in Canterbury’s 0-4
year old ASH rate. This included further analysis of the enrolment status and demographics of children admitted to
hospital with ASH conditions and research on why children of Pacific ethnicity are more likely to end up admitted.
The research identified some cultural factors including the concept of time and relationships with health providers,
and how this may influence the way people from Pacific communities’ access health care. This will be explored
further in 2018/19 alongside work to increase general practice’s visibility of their 0-4 year olds admitted with an
ASH event, strengthen referral pathways to whānau ora providers, and increase the enrolment of newborns in a
range of services including the Community Dental Service.
MILESTONE
Canterbury’s internal target is to reduce the Pacific inequity in ASH rates, however the relatively small number
of admissions and resulting inherent variation limits the viability of setting a numerical milestone. In addition,
analysis of the leading conditions contributing to the ASH rate confirms that influenza, gastro-enteritis
outbreaks and dental elective volumes have a significant influence on the yearly variation in ASH rate for 0-4
1The National Minimum Data Set of ASH Rate for 0-4 year olds to December 2017 using the New Zealand Standard Population informed Canterbury’s analysis
and establishment of the 2018/19 milestones.
7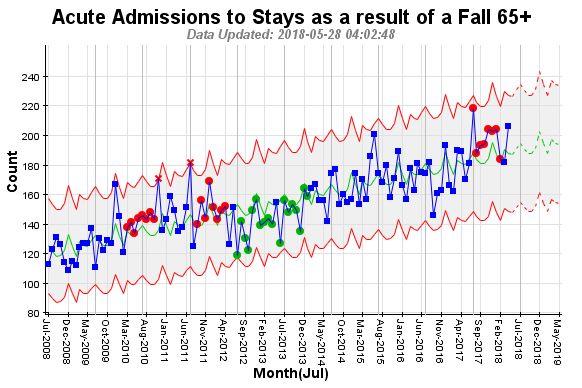
year olds across all populations. Acknowledging these challenges, the average ratio between the Total and
Pacific populations (Total rate:Pacific) has been selected as the soundest approach to setting a milestone2.

The small actual numbers involved with the Pacific ASH rate mean there is potential for large fluctuations
from quarter to quarter, for example, the addition of just 10 admissions changes the rate by 5% and increases
the ratio by 0.1. To reduce the effect of fluctuations due to the small Pacific population in Canterbury the
milestone has been calculated based on a four-year average.

The four year average for previous years has been 1:2.11 and 1:1.97. At this rate of reduction the four year
average in December 2017 will be 1:1.84. Over 2018/19 Canterbury will track and aim to reduce the average
ratio (Total rate:Pacific) over four years, to achieve a ratio of 1:1.84, or less, by 30 June 20193.

                                                                                                                                           Forecast 12
                                                                                                                                           mo. to Dec
                                                                                                                                           2018 (forecast
                           12 mo. to    12 mo. to    12 mo. to    12 mo. to    12 mo. to                                                   based on
                           Dec 2013     Dec 2014     Dec 2015     Dec 2016     Dec 2017                                                    previous years)
    Pacific Rate                   2.30         2.16         1.97         1.99         1.76                                                            1.67
    4-year average                                                        2.11         1.97                                                            1.84

CONTRIBUTORY MEASURES

     ASH RATE - VARIATION BETWEEN POPULATIONS

     Outcome sought: Understand the variation that exists between the Canterbury Total and Canterbury Pacific
     populations, with a focus on the ASH admissions for 0-4 year olds coded with Upper and ENT Respiratory
     Infections.
     Rationale for selection: A variation in the ASH rate for 0-4 year olds exists between the two population groups.
     This is evident in the Diagnosis Related Group (DRG) category Upper and ENT Respiratory Infections which is
     the single largest contributor to the ASH rate for 0-4 year olds and is above the national average. While the
     December 2014 ratio between the Pacific and Total population of 1:2.17 has decreased to 1:1.34 in December
     2017, true progress will be achieved through monitoring our progress over an extended period of time to
     account for inherent variation.

2
  Target setting for ASH rates is difficult due to the uncertainty around projecting future rates, based on the inherent variability of events in a relatively small
population. For the 12 months to September 2014, the ASH rate for Pacific 0 to 4 year olds was 14,225 per 100,000 population, with a calculated 95%
confidence interval of 12,707 to 15,744; for the Total population the rate was 6,583, and the 95% confidence interval was 6,300 to 6,865. For the purposes of
projecting a future target, based on these data, the ratio of Pacific to Total ASH rates may lie between 1.85 (using the lowest extent of the 95% confidence
interval for Pacific and the highest for Total population) and 2.50 (using the highest extent of the 95% confidence interval for Pacific and the lowest for the
Total population). The ASH rates and the ratios therefore need to be interpreted with caution and looked at over a longer reporting period.

3
  The December 2017 dataset was used to generate the milestone. The four year average for previous years has been 2.11 and 1.97. Using the forecast function
in Microsoft Excel the four year average in December 2018 will be 1.84.
                                                                                                                                                           8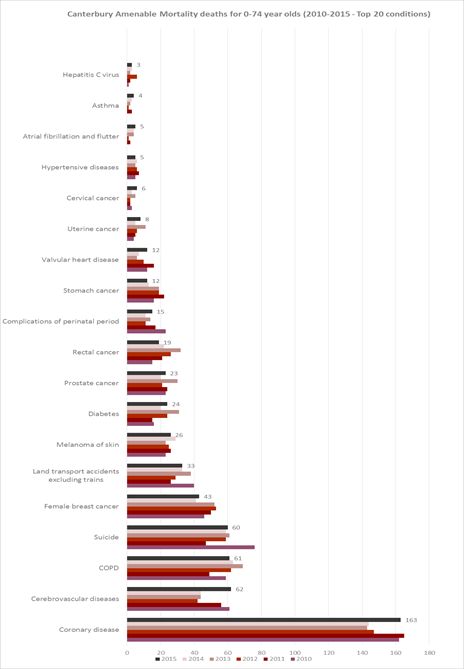
Measure description:
 The rate of 0-4 year olds admitted with a code
 of Upper Respiratory and ENT Infections and the
 gap that exists between the ASH rate for 0-4
 year olds in Canterbury’s Pacific and Total
 populations.
 Numerator: The number of ASH admissions for
 0-4 year olds coded with Upper and ENT
 Respiratory Infections.
 Denominator: The number of 0-4 year olds.
 Data source: Ministry of Health data released
 quarterly.

 ORAL HEALTH

 Outcome sought: An increase in the number of children who are caries free at five years of age.
 Rationale for selection: Dental conditions are the fourth largest contributor to Canterbury’s ASH rate for 0-4
 year olds with a rate of 618 per 100,000 at December 2017. In addition, there is local variance between
 population groups in both caries free and enrolment in the Community Dental Service. This measure has been
 selected from a number of oral health / child health indicators, including the enrolment of children in the wider
 health services. It should be noted that Canterbury currently does not add fluoride to its water supply, unlike
 many other North Island metropolitan areas.
 Measure description: The percentage of children
 caries free at five years of age.
 Numerator: At the first examination after the
 child has turned five years, but before their sixth
 birthday, the total number of children who are
 caries free (decay or filling free).
 Denominator: The total number of children who
 have been examined in the five-year-old age
 group, in the year to which the reporting relates.
 Data Source: Community Dental Service.

INCREASED ACCURACY OF ETHNICITY CAPTURE

Outcome sought: Increase the accuracy of ethnicity capture of new borns enrolled in general practice.
Rationale for selection: The collection of robust quality data enables the monitoring of access rates and results by
ethnicity; this in turn supports improved health planning and design and delivery of services aimed at reducing health
inequities. Any inaccurate capture of ethnicity at birth follows the new born’s registration into other services.
Measure description: This measure requires further analysis to identify the contributors of the inaccurate
ethnicity capture, the subsequent actions required and the key metric for monitoring change. In the interim, the
new borns enrolled in a PHO within three months by ethnicity illustrated below, will be monitored.

                                                                                                                         9
INCREASED NEWBORN ENROLMENT
Outcome sought: An increase in the number of new borns enrolled in general practice.
Rationale for selection: Early enrolment in general practice and the wider health services (including Well Child
Tamariki Ora and the Community Dental Service) is a foundation for patients accessing health care. There is
variability in the new born enrolment coverage, most noticeably in the Pacific population.
Measure description: The percentage of new
borns enrolled with a PHO within three months.
Numerator: Number of infants under three
months enrolled with a PHO.
Denominator: Number of births reported to the
National Immunisation Register. Note the
register includes all babies born in Canterbury,
some of whom are not from our region.
ACTIONS TO IMPROVE PERFORMANCE: ASH RATE FOR 0-4 YEAR OLDS
Contributory
Actions to Improve Performance Responsibility
Measure
ASH Rate Strengthen referral pathways from the health system to Whānau A project group within
Ora providers (i.e. Paediatric Department to Māori and Pacific the Child and Youth
Whānau Ora navigators for children admitted acutely). Workstream
Undertake further research that builds on recent findings of the
reasons why children of Pacific ethnicity are more likely to end up
admitted with an ASH condition.
Increase general practices visibility of their enrolled 0-4 year olds
who are admitted to hospital with an ASH event.
Oral Health Advocate for fluoridation of the drinking water supplies in Oral Health Service
Canterbury. Development Group
Strengthen the Community Dental Service’s current recall system.
Develop a process for engaging caregivers of children in health
services at birth but do not require the service until they are two
years old.
Note: Any increase in enrolments in the Community Dental Service,
particularly of high risk patients, may initially decrease the percentage
of children caries free at 5 years of age.
New Born Agree a communication process between the National Immunisation Service
Enrolment Immunisation Register and PHOs to assist with enrolling children Level Alliance and
in general practice. PHOs
Increased Complete work with Canterbury’s three PHOs to ensure all Patient Immunisation
Accuracy of Management Systems accommodate the 2017 Ethnicity Data Manager and PHOs,
Ethnicity Protocols and provide training on the capture of accurate Māori and Pacific
Capture ethnicity through this process. Reference Groups
10 Continue providing training to new midwives on the 2017
Ethnicity Data Protocols to increase the accuracy of ethnicity
recorded in Maternity Hospital Specialist Services.
11System level measure:
ACUTE HOSPITAL BED DAYS
4
CANTERBURY’S EXPERIENCE
Our priority is to further reduce the acute hospital bed day rate for the Total population, while optimising
hospitalisation for all ethnic groups.
Averaged over the three years to March 2018, Canterbury DHB’s Age Standardised Acute Bed Day rate of 290 per
1,000 population was 6.3% lower than the New Zealand Total rate of 309 per 1,000. Viewed by ethnicity5, averaged
over the three years Canterbury’s Standardised Acute Bed Day rates for the Māori population (315 per 1,000) and
Pacific population (466 per 1,000) are higher than Canterbury’s Total Acute Bed Day rate; while the Other
population rate is lower at 284 per 1,000 population.
Māori and Pacific perspectives are an embedded part of
Canterbury’s Alliance; membership across expert groups and
Reference Groups offer guidance in all aspects of service
redesign. Over 2017/18 the DHB and Pasifika Futures Boards
committed to working in partnership to improve the health of
Canterbury’s Pacific population. In 2018/19 this work will
continue and include implementing innovative approaches to
the funding and the delivery of health services that align with a
Pasifika view of health.
Viewing Canterbury’s data by medical conditions illustrates that the Stroke and Other Cerebrovascular Disorders
category is the largest contributor to Canterbury’s Acute Bed Day rate at 21 per 1,000 population, and is higher
than the national average of 17 per 1,000. In 2018/19 a comprehensive analysis of the care provided to people
admitted with a Stroke and Other Cerebrovascular Disorders will be undertaken to identify further opportunities
to optimise the patients’ in-hospital stay and timely discharge, noting that any change will require a system wide
response.
Over the last three years a number of Canterbury’s rural communities have engaged in developing new models of
care that identify opportunities for service improvements while ensuring the sustainability of the rural health
services. In the Hurunui region this has culminated in recommendations to implement an acute observation and
nursing service and establish a restorative community service. By assisting people to access these services locally,
and supporting their timely discharge after a hospital event or period of illness, these initiatives will contribute to
optimising Canterbury’s Acute Bed Day rate. In 2018/19 the design and implementation of these initiatives will be
progressed.
4 The National Minimum Data Set Acute Hospital Bed Days to December 2017 (using Age Standardisation to the WHO 2000 Standard Population) was used to
inform Canterbury’s analysis and establishment of the 2018/19 Milestones.
5
The National Minimum Data Set Acute Hospital Bed Days to December 2017 (age standardised using WHO 2000 Population Standard) by prioritised ethnic
groups
12MILESTONE
Despite Canterbury’s Acute Bed Day rate being significantly below the national average, further reducing this rate
is a high priority for Canterbury to manage its population within a constrained bed supply that will continue, even
after the new Acute Services Building opens in 2018/19. Higher than projected population growth is anticipated to
place pressure on Canterbury’s inpatient capacity with system-wide efforts underway to manage the demand on
hospital services.
In this context, work to reduce the ethnic variation in the Acute Bed Day rates is being progressed alongside a focus
(and setting of a milestone) on Canterbury’s Total Acute Bed Days rate. Canterbury considered setting a milestone
based on the ethnic variation between the Māori, Pacific and total population, however it is unclear what ethnic
variation is appropriate. Striving for equivalent acute bed day rates across all ethnicities may lead to Māori and
Pacific populations who have a higher burden of disease not receiving optimal access to acute hospital care. In
seeking equitable health outcomes Canterbury will work towards appropriate hospitalisation for all ethnicities.
Finally, in the process of establishing an achievable milestone for 2018/19, further analysis of Canterbury generated
data on Acute Bed Days was undertaken including consideration of the admitting medical conditions and how
amenable they were to change. Grouping the Acute Bed Days into those amenable to change (Medical, Surgical and
Rehabilitation admissions) and non-amenable (Mental Health and Maternity admissions) highlighted that a realistic
milestone would be based on 85% of the total Acute Bed Days. While this approach could not be replicated using
the National Service Framework Library data set, these local calculations continue to inform the setting of
Canterbury’s milestone.
The Canterbury Health System’s agreed milestone for June 2019 is to reduce the Acute Bed Days rate to 289 per
1,000 population or less.6 This has been generated using Canterbury’s Acute Bed Days average over the three
years to March 2018. It is noted that within this longer-term trend, the Acute Bed Days rate will be influenced by
external factors such as the severity of the influenza season.
CONTRIBUTORY MEASURES
REDUCED LENGTH OF ST AY FOR ACUTE ADMISSI ONS
Outcome sought: To reduce the number of occupied bed days following an acute admission while ensuring
patients receive clinically appropriate care during their hospital stay and after discharge, to avoid a
readmission.
Rationale for selection: Canterbury’s investment in primary care and work on condition specific pathways has
supported an overall reduction in the acute phase of hospital stays. At September 2016 Canterbury’s
standardised average length of stay of 2.41 bed days is below the New Zealand average stay of 2.54 bed days7.
Measure description: The number of beds occupied for greater than 14 days following an acute admission. Note
patients coded as Mental Health and Maternity are excluded. While a number of measures will be monitored
locally as indicators of the length of stay for acute admissions, this measure is considered a key metric for
monitoring change.
6
Milestone set using the National Minimum Data Set Acute Hospital Bed Days to March 2018 (age standardised using WHO 2000 Population Standard) by
prioritised ethnic groups. The previous three years (March 2016-18) Total rate was averaged to develop the milestone for June 2019.
7 National Minimum Data Set Inpatient Average Length of Stay (OS8) at September 2016 (standardised on age, sex, ethnicity, rurality, deprivation, acuity,
primary diagnosis, secondary diagnoses, comorbidity/complexity, operations, external cause codes)
13Data source: Local data generated through Signals from Noise (SFN).
MONITOR ACUTE READMISSIONS
Outcome sought: That people receive effective (and safe) treatment in our hospitals, as well as appropriate
support and care on discharge.
Rationale for selection: Measures of readmission rates are important balancing metrics for the reduced length
of stay for acute admissions. Monitoring the rates at different times post-discharge provides a more
comprehensive picture of factors contributing to readmissions, and better informs the response required.
The selection of both the 3 day and 28 day readmission rates as contributory measures provide appropriate
balancing metrics. The contributors to the readmission rates are multifaceted. Based on current knowledge, it
is proposed that an acute readmission to hospital within 3 days may be an indicator of a ‘failed discharge’. Any
increase in this rate would suggest further exploration into discharge timing, planning and its implementation,
and patient readiness was required. While an increase in the 28 day readmission rate could be driven by an
additional number of factors; with further investigation into contributors such as patients’ access to services,
the disease process, the integration and coordination of primary care and community services required.
Measure description: Monitor Canterbury’s acute readmission to hospital within 3 days.
Numerator: Canterbury’s average number of acute readmission stays in hospital within 3 days for a medical or
surgical admission.
Data source: Local data generated through SFN.
14Measure description: Monitor Canterbury’s acute readmission to hospital within 28 days.
Numerator: Canterbury’s average number of acute readmission stays in hospital within 28 days for a medical
or surgical admission.
Data source: Local data generated through SFN.
REDUCTION IN FALLS
Outcome sought: A reduction in the number of acute admissions to hospital following a fall for those aged 65
years and over.
Rationale for selection: Hip and Femur Procedures, Hip Replacements, and Humerus, Tibia, Fibula and Ankle
Procedures, are in the top fifteen DRG clusters8 contributing to Canterbury’s Acute Bed Days rate. A high
proportion of patients entering rehabilitation (which is generally a longer component of a patient’s overall
stay) have a primary code of femur, humerus and other fractures. Given Canterbury’s ageing population,
reducing the harm from falls will reduce the fracture related demand on acute services and help people to stay
well and independent in their own homes, whilst maintaining quality of life.
Measure description: A decrease in the number of acute admissions against a forecasted pre-intervention
trend of the number of acute admissions to hospital following a fall for those aged 65 years and over.
Data source: Local data generated through SFN.
8 Top 15 Grouped by the Highest Case Weighted Hospital Event within each Acute Stay at March 2018 (WHO 2000 Population Standard).
15POLYPHARMACY
Outcome sought: Prevention of, or a reduction in, the risks associated with polypharmacy.
Rationale for selection: The appropriate prescribing and dispensing of medications for people aged 65 years
and over will support improved health outcomes for older people, which is important for the Canterbury
Health System given its aging population. This measure is also an indicator of integration across general
practice, community pharmacy, and hospital care.
Note: It is acknowledged that while any medication therapy assessment will determine the appropriateness of
medications; it may not impact the number of medications being taken. The number of polypharmacy audits
completed and referrals for medication therapy assessments will be monitored locally alongside the rate of
people aged 65 years and over on 11+ medications.
Measure description: The rate of people dispensed with
11 or more long term medications.
Numerator: The count of patients aged 65 years and over
who have been dispensed 11 or more distinct chemicals
in two consecutive quarters.
Denominator: The count of the DHB population that is
aged 65 years and over.
Data source: The Health Quality and Safety Commission
(HQSC) Atlas of Variation.
ACTIONS TO IMPROVE PERFORMANCE: ACUTE BED DAYS RATE
Contributory Actions to Improve Performance Responsibility
Measure
Reduced Length Complete an analysis of the care provided to people Adult Rehabilitation
of Stay categorised with Stroke and Other Cerebrovascular Steering Group.
Disorders. Identify opportunities to optimise these patients’
in-hospital length of stay, timely discharge, and access to
community services.
Identify measures of progress through each phase of the
patient’s in-hospital stay.
Initiate the implementation of any changes identified to
optimise the patient pathway.
Monitor Acute Continue to monitor the number of readmissions as a Urgent Care Service
Readmissions balancing metric alongside the implementation of changes in Level Alliance
patient pathways and length of stays.
Minimise Harm Increase referrals to the in-home Falls Prevention The Falls and Fracture
from Falls Programme. SLA
Extend the Community Based Strength and Balance classes to
make 4,000 places available.
16Polypharmacy Increase general practices visibility of their enrolled patients An expert project group
on multiple medications, including by ethnicity. convened by the Clinical
Provide primary care with education about inappropriate Quality Education Team
and the Pharmacy
polypharmacy and encourage general practices to audit and
Service Level Alliance.
review patients on multiple medications.
Analyse polypharmacy patterns in Canterbury including by
age band and ethnicity, to guide any refinement of the
actions to improve performance.
Prompt general practice’s consideration of whether a
patient referred to the Falls Prevention Programme will
benefit from a review of their medications, and vice versa.
System Level Continue working with Pasifika Futures to identify and Canterbury DHB and
Measure implement innovative approaches to the funding and the PHOs
delivery of health services.
Establish a Pasifika focused wellbeing service that provides
holistic wrap-around care to Pasifika patients enrolled with
all general practices.
System Level Develop a model of restorative home-based care for rural Rural Health
Measure people to support discharge and/or restored function Workstream
following a period of illness.
Trial an observation service that provides advanced
assessment and treatment during a short term admission in
the Hurunui region.
17System level measure:
PATIENT EXPERIENCE OF CARE
CANTERBURY’S EXPERIENCE
Our priority for Patient Experience of Care is to facilitate optimal use of information from the in hospital and
primary care patient experience surveys to drive quality improvement.
In-Hospital Patient Experience Survey
Canterbury’s results from the four domain overall questions are consistently at or above the New Zealand
average results9.
Canterbury weighted average score NZ weighted average score out
Domain – Overall Question out of 10 for of 10 for
Q2 2016 – Q1 2018 Q2 2016 – Q1 2018
Communication 8.4 8.4
Coordination 8.5 8.4
Partnership 8.6 8.5
Physical & Emotional Well-being 8.7 8.7
Figure 2: Canterbury DHB Adult In-Hospital Survey Results (Q2 2016 – Q1 2018), Health and Quality Safety Commission
Over the last 12 months, work has been undertaken to increase the sample size and quantity of feedback
contributing to Canterbury’s results, with the local data (collected fortnightly) now included with the
national quarterly collection.
Primary Care Patient Experience Survey
Canterbury’s results from the four domains are at or above the New Zealand average results for the 12
months to Q1, 2018.
Canterbury weighted average NZ weighted average score out
Domain – Overall Question score out of 10 from Q2 2017 to of 10 for Q2 2017 – Q1 2018
Q1 2018
Communication 8.5 8.5
Coordination 8.6 8.6
Partnership 7.7 7.6
Physical & Emotional Well-being 7.9 7.8
Figure3: Canterbury Patient Experience Survey Results (Q2 2016 – Q1 2018), Health and Quality Safety Commission
In February 2018, 71 (62%) of Canterbury’s 115 general practices obtained feedback from their patients
using the Patient Experience Survey, up from 50 (42%) of 116 practices in February 2017. Canterbury’s
response rates to the survey aligns with national levels of response. A total of 1,142 (20%) of the 5,748
invited patients completed the survey in February 2018.
9
National Adult In-Patient Experience Results for Patients Treated in February 2018.
18Over the next 12 months the priority will be to increase the number of general practices accessing feedback
from their patients using the Patient Experience Survey. Alongside this, the survey response rate will be
monitored and analysis undertaken locally on whether any respondent groups are underrepresented. This
will guide ongoing work to increase the response rate and focus future efforts on accessing feedback from
specific population groups.
MILESTONE
In-Hospital Patient Experience Survey
With the ongoing construction of new facilities around existing infrastructure continuing to impact on patients’
experience of care, maintaining the inpatient survey results at 30 June 2019 will locally be considered a significant
achievement.
Primary Care Patient Experience Survey
In 2017/18 the number of general practices using the Patient Experience Survey to access feedback from the
enrolled population increased. In 2018/19 Canterbury’s focus will shift to using the data collected to inform and
drive quality improvement.
The shift to quality improvement is predominantly reliant on establishing effective processes that assist with
analyses that make this accessible to providers; translating data into information that creates a platform for people
to act upon. This makes setting a numerical measure that indicates progress on using data to drive quality
improvement difficult. Canterbury has selected a milestone to improve the score for the following two sub-
questions:
Care Plans: After a treatment or care plan was made were you contacted to see how things were going? Average
12 month score 4.9/10 improvement to 5.1/10 or more.
Medications: Were you told what to do if you experienced side effects? Average 12 month10 score 6.7/10
improvement to 6.9/10 or more.
It is acknowledged that the influences on patient experience are complex. It will take efforts sustained over time
to improve this and is likely to take more than the year of the improvement plan. The ongoing programme of
work will be focussed on quality improvement through education and administration.
CONTRIBUTORY MEASURES
IN-HOSPITAL SURVEY RESPONSE RATE
Outcome sought: An increase in the proportion of adults completing the in-hospital survey.
Rationale for selection: Canterbury’s Survey response rate was historically lower than the national rate.
Improvements over 2016 reflect the increased focus on capturing patients’ email addresses, allowing
communication of the survey to them. During 2017 Canterbury merged fortnightly survey data collected locally
10
The 12 month period of 01/04/2017 to 31/03/2018 was used to calculate the average score for both of the sub-questions. The 12 month period of 1st April
2017 to 31st March 2018 was selected to enable comparison to the same 12 month period in one year to assess progress.
19with the quarterly national collection to increase the number of respondents contributing to the results. While
this initially impacted the In-Hospital Survey response rate, work over the next 12 months to systematically
capture patients’ email addresses as a business as usual process is anticipated to improve response rates over
the long term.
Measure description: The proportion of adult
inpatients who complete the survey.
Numerator: The number of hospitalised patients
aged 15 years and over who provided feedback
via the adult in-patient survey.
Denominator: The number of hospitalised
patients aged 15 years and over who are
surveyed.
Data source: The Health, Quality and Safety
Commission.
IN-HOSPITAL ENGAGEMENT OF FAMILY / WHĀNAU IN PATIENT CARE
Outcome sought: Patients experience increased engagement between hospital staff and their family/whānau
in discussions about their care.
Rationale for selection: Canterbury’s In-Hospital Survey result in this supporting question has historically been
lower than the national rate. The Always Events project is providing a framework for Canterbury to explore
various stakeholder perspectives of patient care, and through this understand and address the contributors to
this result. In 2017/18 Canterbury commenced the second phase of the Always Events improvement project
that includes having the details of each patient’s contact person recorded and correct 100% of the time. This
work will continue over 2018/19 with consumer groups involved in guiding this activity.
Measure description: To better understand what
influences the score on the In Hospital Survey
result for the supporting question “Did the
hospital staff include your family/whānau or
someone close to you in discussions about your
care?”
Numerator: The sum of the weighted average
scores out of ten for this question response.
Denominator: The number of responders that
answered this question.
Data source: The Health, Quality and Safety
Commission.
PRIMARY CARE PATIENT EXPERIENCE SURVEY IM PLEMENTATION
Outcome sought: An increase in the proportion of general practices obtaining feedback from patients via the
Primary Care Patient Experience Survey.
Rationale for selection: PHOs continue to have an important role in working with general practices to increase
the number obtaining feedback from their enrolled populations. In 2018-19 Canterbury will continue to focus
20on general practice’s engagement with the survey. Alongside this, the Primary Care Patient Experience Survey
response rate will be monitored and an analysis undertaken on any cohort of respondents underrepresented.
Measure description: The proportion of
Canterbury general practices participating in
obtaining feedback from patients via the
Primary Care Patient Experience Survey.
Numerator: The number of general practices in
Canterbury participating in obtaining feedback
from patients via the Primary Care Patient
Experience Survey.
Denominator: The number of general practices
in Canterbury.
Data Source: Reported quarterly by the PHOs.
ACTIONS TO IMPROVE PERFORMANCE: PATIENT EXPERIENCE SURVEY
Contributory
Actions to Improve Performance Responsibility
Measure
In-Hospital Survey Confirm patient procedures for the collection, DHB Quality & Safety
Completion Rate verification and record management processes for staff
communicating with patients using email and SMS.
Continue to implement the hospital-wide procedure for
the collection of patient emails.
In-Hospital Continue with Phase Two of the national Always Events pilot DHB Quality & Safety
engagement of including working with consumers to: staff
family /whānau in Agree the terminology and process used to collect the
care. nominated or preferred contact person details; and
Clarify the role of the patient’s nominated contact
person.
Primary Care Patient Continue supporting general practice with the PHO Quality & Safety
Experience Survey implementation of the Patient Experience Survey. staff
Implementation Assist general practice teams to interpret and use Patient
Experience Survey results as part of their ongoing quality
improvement.
Response Rate Monitor the Primary Care Patient Experience Survey DHB and PHO Quality
response rate. & Safety Project
Undertake an analysis of the local Primary Care survey Group staff
respondents by age bands and ethnicity to identify any
population cohorts that are underrepresented and
establish baseline data on respondents.
In-Hospital & Identify a common theme across the In-Hospital and DHB and PHO Quality
Primary Care Patient Primary Care surveys and progress a local targeted & Safety Project
Experience Survey response. Group staff
Improvement in Work with a service alliance or expert groups to trial DHB and PHO Quality
Patient Experience using information from the In-Hospital and Primary Care & Safety Project
through increased Group
21utilisation of patient Patient Experience Survey to assist them in leading the
feedback. transformation of health care in a specific service area.
Quality Improvement Formalise a process for utilisation of the Patient DHB and PHO Quality
through an increase Experience Survey information in Canterbury’s education & Safety Project
in domain question programme and/or other education opportunities. Group staff
scores. Distribute two case studies that highlight the use of
survey results in change of general practice.
Promotion of the Patient Experience Survey (primary and
inpatient). Eg. Publication in Well Now.
22System level measure:
AMENABLE MORTALITY
CANTERBURY’S EXPERIENCE
Our priority is to continue to decrease the amenable mortality rate.
Canterbury’s Amenable Mortality age standardised rate for under 75-year-olds is trending downwards, and
remains consistently lower than the total New Zealand rate11. The national data provided by ethnicity indicates
that all Canterbury populations have rates lower than the New Zealand rates12.
A review of the longitudinal Amenable Mortality data by cause
of death identifies that a number of medical conditions
contributing to Canterbury’s Amenable Mortality Rate are
influenced by lifestyle choices; including activity levels, nutrition
and smoking. This affirms Canterbury’s selection of measures
linked to patients’ engagement in making positive lifestyle
choices. This focus on assisting people to better manage their
own health aims to improve people’s quality of life and reduce
mortality.
Alongside this lifestyle approach, further analysis of the
Amenable Mortality data is proposed during 2018/19, including
consideration of the ethnicity, rate, age of death, and magnitude
of trend, within each potentially amenable condition. It is
anticipated that this will better position Canterbury in
subsequent years to proactively target emerging diseases and
those that substantially shorten life. The analysis, to date, has
guided the selection of Canterbury’s contributory measures and
activities for 2018/19 as detailed below.
11National Minimum Data Set Amenable Mortality – Final Data to March 2015
12A standardised rate per 100,000 for Canterbury Pacific people is unable to be determined due to the small number of Canterbury Pacific people recorded in
this cohort.
23MILESTONE
The Canterbury Health System’s agreed milestone is to maintain the current downward trend over time in the
overall Amenable Mortality Rate. Applying this approach results in a milestone for the Amenable Mortality Rate at
30 June 2019 of 83 per 100,000 population.
CONTRIBUTORY MEASURES
The contributory measures selected include a focus on engaging people in managing their own health thereby
supporting them to make positive lifestyle choices. These measures and the underlying actions are seen as being
fundamental to reducing the impact of these lifestyle related conditions. In addition, two measures of smoking
prevalence are added as indicators of Canterbury’s progress towards being Smokefree in 2025.
INDICATORS OF HEALTH PROMOTING LIFESTYLE
Outcome sought: An increase in our population’s
adoption of positive lifestyle choices.
Rationale for selection: A range of services are
available to support our population with making
positive lifestyle choices. Increasing referrals to these
services is an indicator of our health system assisting
patients to navigate and access this support.
Measure description: Two measures; Green
Prescription referrals and enrolments in Te Hā –
Waitaha / Stop Smoking Canterbury service, have
been selected as indicators of people accessing a
wider range of lifestyle support services.
Note: From 1 October 2016 Canterbury’s stop
smoking service Te Hā – Waitaha, which has a
particular focus on priority populations was
implemented.
Data source: Provider data collected locally
Measure description: Alongside the Te Hā – Waitaha
Stop Smoking Services all Canterbury PHOs provide
their enrolled population with access to
comprehensive smoking cessation support. To
monitor all smoking cessation activity across
Canterbury, enrolments in the PHOs smoking
cessation services are included as a contributory
measure alongside the Te Hā – Waitaha activity.
Data source: Provider data collected locally
24MEASURE OF REGULAR SMOKERS IN CANTERBURY
Rationale for selection: Smoking is a major contributor to amenable mortality as a risk factor for many including
cancers, cardiovascular disease, stroke, chronic obstructive pulmonary disease, and sudden unexpected death in
infancy. Reducing smoking through interventions in the health system can therefore contribute to reduction in
amenable mortality. Two indicators of the proportion of Canterbury’s population that are smokers are included
below.
Outcome sought: A decrease in regular smokers to
5% prevalence in 2025.
Measure description:
The proportion of the Canterbury population who
are regular smokers.
Numerator:
For each ethnic group, regular smokers are people
who actively smoke one or more manufactured or
hand–rolled tobacco cigarettes per day.
Denominator:
Census usually resident population, by ethnicity.
Data source:
Statistics New Zealand Census 1996, 2006, 2013
data, with projections of the reduction in regular
smokers needed for the proportion of regular
smokers to be 5% for all ethnic groups by 2025.
Measure description: The proportion of the PHO
enrolled population aged between 15 – 74 years of
age that are recorded as a current smoker.
Numerator: The number of the PHO enrolled
population aged between 15 – 74 years of age
recorded as current smokers.
Denominator: The number of the PHO enrolled
population aged between 15 – 74 years of age.
Data source: Ministry of Health.
Note: This measure only captures people who are
enrolled in a PHO. As PHO enrolment for Māori is
lower (around 80-85% in recent quarters) than other
ethnic groups (around 94-97%) this measure may
under or over-represent current smokers who identify
as Māori.
25MOTIVATIONAL CONVERSATIONS SKILL DEVELOPMENT
Rationale for selection: Primary care worker’s ability to apply motivating conversation skills when communicating
with their patients will support patients to better manage their own health. Importantly this is also expected to
influence the conversion rate (from patient referral to participation) for specialist lifestyle support such as Green
Prescription. While initially this measure is focused on skill development in primary care, a shift to access
measures such as ‘referral to participation conversion rate’, is anticipated.
Outcome sought: Increase in primary care’s
application of motivational conversations skills.
Measure description: The quarterly and
cumulative number of primary care workers
(General Practitioners, Practice Nurses, Nurse
Practitioners, Pharmacists and other primary
health care professionals) participating in the
motivational conversations training is identified
as an indicator of this skill development.
Data Source: Local data reported by the PHO
quarterly.
IMPROVED PHYSICAL HEALTH FOR PEOPLE EXPERIENCING MENTAL HEALTH AND/OR
ADDICTION ISSUES
Rationale for selection: It is well known that people experiencing mental health and/or addiction issues tend to
have worse physical health outcomes than their peers. Equally Well13 is a programme of collaborative action to
address poor physical health outcomes and reduced life expectancy of people experiencing mental health and/or
addiction issues. In Canterbury, the Equally Well Committee has collated a list of physical health programmes
currently being offered for people experiencing mental health and/or addiction issues14. The resource is intended
for use by the sector to assist at-risk people access the appropriate supports they need to help improve physical
health and wellbeing. In addition, extended general practice consultations for free physical health visits for
people experiencing mental health and/or addiction issues (Equally Well Extended Consults), also contribute to
Canterbury’s implementation of Equally Well. The inclusion of this measure in the System Level Measures
Framework recognises, as indicated above, that people experiencing mental health and/or addiction issues have
worse physical health outcomes and reduced life expectancy overall. It is an indicator of the additional mental
health services being implemented in Canterbury to provide at-risk people with timely access to the right care.
13 https://www.tepou.co.nz/initiatives/equally-well-physical-health/37
14 http://www.comcare.org.nz/wp-content/uploads/2017/01/Equally-Well-Physical-Health-Programmes.pdf
26Outcome sought: Improved physical health for
people experiencing mental health and/or
addiction issues.
Measure description: The number of Equally
Well Extended Consults provided quarterly
across Canterbury.
Data Source: Local data reported directly from
the PHO quarterly.
Note: Equally Well Extended Consults
commenced as a pilot in December 2016.
ACTIONS TO IMPROVE PERFORMANCE: AMENABLE MORTALITY
Contributory Actions to Improve Performance Responsibility
Measure
Indicators of Healthy Refine Te Hā – Waitaha’s focus on priority populations Population Health and
Lifestyle including: Access Service Level
o Continued monitoring of enrolments and Alliance
outcomes for Māori, Pacific and pregnant women;
and
o Development of a targeted intervention for
youth, culturally and linguistically diverse (CALD)
communities and people with mental illness.
Motivational Deliver 20 Motivational Conversations training events Population Health and
Conversations Skill to 160 primary health care participants includes Access Service Level
Development General Practitioners, Practice Nurses, Pharmacists and Alliance
others.
Complete a comprehensive evaluation of the
Motivational Conversations training.
Improved Physical Embed consistent service criteria and specifications for Mental Health
Health for People Equally Well Extended Consults. Workstream
Experiencing Mental Establish standard reporting to enable further analysis
Health and/or of service users and refinement of the initiative.
Addiction
All Measures Continue advocating for a healthier environment with Population Health and
increased opportunity for both indoor and outdoor Access Service Level
physical activity and increased access to healthy food Alliance
choices.
Emerging Measure Continue work on the local pathway for bowel screening Project group within DHB
to identify if any changes in the early detection of risk specialist services
factors in younger population groups are required.
27 Establish a process to influence Māori and Pacific 35-44 PHO Education and
year olds in relation to cardiovascular disease risk later communications
in life.
28System level measure:
YOUTH ACCESS TO HEALTH SERVICES
CANTERBURY’S EXPERIENCE
Our clinically-led priority focus on the ‘Access to Preventive Services’ domain for 2018/19 is to improve adolescent
access to dental services.
In 2016 18,445 (61.3%) of the estimated 29,930 Utilisation of Dental Services by Adolescents Year 9 to 17 years
adolescents (School Year 9 to 17 years of age) in old
Canterbury accessed DHB funded dental services15. 80%
This utilisation rate is below the national average and
% of adolescents
60%
has changed little over the previous ten years.
In 2017/18 Canterbury sought to increase the 40%
engagement of youth in the service by improving the
20%
Community Dental Service transfer of care process.
For 2018/19 the focus will shift to strengthening the
0%
dental practices receipt of the Year 9 referrals via the
transfer for care process, and work with the dental Canterbury Total NZ Total
practices on their recall processes. In addition, factors
that influence youth’s engagement with the service will be explored through a series of focus groups.
While Canterbury’s Dental Service measure of youth access and utilisation while focused on a specific part of
preventive health services, it will be used to generate lessons that could be applied more generally to young
people’s perception of and willingness to use services.
MILESTONE
The Canterbury Health System’s agreed milestone is 63% of the adolescents from Year 9 to 17 years of age utilising
the Canterbury DHB funded Dental Service at June 2019. Note: The current delay in the reported data are barriers
to establishing a timely milestone for the ‘Access to Preventative Services’ domain.
CONTRIBUTORY MEASURES
DENTAL PRACTICE SERVICE – STRENGTHEN THE TRANSFER OF CARE & RECALL PROCESSES
Outcome sought: Dental practices holding a Combined Dental Agreement have a systematic process for
coordinating the Year 9 transfer for care and recalling adolescents.
Rationale for selection: Utilisation date shows that while adolescents are transferred to Dental practices in Year
9, adolescents are not utilising the services. Determining how Combined Dental Agreement holders manage
these transfers, including what systems and processes they have in place for recalling Adolescents annually for
their free oral health assessment is required. This will be followed by work to establish a more consistent
systematic approach to recalling Adolescents across Canterbury.
Measure description: Adolescents utilisation of the Adolescent Oral Health Service.
15 Policy Priority 12 data
29You can also read