Automatic Detection of Urban Features from Wheelchair Users' Movements
←
→
Page content transcription
If your browser does not render page correctly, please read the page content below
2019 IEEE International Conference on Pervasive Computing and Communications (PerCom)

          Automatic Detection of Urban Features from
               Wheelchair Users’ Movements
                            Gabriele Civitarese, Sergio Mascetti, Alberto Butifar, Claudio Bettini
                                                   Università degli Studi di Milano
                                            Dept. of Computer Science, EveryWare Lab
                                                             Milan, Italy
                                   {gabriele.civitarese, sergio.mascetti, claudio.bettini}@unimi.it
                                                  alberto.butifar@studenti.unimi.it

   Abstract—Providing city navigation instructions to people with        To address these issues we are currently developing the
motion disabilities requires the knowledge of urban features like     Moving Wheels navigation system that aims at supporting
curb ramps, steps or other obstacles along the way. Since these       mobility of people with disabilities by guiding them on routes
urban features are not available from maps and change in time,
crowdsourcing this information from end-users is a scalable and       that are personalized according to their needs. For example,
promising solution. Our preliminary study on wheelchair users         consider a user with an electric wheelchair that is unable to
shows that an automatic crowdsourcing mechanism is needed,            climb steps; for this user, the system will compute routes
avoiding users’ involvement.                                          where curb ramps are available.
   In this contribution we present a solution to crowdsource             While the problem of offering personalized navigation in-
urban features from inertial sensors installed on a wheelchair.
Activity recognition techniques based on decision trees are used to   structions to people with disabilities has been addressed before
process the sensors data stream. Experimental results, conducted      in the literature (see e.g., [2], [3]), and can be adapted to
with data acquired from 10 real wheelchair users navigating in        this application, a critical challenge in Moving Wheels is to
an outdoor environment show that our solution is effective in         acquire detailed information about urban features in the form
detecting urban features with precision around 0.9, while it is       of obstacles (e.g., a step) and accessibility elements (e.g., a
less reliable when classifying some fine-grained urban feature
characteristics, like a step height. The experimental results also    curb ramp). This paper focuses on this challenge and presents
present our investigation aimed at identifying the best parameters    a solution to automatically recognize urban features from the
for the given problem, which include number, position and type        movement of the users themselves: while a user moves in the
of inertial sensors, classifier type, segmentation parameters, etc.   environment on a wheelchair (e.g., climbs up a ramp) her/his
   Index Terms—Motion disabilities, activity recognition, urban       mobile device acquires movement information from inertial
navigation
                                                                      sensors and automatically detects the urban feature (i.e., the
                      I. I NTRODUCTION                                curb ramp). As future work, we intend to design a system
   Modern navigation systems compute the route depending on           to automatically share this information so that it can be used
the user’s current mean of transport. These systems can com-          when computing the route for other users. This is a form of
pute the route for users moving by cars, public transportation,       data crowdsourcing that does not require user intervention.
foot and others. However, there is no specific support for users         This paper has three main contributions. First, it describes
with limited mobility, like wheelchair users. To the best of our      Moving Wheels, focusing on the definition of the novel
knowledge, only Google Maps provides some support in terms            and challenging problem of detecting urban features from
of information about accessibility in public transportation and       wheelchair movements. Second, it illustrates the technical
limited to some cities1 . While this is surely a useful service       solution to recognize urban features that includes data acquisi-
for some users, it addresses a small part of the overall mobility     tion, labeling, features extraction, and classification with a su-
problem by wheelchair users [1].                                      pervised machine learning technique. Third, the paper presents
   A major problem, that emerged during an interview with             the results of an extensive experimental evaluation of the pro-
five wheelchair users living in Milan (Italy), is that a person       posed technique based on data acquired from wheelchair users
moving on a wheelchair does not know in advance which                 in an outdoor environment. Results show which algorithms
obstacles she/he will face along a route. For example, even if        and which parameters provide the best accuracy, but most
curb ramps are commonly available at intersections, sometimes         importantly they validate the solution with recognition rates
they can be missing or occluded by road work. According to            higher than 80% for several important urban features.
interviewed users, these problems are so frequent and their                          II. T HE Moving Wheels SYSTEM
effects are so frustrating that they declare to be reluctant to
move along unknown routes.                                              Moving Wheels is a context-aware assistive navigation sys-
                                                                      tem being developed by the EveryWare Lab in Milan with
  1 https://goo.gl/f5BeFc                                             two main objectives: first, to provide navigation instructions

      978-1-5386-9148-9/19/$31.00 ©2019 IEEE                      166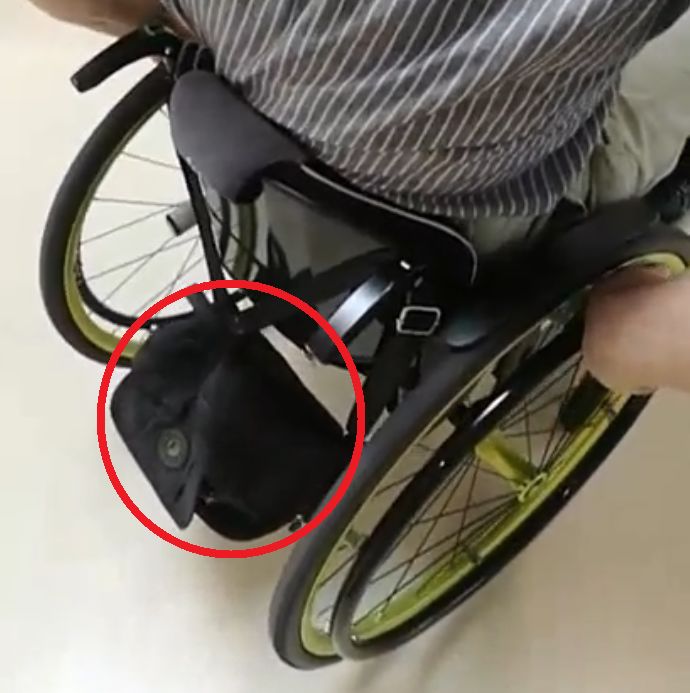
2019 IEEE International Conference on Pervasive Computing and Communications (PerCom)

to people with disabilities guiding them along routes that are            ramps) that is needed to populate the graph. We are currently
personalized according to their needs. To compute these routes,           considering these sources:
Moving Wheels needs detailed information not only about the                  • existing geo-referenced data stores, including public (e.g.,
road network but also about the urban features that may be an                   traffic lights from open street map) and private ones (list
obstacle for the navigation. The acquisition of this information                of curbs ramps from the municipality);
is the second objective of Moving Wheels.                                    • data annotated by human actors, such as employees,
   A mobile client, similar to a traditional navigation app,                    volunteers or end-users, that visit a place either physically
guides end-users from a start position (generally their current                 or virtually (e.g., looking at Google street view images);
position) to a target destination with a main difference with                • data automatically extracted from geo-spatial image
respect to other solutions: it allows end-users to finely tune                  databases (e.g., Google street view), adopting computer-
preferences with respect to classes of urban features depending                 vision techniques, similarly to those proposed in [4].
on their (dis)abilities. For each class, the user can specify                Each of the above solutions has advantages and limitations
whether the urban features in that class should be avoided                with respect to a number of factors, including cost (e.g.,
or not. A third option is available as well: “avoid if possible”          manual annotation by employees can be costly), scalability
means that the user is able to deal with that urban feature, but          (e.g., acquiring data from different municipalities incurs into
this costs some effort. Consider the following example:                   scalability issues), reliability (e.g, the technique proposed in
  •    small-step-up: avoid if possible                                   [4] correctly identifies 93% of zebra crossings), maintenance
  •    small-step-down: no problem                                        and types of urban features that can be detected (e.g., some
  •    medium-step-up: avoid                                              features, like zebra crossings, are easier to detect with com-
  •    medium-step-down: avoid if possible                                puter vision, while others, like the inclination of a curb ramp,
                                                                          are harder to detect).
   The above preferences capture the fact that the user is not               This contribution focuses on crowdsourcing data from end-
able (or willing) to climb up steps of medium height. Vice                users (i.e., people with disabilities). This approach has many
versa, descending a short step is not a problem for this user.            advantages: it is scalable, costless, and it keeps information
Also, the user would prefer to avoid to climb down steps of               up to date. Since our studies revealed that these users are not
medium height and to climb up short steps.                                really keen to manually enter data or have difficulties doing
   The Moving Wheels service performs the route computa-                  so, in this paper we show how Moving wheels could collect
tions requested by the mobile client. When computing a route,             data about urban features by using sensors, without end-user
Moving Wheels will avoid all urban features marked as “avoid”             intervention. For example pedestrian crossings can be detected
and will try to balance the route length with the number of               from the camera (e.g., a wearable one) and acoustic traffic
urban features marked as “avoid if possible”. For example,                signals can be detected from the microphone. We currently
consider two alternative routes: one is 200m long with one                focus on urban features that can be detected with inertial
urban feature marked as “avoid if possible” while the other is            sensors mounted on a wheelchair, which include steps, ramps
1.5km with no urban features marked as “avoid if possible”.               and rough roads.
In this case the system will automatically suggest the former
route, as it is much shorter. In other cases the system may                                 III. P ROBLEM ANALYSIS
automatically suggest a slightly longer route, if it has less               During the analysis on the Moving Wheels system we
features marked as “avoid if possible”. When there is not a               conducted informal interviews with two set of users: those
stark difference between two or more routes, the system allows            using a electric wheelchair and those using a traditional one.
the user to select his/her preferred route.                               The interviews were aimed at better understanding the mobility
   On the server side Moving Wheels represents the road                   problems of wheelchair users. We report in the following some
network as a directed graph in which each edge is labeled                 observations that are relevant to this contribution.
with the urban features that a user will encounter by moving
                                                                          A. Mobility
along that edge, as exemplified in Figure 1.
                                                                             There are basically two classes of wheelchairs used for
                                                                          urban mobility2 : electric wheelchair and traditional ones. The
                                                                          latter can be propelled in three ways: (a) self-propelled when
                                                      curb step           the user sitting on the wheelchair use his/her arms to move the
Sidewalk                                          (   ramp ; up
                                                      down
                                                                  (       wheels, (b) attendant-propelled, when a caregiver pushes the
Road         A                B              A                        B   wheelchair and (c) electric-propelled in which an electric de-
                                                                          vice is attached to the wheelchair to provide motion. Figure 2
                                                                          shows some examples of wheelchairs.
                 Fig. 1. Road network representation.                        Generally, electric wheelchairs are used by people who are
                                                                          not able to use a traditional wheelchair (e.g., tetraplegics),
  A major challenge in Moving Wheels is how to acquire                      2 A number of other models are used for indoor use (e.g., in the hospitals),
the knowledge about the relevant urban features (e.g., steps,             sport and outdoor.

                                                                      167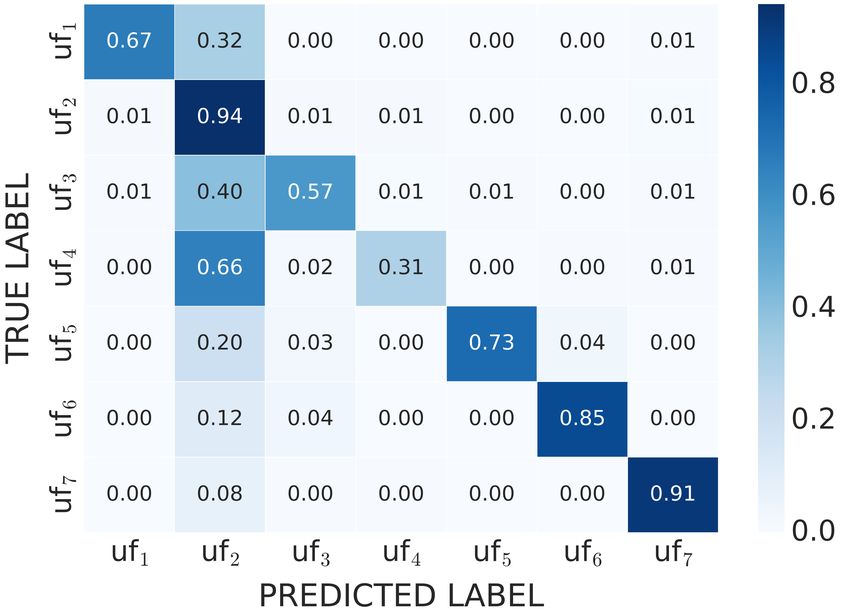
2019 IEEE International Conference on Pervasive Computing and Communications (PerCom)
(a) Electric wheelchair. (b) Self-propelled traditional (c) Electric-propelled traditional (d) Sensors position.
wheelchair. wheelchair.
Fig. 2. Wheelchairs: types, propulsion modes and sensors position.
while traditional wheelchair are used by people who are able
to use a self-propelled traditional wheelchair and that possibly
attach an external electric device when really needed.
The ability to move in an urban environment and to face
obstacles strongly depends on the wheelchair type, on how it
is propelled and on the user’s abilities. For example, climbing
up a steep ramp is generally not a problem with electric
wheelchair, while it can be hard for a self-propelled wheelchair
if the user is not well trained. Vice versa, climbing up a step
can be impossible with electric wheelchair, while it is gen-
erally easier with a electric-propelled traditional wheelchair, Fig. 3. Sensor data acquired from a smartphone stored in a bag.
or with a self-propelled wheelchair if the user is well trained.
In particular users of traditional wheelchair learn to balance
themselves on the rear wheels when facing some obstacles: moves and the smartphone inside the bag moves and rotates
this position, called balancing, allows them to climb up and in all directions.
down from steps and is frequently used in other situations in For this reason the technique proposed in this contribution is
which it is preferable that the front wheels do not touch the designed to use data acquired from sensors that are attached
ground, like when moving on a rough road. to the wheelchair frame and whose position and orientation
In this paper we focus on detecting urban features from self- are known. We believe that this setting is realistic, since we
propelled traditional wheelchair. We believe that the method- expect that smart wheelchairs, equipped with inertial sensors,
ology and technique we propose in this paper can be easily will become common in the next years [5].
adapted to the other cases. C. The urban features of interest
The main focus of the interviews was to understand the
B. Sensor data acquisition challenges that arise when moving with a wheelchair in
Since smartphones include inertial sensors, they could be a urban environment. The following environmental features
considered as a data source. For this reason during the in- emerged to be relevant for wheelchair users:
terview we asked the participants where they usually keep • steps: their height and whether they should be climbed
their smartphone while moving on the wheelchair. It emerges up or down;
that there are heterogeneous habits: some people using electric • ramps: their inclination and whether they should be
wheelchair have a holder (like the tablet in the red circle in climbed up or down;
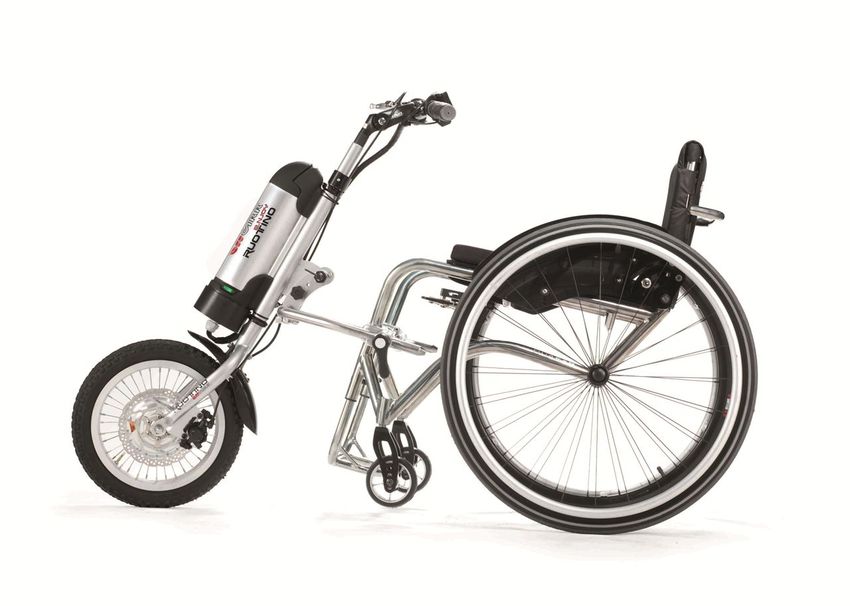
Figure 2a), vice versa a common choice among traditional • pavement: whether it is flat or inclined (up or down and
wheelchair users is to store the smartphone in a bag positioned how much) and whether it is a smooth pavement, asphalt
on the rear side of the wheelchair back (like in Figure 2b). or dirt road;
Our preliminary results show that when the smartphone is • bumps and gutters: their height;
not firmly attached to the wheelchair frame (e.g., when it • movement aids: like lifts and stairlift.
is stored in the bag) the collected inertial data is noisy and Based on the observations emerging from the interviews we
recognition is harder. For example, consider Figure 3 that derived the hierarchical set of labels shown in Figure 4. Each
shows accelerometer data recorded by a smartphone stored label corresponds to a user’s action that discloses the presence
in a bag while the user is moving on a smooth surface. We of a urban feature. For example obstacle-step-up-M
can observe that, while the user is only accelerating along the indicates that the user climbed up a step of medium height.
frontal direction, spikes are observable on all three axes. This By knowing the user’s position and direction at that time we
is due to the fact that the bag keeps swinging while the user can recognize the urban feature (the step), its characteristics
168
2019 IEEE International Conference on Pervasive Computing and Communications (PerCom)

                                                                                                root

            still                                  obstacle                                                           gait                                      movement aid

           gutter                    step                 bump                     ramp       turnabout       plain        ascending        descending          lift   stairlift

       H     M          L       up          down     H        M       L       up      down         S      A    D      LS      ...      HD      LS        ...   HD

                    H       M    L          H   M     L           H       M    L     H    M    L

Fig. 4. Labels’ hierarchy as emerging from the analysis. H=High, M=Medium, L=Low, S=Smooth, A=Asphalt-like, D=Dirt road, LS=Low and Smooth, etc.

(medium height) and its orientation (whether it should be                                          acquiring data from various inertial sensors. Data acquired
climbed up or down when following the same route as the                                            from these sensors is pre-processed in three main steps: data
user).                                                                                             cleaning, fusion and segmentation.
   There are two labels that are exceptions as they do not dis-                                       A common technique for data cleaning is data smoothing,
close a urban feature: still and turnabout. The former                                             which aims at reducing the intrinsic noise of inertial sensor
indicates that the user is not moving, so there is no urban                                        measurements [6]. Many techniques have been adopted in
feature to detect. The latter instead does not disclose an exact                                   the literature (e.g., median filter). However, in our domain
urban feature but can be used to infer that the user cannot                                        it emerged that data smoothing may actually decrease the
overcome an obstacle and hence can lead to infer a generic                                         recognition rate. We believe that the reason is that some
accessibility issues when the same behaviour is observed by                                        obstacles are crossed in short time and they result in peaks
several users in the same location.                                                                in sensor measurements. Smoothing those peaks removes im-
   The first level of labels contains: obstacle, gait,                                             portant information that is needed to correctly detect obstacles.
movement aid and still. Obstacle represents events with                                            Hence, in our application cleaning has been mostly focused
a short temporal duration (intuitively between a fraction of                                       on identifying unreliable sensors and real outlier data.
a second and few seconds) while the other events have a                                               Data fusion consists in temporally aligning the data streams
longer duration. We discretize step, bumps and gutter heights                                      originated by each sensor. We achieve this by acquiring sensor
as well as ramps inclination into three classes (high, medium,                                     data from a single gateway (e.g., a smartphone in our case)
low). Similarly, we use three classes for surface smoothness:                                      and timestamping the data with the gateway clock.
smooth, asphalt-like and dirt road. When the user is moving                                           After data fusion, sensor data is segmented using a temporal
along an ascending or descending path, we aim at classifying                                       sliding window approach. The application of this method is
all combinations of inclination (high, medium, low) and of                                         influenced by two parameters: window temporal length l in
surface smoothness (smooth, asphalt-like and dirt road).                                           seconds, and windows overlap factor o in percentage. Despite
                                                                                                   being a quite standard and simple segmentation technique, it
           IV. AUTOMATIC DETECTION TECHNIQUE                                                       proved to be effective in our application domain. Figure 5
   In order to recognize the urban features of interest, we use                                    shows an example of data fusion and segmentation with l =
machine learning techniques adapting to our specific domain                                        2sec and o = 50%.
an approach widely used for sensor-based human activity
recognition. The current implementation of our method relies                                       B. Segments labeling
on batch learning: data are first acquired from wheelchair                                            The wheelchair movements (we also called them activities)
users, then manually annotated with the ground truth, and                                          that we need to detect have different duration, from a fraction
finally used to train a supervised classifier. Once the recogni-                                   of a second for obstacles to several tens of seconds, for gait or
tion model is trained, our system can detect wheelchair users’                                     still. Figure 6 shows an example: a step is performed between
actions in real-time.                                                                              two gait activities.
   Section V describes how we collected and annotated sensors                                         As usual for supervised learning approaches we faced the
data. In the following of this section we describe the main                                        problem of how to assign a ground truth label to each segment.
steps of the data management process that enables supervised                                       A possibility is to use very short segments, so that each
classification.                                                                                    one temporally overlaps a single activity. However, as we
                                                                                                   experimentally show, using very short segments results in
A. Data pre-processing                                                                             poor classification quality. On the other hand, by using longer
   The user’s wheelchair is equipped with several devices,                                         segments it is possible that a user performs more than one
placed in different positions with predefined orientation, each                                    activity during a single segment, as shown in Figure 6 (see the

                                                                                              169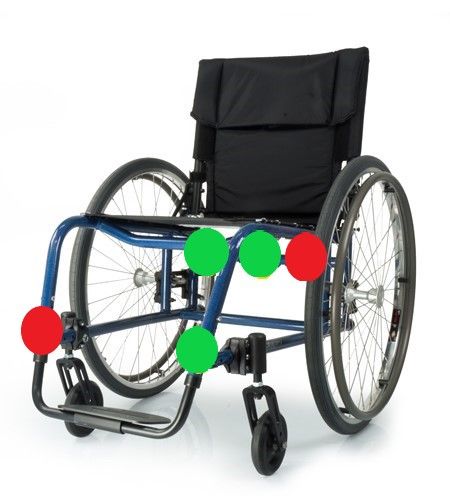
2019 IEEE International Conference on Pervasive Computing and Communications (PerCom)

                                                  segment 2                            •  For all axes of a given sensor: magnitude.
                                     segment 1                 segment 3
                                                                                     Overall, we compute 46 features for each 3-axis inertial sensor.
                                1                                                    For instance, considering that in our experimental setup we
                                                                                     used three devices with three 3-axis sensors each, a total of
DEVICE 1 - ACCELEROMETER - X    0                                                    46 × 3 × 3 = 414 features were used.

                                -1                                                   D. Supervised Classification
              …….

                                1                                                       In order to classify urban features, we rely on supervised
                                                                                     machine learning algorithms. We experimented with state-
   DEVICE 5 - GYROSCOPE - Z     0                                                    of-the-art generative and discriminative classifiers including
                                                                                     Multinomial Naive Bayes, SVM, Random Forest and Multi-
                                -1                                                   layer Perceptron. As we show in the experiments, Random
                                             1          2      3       4   seconds   Forest resulted to have the highest recognition rate.
                                                                                        Given that our set of labels is naturally represented as
                          Fig. 5. Segmentation.                                      a hierarchy, we designed and implemented a hierarchical
                                                                                     Random Forest classifier [8]. In this approach a separate
                                GAIT             STEP         GAIT
      GROUND TRUTH
                                                                                     classifier is used for each internal node of the hierarchy tree.
                                                                                     A segment is first classified by the root classifier as belonging
                               GAIT              GAIT          GAIT                  to one of the first level labels (for example it is labeled as
     SEGMENTED DATA
    MAJORITY APPROACH                                                                obstacle), and then considered by a specialized classifier in
                                                                                     order to get a label from the second level (for example as
                               GAIT              STEP          GAIT
     SEGMENTED DATA                                                                  bump), and further descending the hierarchy until eventually
    PRIORITY APPROACH
                                                                                     being assigned a label corresponding to a leaf (for example
                      Fig. 6. Labelling approaches.                                  a high bump). We compared this classifier with a flat version
                                                                                     with experimental results reported in Section VI.

second segment). In this case a solution is to label a segment                                       V. T RAINING DATA ACQUISITION
according to the prevalent activity for that segment (the one                           In order to validate our method, we acquired a training set
that is performed more than any other during the segment                             of urban features collected by 10 actual wheelchair users that
duration). We call this the majority approach and an example                         volunteered to participate in our experiments. In this section
of its application is shown in Figure 6.                                             we show our experimental setup, the acquisition protocol and
   The majority approach turned out not to be effective in our                       we describe the collected dataset.
domain due to the fact that obstacles are generally crossed in
a very short time (e.g., half a second). Indeed, since segments                      A. Experimental setup
have a length in the order of seconds, none of them is labeled                          For the sake of this work, we used MbientLab’s Meta-
as an obstacle (as in Figure 6). To address this issue we adopt                      MotionR devices3 . A MetaMotionR is a multi-sensor board
a priority labeling approach. The intuition is that obstacles are                    which communicates through Bluetooth Low Energy. Among
particularly relevant in our domain, so we give them an higher                       the several sensors mounted on the board, we use data from
priority when labeling a segment: if a segment overlaps with                         accelerometer, gyroscope and magnetometer. As Figure 2d
an obstacle at least for a given percentage p of the segment                         shows, we placed 5 of those devices in different wheelchair’s
length, then we label the segment as obstacle, independently                         positions: front-left, front-right, rear-left, rear-right and rear-
from the other labels. This is shown in Figure 6: the second                         center. Due to technical problems with the devices we col-
segment has an overlap of 25% with a step (a type of obstacle),                      lected complete data recordings only from three of them (front-
so, assuming p = 25%, the segment is labelled with step.                             left, rear-right and rear-center). Partial recording from the
C. Feature Extraction                                                                other two sensors was discarded during data cleaning. Each
                                                                                     device streams sensor data to a smartphone at 25Hz. The
   From each segment, we extract several statistical features
                                                                                     smartphone stores this information using the MetaBase appli-
which are widely adopted in the literature for activity recog-
                                                                                     cation4 assigning to each incoming sensor data the smartphone
nition from inertial sensors [7]. In particular we use the
                                                                                     timestamp. Moreover, we also collected sensor data produced
following features:
                                                                                     by a different smartphone placed on a bag hanging on the
   • For each axis of each sensor: minimum, maximum, dif-
                                                                                     wheelchair back (see Figure 2b). Since the data collected by
     ference between maximum and minimum, mean, standard                             this second smartphone turned out to be highly noisy, we also
     deviation, variance, median, root mean square, kurtosis,                        ignored this data stream in the following analysis.
     skewness, zero crossing rate, number of peaks and energy;
   • For each pair of axis of a given sensor: Pearson correla-                         3 https://mbientlab.com/product/metamotionr/

     tion and coefficient cross correlation                                            4 https://mbientlab.com/tutorials/Apps.html

                                                                                170
2019 IEEE International Conference on Pervasive Computing and Communications (PerCom)

B. Data acquisition                                               pulling himself with the handrail. Finally, we also excluded
   Experiments were conducted at Spazio Vita, a Non Profit        from the dataset all the occurrences of the urban feature step up
Organization (NPO) based in Milan, Italy, that supports people    high, which was performed only 4 times in the whole dataset
with motion disabilities. This NPO owns an outdoor training       due to its intrinsic difficulty.
area which includes common urban obstacles, like steps,
ascents, etc. The training area is closed to traffic, so that     D. Dataset description
wheelchair users can practice moving in a urban environment
without hazards.                                                     Not all urban features identified in Section III-C are avail-
   Data collection involved 10 users of traditional wheelchairs   able in the environment where we conducted the experiments.
that self-propelled the wheelchair during the experimental        In particular the only available obstacles are the steps, while
session. For each individual, the data acquisition process        there are no bumps or gutters. There are indeed some ramps,
includes the following steps: a) take a video where the           but they are about 8 meters long, so we do not classify them
individual expresses the consent for data acquisition and         as obstacles, which should take a short time (e.g., a curb ramp
analysis, b) MetaMotionR are deployed on the wheelchair,          is an obstacle) to cross, but instead we classify them as gait-
c) the MetaBase application on a smartphone is started in         ascending or gait-descending. The urban features that we have
order to collect sensor data, d) the user crosses a predefined    been able to collect are represented in Figure 7.
route while being video recorded. The route consisted in going
on a dirt road, going on asphalt, being still, doing turnabout,                                          root
going up and down on inclined roads with different slopes
(high, medium and low), and going up and down on steps                        first level
with different heights (high, medium and low).                                      step                 still                    gait
   During the data acquisition we noticed a high variability of
                                                                                    intermediate level
ways of crossing urban features between different users. For
instance, not all users were able to go up or down all steps         up       down              turnabout        plain       ascending descending
(e.g., going up a high step is difficult for many users). More-
over, some users cross difficult urban features (like descents,
                                                                    M     L     H      M    L               S    A       D    M      L   M    L
dirt roads and steps) in the balancing position, while others
                                                                                                         leaf level
do not. We also noticed that the speed at which wheelchair
users cross urban features is highly variable, mainly based on
                                                                  Fig. 7. Hierarchy of labels collected during experiments. H=High,
the disability and health conditions of the subject.              M=Medium, L=Low, S=Smooth, A=Asphalt-like, D=Dirt road.
   For each individual we recorded between 8 and 12 minutes
of data. The overall time required to acquire data from each
user was between 20 an 30 minutes, mainly due to the time
                                                                                            TABLE I
required to deploy the devices on the wheelchair. In the             OVERALL NUMBER OF INSTANCES AND SECONDS OF SENSOR DATA
following we call session the data acquired from an individual.                       RECORDED FOR EACH URBAN FEATURE

C. Data annotation and cleaning                                                   Urban Feature                   #instances       #seconds
                                                                                  Step down high                       9               8s
   Data annotation was performed offline, thanks to video                       Step down medium                      18              14s
recordings. In order to synchronize sensor data with video                       Step up medium                       14              15s
                                                                                    Step up low                       34              27s
recordings we collected the sensors data from the same
                                                                                  Step down low                       43              31s
smartphone used to record the experiments and we used an                      Gait plain on dirt road                 16             218s
application that prints the device time on each frame5 . Actual           Gait descendent medium slope                48             230s
data annotation was performed using Anvil [9], a free video               Gait ascendant medium slope                 43             248s
                                                                           Gait descendent low slope                  54             252s
annotation tool originally developed for gesture recognition.                        Turnabout                       119             295s
   As we mentioned above, many activities annotated with                    Gait ascendant low slope                  53             304s
a given label are actually performed in different ways (i.e.,                    Gait plain indoor                    27             362s
with different physical movements). In general we expect our                            Stop                          63             628s
                                                                            Gait plain on asphalt-like               368            2821s
system to be robust against variability and indeed we have
several examples of actions performed in different ways in our
dataset. However we removed a few seconds of data recording          Table I shows some details of the collected data. From this
in those cases in which a given activity is performed with a      table emerges that the dataset is very unbalanced. This is due
physical movement that is not repeated in the dataset. There      to the fact that many users were not able to cross specific urban
are just two of these cases: i) a user descended a step while     features (e.g. high/medium steps) and those who were actually
moving backward and, ii) a user climbed up a step while           able could not repeat them several times, as these activities are
                                                                  physically demanding. Moreover, the time required to cross an
 5 http://www.timestampcamera.com/                                obstacle like a step is often very short (e.g., half a second).

                                                              171
2019 IEEE International Conference on Pervasive Computing and Communications (PerCom)
VI. E XPERIMENTAL EVALUATION TABLE III
C LASSIFICATION RATE AT THE MID - GRAINED LEVEL (still IS OMITTED )
A. Evaluation methodology
We measure the quality of our urban feature detection Class Precision Recall F1 score
Step-up 0.847 0.727 0.783
system by analyzing the confusion matrix and computing the
Step-down 0.892 0.847 0.869
standard metrics of precision, recall and F1-score. We adopt a Plain-gait 0.807 0.945 0.871
leave-one-subject-out cross validation method: at each fold we Gait-ascending 0.833 0.568 0.675
use nine sessions (one for each individual) to train our model, Gait-descending 0.737 0.308 0.434
using the remaining one to test it. Gait-turnabout 0.806 0.669 0.731
Since we consider a hierarchy of labels, we are interested in
investigating the quality of our classifier at different levels of
our hierarchy. Indeed, while it would be desirable to accurately
detect urban features at the finest granularity (e.g., distinguish
a high, medium and low step-down), we are also interested in
the recognition rate for coarser-grained urban features, like, for
example, whether an obstacle is present or not, or whether a
step has been climbed up or down. For this reason we identify
three groups of nodes in our hierarchy as shown in Figure 1:
coarse-grained, mid-grained and fine-grained.
B. Configuration yielding the best results
We tested various classifiers and a number of parameters
trying to identify those yielding the best results. While the
results of these tests are illustrated later in this section, the
configuration that gave the best overall results is the following:
Fig. 8. Confusion matrix at the mid-grained level. Indexes: uf1 =gait-
• a flat Random Forest classifier; turnabout, uf2 =gait-plain, uf3 =gait-ascending, uf4 =gait-descending,
• all available sensor data (3 devices, each with accelerom- uf5 =step-up, uf6 =step-down, uf7 =still.
eter, gyroscope and magnetometer);
• a window size of l = 2sec and overlap o = 50%;
• a priority approach to segments labelling with p = 20%;
granularity, the classifier is often not effective in distinguishing
two sibling labels. Consider for example step-down: while this
In the following of this section we report the results obtained label is recognized with high precision and recall, its child
with this configuration, unless differently specified. step-down-medium is not; this is due to the fact that in about
Considering the detection of coarse-grained activities (see 50% of the cases step-down-medium is actually classified as
Table II) the classifier is overall reliable, with particularly good step-down-low.
results for the detection of the gait and still activities. At
a finer level (see Table III), results present large differences TABLE IV
among the various activities. Indeed, while the classifier can C LASSIFICATION RATE AT THE FINE - GRAINED LEVEL (still AND
generally correctly distinguish a step-up from a step-down, it is gait-turnabout ARE OMITTED )
much less reliable for gait-ascending and gait-descending. The
Class Precision Recall F1 score
reason, shown in the confusion matrix reported in Figure 8, is
Step-up-medium 0.688 0.379 0.489
that both labels are frequently classified as gait-plain. More Step-up-low 0.725 0.806 0.763
generally, from the confusion matrix it emerges that all the Step-down-high 0.737 0.737 0.737
activities are sometimes confused with gait-plain. We believe Step-down-medium 0.500 0.371 0.426
that this is due to the fact that the dataset is unbalanced and Step-down-low 0.647 0.663 0.655
gait-plain has a much larger support with respect to the other Gait-plain-smooth 0.621 0.254 0.360
activities (see Table I). Gait-plain-asphalt-like 0.709 0.935 0.806
Gait-plain-dirt-road 0.625 0.320 0.423
Gait-ascending-medium 0.803 0.677 0.735
TABLE II
Gait-ascending-low 0.750 0.408 0.529
C LASSIFICATION RATE AT THE COARSE - GRAINED LEVEL .
Gait-descending-medium 0.590 0.385 0.466
Class Precision Recall F1 score Gait-descending-low 0.931 0.172 0.290
Obstacle 0.893 0.814 0.851
Gait 0.978 0.986 0.981
Still 0.935 0.912 0.923 C. Effects of parameters and alternative configurations
As observed in Section IV, we considered two segment
Considering fine-grained activities (Table IV), the classifier labelling techniques. Figure 9a shows a comparison of the
is only partially reliable. This is due to the fact that, at this majority and priority labeling techniques for different values
1722019 IEEE International Conference on Pervasive Computing and Communications (PerCom)
(a) Majority vs priority segment labeling varying l. (b) Impact of parameter p. (c) Impact of window size.
Fig. 9. Effects of parameters and alternative configurations.
of the segment length. We can observe that, for small values of Figure 10c shows the performance of different classifiers. A
l (in the order of half a second), the two techniques provide flat random forest provides the best result, in term of average
almost identical results. For larger values, the performance F1 score, both among coarse and fine grained labels. Given the
with the majority approach rapidly decreases, because the hierarchical structure of our labels, we expected a hierarchical
number of segments labeled as obstacle decreases. Vice versa, classifer to outperform the others, but actually hierarchical
with the priority approach, segments of about 2s give better random forest resulted to have almost the same performance
performance. (but slightly worse) than the flat version. The same holds for
The priority approach depends on the parameter p. Fig- multinomial naive bayes. Two classifiers provide clearly worse
ure 9b shows that the detection rate of still and gait is basically results: support vector machines and multi-layer perceptron.
not affected by p. Instead, step detection increases between 0% We believe that this is due to the relatively small training set.
and 20% and then it rapidly decreases. This is due to the fact Considering that the training set is highly unbalanced, we
that, for larger values of p, the priority approach is similar to expected that a data balancing technique could improve the
the majority approach. performance. In particular, we experimented a) Random Forest
Figure 9c shows how the recognition rate is affected by the with balanced class weights and b) well-known techniques to
window size l at different levels of our hierarchy. The best balance the dataset with both oversampling and undersampling
results are obtained with l = 2. Indeed, for lower values the [10]. In both cases, unexpectedly, the balancing techniques did
performance rapidly decreases at all three levels. Instead, for not improve the recognition rate.
values of l larger than 2 the performance degrades especially
VII. R ELATED WORK
for the mid-grained and fine-grained level.
Our experiments show that the overlap factor o has little A number of commercial solutions have been proposed to
impact on the recognition rate at all levels. Slightly better detect urban features from images e.g., Mappillary6 or to
results are achieved with o = 50% and hence we used this support people with disabilities during navigation. Similarly
value. Still, since the classifier exhibits similar performance to Moving Wheels, some of these services provide person-
with o = 0%, this value can be also considered as a possible alized routes. The main limitation of these systems is that
choice, as it minimizes the computational costs because for they cover relatively small regions; for example Route4U 7
smaller values of o less segments need to be processed. can only provide navigation instructions in some parts of
Figure 10a shows that the combination of all the available Budapest (Hungary) while Kimap8 only covers a few small
devices (front-left, rear-center and rear-right) gives the highest towns in Italy. This shows that the main challenge with these
recognition rate. In case a single device is available, it should applications is the large scale collection of geo-referenced
be positioned on the rear-center. If two are available, the information, and indeed our contribution is aimed at mitigating
best performance is obtained by positioning one on the rear- this problem.
center and the other on the front-left. Indeed this configuration Considering the scientific literature, four main challenges
actually gives almost the same results as using three devices. have been addressed in the field of navigation for people
Considering the contribution of specific sensor types (see with disabilities: (a) to compute the user’s position with high
Figure 10b), the best results are obtained by using all the precision [11]–[14], (b) to compute personalized navigation
three we have considered, i.e., accelerometer, gyroscope and instructions [2], [3], (c) to effectively convey them (e.g.,
magnetometer. The magnetometer is the least effective when to blind users) [15], [16], and (d) to detect urban features.
used alone. Instead, by using accelerometer only, the results This last challenge has been addressed with two different ap-
are only slightly worse than with all the sensors. The same proaches: crowdsourcing and automatic detection techniques.
holds for the gyroscope. Still, coupling the magnetometer with With crowdsourcing, information is manually annotated by
the other sensors does actually improve the recognition rate, 6 www.mapillary.com
in particular when it is used together with both accelerometer 7 route4u.org
and gyroscope. 8 www.kimap.it
1732019 IEEE International Conference on Pervasive Computing and Communications (PerCom)
0.90 0.90
0.92 0.85 0.85
0.90 0.80 0.80
F1 Score
F1 Score
F1 Score
0.75 0.75
0.88
0.70 0.70
0.86 0.65 0.65
0.60 0.60
0.84
0.55 0.55
FL RR RC FL+RR FL+RC RC+RR ALL A G M A+G A+M G+M ALL MLP SVM MNB HRF RF
(a) Position (FL=front-left, RR=rear-right, (b) Type (A=accelerometer, G=Gyroscope, (c) Classifiers (RF=flat random forest,
RC=rear-center). M=Magnetometer). HRF=hierarchical random forest,
MNB=multinomial naive bayes, MLP=multi-layer
perceptron, SVM=support vector machine).
Fig. 10. Performance varying position and type of inertial sensor as well as the classifier. The charts show the average F1 score for coarse-grained labels.
end users or other stakeholders [17], [18] as in the sidewalk (including wheelchair users) [28]. Inertial sensors have also
project9 . A well-known problem with crowdsourcing is to been used to detect simple activities to improve GPS-based
motivate users to contribute since it often requires an explicit localization for both pedestrian and wheelchair users [14].
user action. This problem is addressed, among others, by Differently from those approaches, we rely on inertial sensors
Liu et al. [19] while designing the WeMap system [20] that, to detect activities which in turn disclose detailed information
similarly to Moving Wheels, is aimed at providing accessibility about urban features.
information about routes and places. Unfortunately, based on
VIII. C ONCLUSION
our study, wheelchair users are rarely willing to manually
insert accessibility data. As a consequence, only a small We presented Moving Wheels, a urban navigation system
fraction of the necessary information is provided, it is often for wheelchair users and we proposed a technical solution for
unreliable, and it easily becomes obsolete. Consequently, these automatic crowdsourcing of inertial sensor data enabling the
services are rarely useful, according the users we interviewed. inference of geo-referenced potential obstacles. Our experi-
Automatic detection of urban features can be adopted to ments on real data show that the proposed approach is indeed
overcome the limitations of crowdsourcing. Computer vision effective.
techniques have been shown to be effective to detect some Future work will be mainly devoted to scale-up the experi-
urban features, like pedestrian crossings and traffic lights, ments to a larger set of urban features and to a larger training
both from images captured by the device camera [21], [22], set, including routes in the actual city instead of the real but
and from satellite images [23]. However, there are other protected environment used for this work. We also intend to
information, like the inclination of a curb ramp, that are develop a mobile app implementing the proposed technique
harder to detect with this approach and hence we believe so that classification can be run in real time, which in turn
that computer vision techniques are complementary to the will allows us to conduct experiments with active learning
solution proposed in this paper. An alternative approach to techniques.
automatically detect urban features is to process inertial data ACKNOWLEDGMENT
and, to the best of our knowledge, the only solution proposed
We acknowledge Alessandro Fellegara of Tribe Communi-
in the literature is based on data collected from people walking
cation for inspiring this work.
in the urban environment [24], while Moving Wheels uses data
from wheelchair users. R EFERENCES
The machine learning methods we propose and adapt to our [1] R. Velho, “Transport accessibility for wheelchair users: A qualitative
application are well known in human activity recognition and analysis of inclusion and health,” International Journal of Transportation
have been extensively studied in the literature. Supervised or Science and Technology, 2018. [Online]. Available: http://www.
sciencedirect.com/science/article/pii/S204604301730117X
semi-supervised classification techniques are usually adopted [2] L. Beale, K. Field, D. Briggs, P. Picton, and H. Matthews, “Mapping for
to address this problem [7]. Several works proposed to rec- wheelchair users: Route navigation in urban spaces,” The Cartographic
ognize human activities (walking, running, etc.) by analyzing Journal, vol. 43, no. 1, pp. 68–81, 2006.
[3] T. Völkel and G. Weber, “Routecheckr: personalized multicriteria rout-
data from inertial sensors found in commonly available mobile ing for mobility impaired pedestrians,” in Proceedings of the 10th inter-
devices, like smartphones, smartwatches or wristbands [25]– national ACM SIGACCESS conference on Computers and accessibility.
[27]. However, activity recognition for wheelchair users is an ACM, 2008, pp. 185–192.
[4] S. Mascetti, D. Ahmetovic, A. Gerino, and C. Bernareggi,
application domain with its own peculiarities that has been “Zebrarecognizer: Pedestrian crossing recognition for people with visual
only partially investigated. Smart cushions have been proposed impairment or blindness,” Pattern Recognition, vol. 60, pp. 405–419,
to monitor life-style revealing activities for sedentary subjects 2016. [Online]. Available: https://doi.org/10.1016/j.patcog.2016.05.002
[5] J. Leaman and H. M. La, “A comprehensive review of smart wheelchairs:
past, present, and future,” IEEE Transactions on Human-Machine Sys-
9 sidewalk.umiacs.umd.edu tems, vol. 47, no. 4, pp. 486–499, 2017.
1742019 IEEE International Conference on Pervasive Computing and Communications (PerCom)
[6] A. Bulling, U. Blanke, and B. Schiele, “A tutorial on human activity [26] G. M. Weiss, J. L. Timko, C. M. Gallagher, K. Yoneda, and A. J.
recognition using body-worn inertial sensors,” ACM Computing Surveys Schreiber, “Smartwatch-based activity recognition: A machine learning
(CSUR), vol. 46, no. 3, p. 33, 2014. approach,” in Biomedical and Health Informatics (BHI), 2016 IEEE-
[7] O. D. Lara, M. A. Labrador et al., “A survey on human activity EMBS International Conference on. IEEE, 2016, pp. 426–429.
recognition using wearable sensors.” IEEE Communications Surveys and [27] T. Brezmes, J.-L. Gorricho, and J. Cotrina, “Activity recognition from ac-
Tutorials, vol. 15, no. 3, pp. 1192–1209, 2013. celerometer data on a mobile phone,” in International Work-Conference
[8] C. N. Silla and A. A. Freitas, “A survey of hierarchical classification on Artificial Neural Networks. Springer, 2009, pp. 796–799.
across different application domains,” Data Mining and Knowledge [28] C. Ma, W. Li, R. Gravina, J. Cao, Q. Li, and G. Fortino, “Activity level
Discovery, vol. 22, no. 1-2, pp. 31–72, 2011. assessment using a smart cushion for people with a sedentary lifestyle,”
[9] M. Kipp, “Anvil-a generic annotation tool for multimodal dialogue,” in Sensors, vol. 17, no. 10, p. 2269, 2017.
Seventh European Conference on Speech Communication and Technol-
ogy, 2001.
[10] E. Ramentol, Y. Caballero, R. Bello, and F. Herrera, “Smote-rsb*: a
hybrid preprocessing approach based on oversampling and undersam-
pling for high imbalanced data-sets using smote and rough sets theory,”
Knowledge and information systems, vol. 33, no. 2, pp. 245–265, 2012.
[11] J. Rajamäki, P. Viinikainen, J. Tuomisto, T. Sederholm, and
M. Säämänen, “Laureapop indoor navigation service for the visually
impaired in a wlan environment,” in Proceedings of the 6th WSEAS
International Conference on Electronics, Hardware, Wireless and Opti-
cal Communications. World Scientific and Engineering Academy and
Society (WSEAS), 2007.
[12] M. Nakajima and S. Haruyama, “Indoor navigation system for visually
impaired people using visible light communication and compensated
geomagnetic sensing,” in Communications in China. IEEE, 2012.
[13] M. Murata, D. Ahmetovic, D. Sato, H. Takagi, K. M. Kitani, and
C. Asakawa, “Smartphone-based indoor localization for blind naviga-
tion across building complexes,” in IEEE International Conference on
Pervasive Computing and Communications (PerCom), 2018.
[14] M. Ren and H. A. Karimi, “Movement pattern recognition assisted
map matching for pedestrian/wheelchair navigation,” The journal of
navigation, vol. 65, no. 4, pp. 617–633, 2012.
[15] D. Ahmetovic, U. Oh, S. Mascetti, and C. Asakawa, “Turn right:
Analysis of rotation errors in turn-by-turn navigation for individuals with
visual impairments,” in Conf. on Computers and Accessibility. ACM,
2018.
[16] G. Dubus and R. Bresin, “A systematic review of mapping strategies
for the sonification of physical quantities,” PLoS ONE, vol. 8, no. 12,
p. e82491, Dec. 2013.
[17] K. Hara, S. Azenkot, M. Campbell, C. L. Bennett, V. Le, S. Pannella,
R. Moore, K. Minckler, R. H. Ng, and J. E. Froehlich, “Improving
public transit accessibility for blind riders by crowdsourcing bus stop
landmark locations with google street view: An extended analysis,” ACM
Transactions on Accessible Computing (TACCESS), vol. 6, no. 2, p. 5,
2015.
[18] M. Saha, K. Hara, S. Behnezhad, A. Li, M. Saugstad, H. Maddali,
S. Chen, and J. E. Froehlich, “A pilot deployment of an online tool
for large-scale virtual auditing of urban accessibility,” in Proceedings of
the 19th International ACM SIGACCESS Conference on Computers and
Accessibility. ACM, 2017, pp. 305–306.
[19] Z. Liu, S. Shabani, N. G. Balet, M. Sokhn, and F. Cretton, “How to
motivate participation and improve quality of crowdsourcing when build-
ing accessibility maps,” in Consumer Communications & Networking
Conference (CCNC), 2018 15th IEEE Annual. IEEE, 2018, pp. 1–6.
[20] Z. Liu, N. G. Balet, M. Sokhn, and E. De Gaspari, “Crowdsourcing-
based mobile application for wheelchair accessibility,” Journal on Tech-
nology & Persons with Disabilities, 2017.
[21] S. Mascetti, D. Ahmetovic, A. Gerino, and C. Bernareggi, “Zebrarecog-
nizer: Pedestrian crossing recognition for people with visual impairment
or blindness,” Pattern Recognition, 2016.
[22] S. Mascetti, D. Ahmetovic, A. Gerino, C. Bernareggi, M. Busso,
and A. Rizzi, “Robust traffic lights detection on mobile devices for
pedestrians with visual impairment,” Computer Vision and Image Un-
derstanding, 2016.
[23] D. Ahmetovic, R. Manduchi, J. M. Coughlan, and S. Mascetti, “Mind
your crossings: Mining gis imagery for crosswalk localization,” ACM
Transactions on Accessible Computing (TACCESS), 2017.
[24] A. Bujari, B. Licar, and C. E. Palazzi, “Movement pattern recognition
through smartphone’s accelerometer,” in Consumer communications and
networking conference (CCNC), 2012 IEEE. IEEE, 2012, pp. 502–506.
[25] M. Shoaib, S. Bosch, O. D. Incel, H. Scholten, and P. J. Havinga, “A
survey of online activity recognition using mobile phones,” Sensors,
vol. 15, no. 1, pp. 2059–2085, 2015.
175You can also read


