Analysis of the Influence of Sport Cyclists on Narrow Two-Lane Rural Roads Using Instrumented Bicycles and Microsimulation - MDPI
←
→
Page content transcription
If your browser does not render page correctly, please read the page content below
sustainability

Article
Analysis of the Influence of Sport Cyclists on Narrow Two-Lane
Rural Roads Using Instrumented Bicycles and Microsimulation
Sara Moll             , Griselda López *      and Alfredo García

                                          Highway Engineering Research Group, Universitat Politècnica de València, Camino de Vera s/n,
                                          46022 Valencia, Spain; samolmon@upvnet.upv.es (S.M.); agarciag@tra.upv.es (A.G.)
                                          * Correspondence: grilomal@tra.upv.es

                                          Abstract: It is frequent to see cyclists on Spanish two-lane rural roads, both riding individually
                                          and in groups. However, these roads were designed only for motorized vehicles, most of them
                                          having a narrow section with a null or impassable shoulder. Currently, drivers and cyclists have to
                                          share roads and interact, affecting both safety and traffic operation. The possibility of overtaking
                                          offers an improvement in traffic operation, however on narrow roads it can be difficult, meaning
                                          a greater invasion of the opposite lane thus creating more dangerous situations and implying a
                                          higher overtaking duration. To analyze the phenomenon, field data from instrumented bicycles
                                          and naturalistic videos were collected, then some performance measures to characterize safety and
                                          traffic operation were obtained. To increase the number of overtaking manoeuvres and performance
                                          measures obtained from observations, microsimulation has been used by adapting a model to include
                                          cyclists and their interaction with motorized vehicles. The traffic microsimulator was calibrated and
                                          validated with field data. The results show that cycle traffic presence decreases motorized vehicle
                                          average travel speed and increases percent followers and delays. Microsimulation can be used to
                                study other traffic scenarios and can help road administrations to safely and efficiently integrate

                                          cyclists to vehicular traffic on rural roads.
Citation: Moll, S.; López, G.; García,
A. Analysis of the Influence of Sport
                                          Keywords: sport cyclist; traffic microsimulation; two-lane rural road; traffic operation; instrumented
Cyclists on Narrow Two-Lane Rural
                                          bicycle; overtaking cyclist manoeuvre; bicycle safety
Roads Using Instrumented Bicycles
and Microsimulation. Sustainability
2021, 13, 1235. https://doi.org/
10.3390/su13031235
                                          1. Introduction
Academic Editor: Matjaž Šraml                  The presence of sport cyclists riding on two-lane rural roads is frequent in Spain, both
Received: 23 December 2020                individually and in groups. This fact is correlated with the increment of the number of
Accepted: 20 January 2021                 sports licenses for cyclists and cycling clubs in Spain, reaching 74,768 federated cyclists
Published: 25 January 2021                and 3878 federated clubs in 2019 [1]. As the number of cyclists increases, so does the
                                          number of accidents involving cyclists. In 2018, 7598 accidents involving cyclists were
Publisher’s Note: MDPI stays neutral      reported in Spain. Even though most of these accidents occurred on urban roads (72%),
with regard to jurisdictional claims in   a relatively high proportion (74%) of deaths related to cyclist accidents were recorded on
published maps and institutional affil-   rural roads [2].
iations.
                                               Spanish two-lane rural roads represent about 90% of the overall network. Most of
                                          these roads, where the presence of cyclists is very common, have a narrow section where a
                                          shoulder does not exist or is impassable. In fact, 54% of two-lane rural roads have a section
                                          width of less than 7 m, and 16% have a width of less than 5 m [3]. A study carried out
Copyright: © 2021 by the authors.         in the Valencian region, which used data from 2008–2013 on accidents involving cyclists,
Licensee MDPI, Basel, Switzerland.        showed that 78% of accidents occurred on narrow two-lane rural roads [4]. Two-lane rural
This article is an open access article    roads in Spain have been mainly designed for motorized vehicles; however, these roads
distributed under the terms and           have to be increasingly shared with sport cyclists. This fact can produce an impact on both
conditions of the Creative Commons
                                          safety and traffic operation.
Attribution (CC BY) license (https://
                                               Bicycles and motorized vehicles are different in terms of speed, volume, weight, and
creativecommons.org/licenses/by/
                                          level of protection for the users. Due to these differences, they usually have to interact by
4.0/).

Sustainability 2021, 13, 1235. https://doi.org/10.3390/su13031235                                    https://www.mdpi.com/journal/sustainability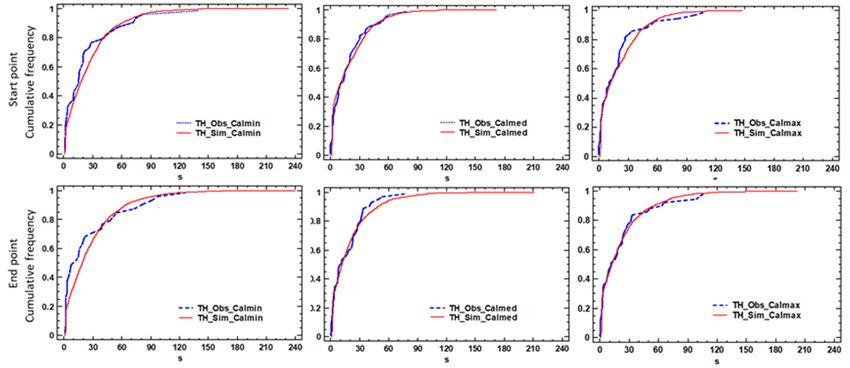
Sustainability 2021, 13, 1235                                                                                             2 of 17

                                overtaking maneuvers; however, this interaction is very dangerous. The main variables
                                associated with the overtaking manoeuvre are the lateral clearance and the speed difference
                                between the overtaking vehicle and the bicycle. Numerous studies have been developed to
                                analyze manoeuvres by motorized vehicles to overtake cyclists on two-lane rural roads by
                                collecting real data.
                                      Some studies used instrumented cars to collect data with different aims. Dozza et al. [5],
                                using this methodology, identified four phases of the overtaking manoeuvre (approaching,
                                steering away, passing, and returning). Feng et al. [6] showed that with the presence
                                of a bike lane (or paved shoulder), a dashed non-centre line produced significantly less
                                lane-crossing than a solid centreline. Kovaceva et al. [7] concluded that the higher the
                                speed, the larger the lateral clearance maintained by overtaking cars; and drivers were
                                significantly closer to the cyclist when an oncoming vehicle was present. The results from
                                the studies by Dozza et al. [6] and Kovaceva et al. [7] highlighted the need for legislation
                                on minimum overtaking distance stratified by vehicle speed.
                                       Driving simulation is another methodology used to analyze different factors related
                                to overtaking manoeuvres to cyclists on two-lane rural roads [8–12].
                                       The interactions between motorized vehicles and bicycles on two-lane rural roads
                                has also been analyzed using instrumented bicycles. García et al. [13] instrumented a
                                bicycle to study the effects of road geometry on overtaking manoeuvres to cyclists in rural
                                roads with different lane and shoulder width. Results showed that, on narrow roads, the
                                percentage of vehicles that occupied the opposing lane is higher. Chapman [14] evaluated
                                lateral clearance by analyzing the overtaking of bicycles on rural roads with and without
                                bicycle lanes; showing that bicycle lanes reduced the opposing lane invasion and kept
                                the overtaking vehicle trajectory more constant. Llorca et al. [15] collected a significant
                                number of variables such as lateral clearance, overtaking vehicle speed and type, opposing
                                lane occupation, and cyclist subjective risk perception using an instrumented bicycle.
                                Their results showed a correlation between cyclist risk perception and aerodynamic forces,
                                measured by combining lateral clearance and vehicle speed. Other studies have analyzed
                                the maneuver when passing groups of cyclists. In this line, Pérez-Zuriaga et al. [16]
                                instrumented bicycles to study the behavior of drivers when passing one, two and four
                                cyclists riding in line on four different rural roads, and their results showed higher speeds
                                and lower clearances when overtaking a cyclist than a group. Using instrumented bicycles,
                                García et al. [17] also analyzed the influence of grouping configuration on the interaction
                                between cyclists and motor vehicles on two-lane rural roads. They studied a small group of
                                up to three cyclists, concluding that when cyclists rode two-abreast, lower lateral clearance
                                was registered, and when riding in a group, motor vehicle speeds were lower. Moll
                                et al. [18] analyzed the effect of different factors related to the road, cyclist grouping, and
                                overtaking manoeuvres on the overtaking duration. Results showed that, on narrow roads,
                                the overtaking duration was higher than on wider ones, and it depended on the number of
                                cyclists in the group as well as their configuration.
                                       Most of the studies mentioned above focused on safety measures such as lateral
                                distance or overtaking speed during the overtaking maneuver, but no studies were found
                                related to traffic operation on rural roads with cycle traffic.
                                       On the other hand, the way cyclists ride on two-lane rural roads influences safety
                                and traffic operation. Spanish regulations allow cyclist groups to ride two-abreast as
                                long as there is enough visibility, and cyclists are obliged to ride on the shoulder, or,
                                if it is impracticable, on the right side of the lane. The overtaking manoeuvre is also
                                regulated, requiring a minimum lateral distance of 1.5 m. To facilitate the operation,
                                overtaking bicycles even across a solid line is allowed [19]. However, from the safety point
                                of view, it is also necessary identify which grouping configuration is safer considering road
                                characteristics and group size. López el al. [20] studied the perceived risk of a group of ten
                                cyclists when riding in different grouping configurations, and they stated that when cyclists
                                ride two-abreast the overtaking speeds and the lateral clearances were lower, and more
                                accelerative overtaking maneuvers were performed. Accelerative maneuvers are perceived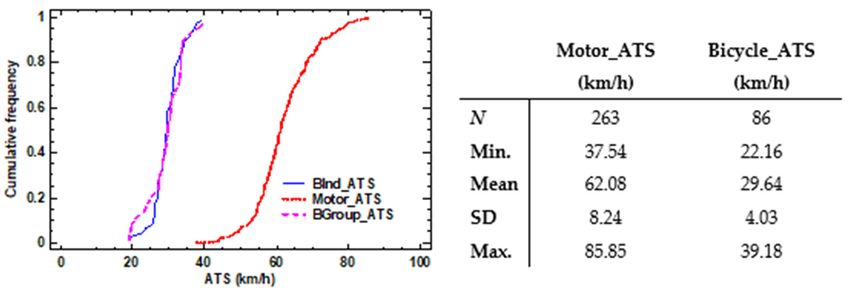
Sustainability 2021, 13, 1235                                                                                            3 of 17

                                safer by cyclists; lower overtaking speeds and higher lateral clearances were perceived
                                safer as well. In a survey performed by López et al. [21], cyclists stated a preference to ride
                                two-abreast on narrow two-lane rural roads. Two-abreast configuration implies that motor
                                vehicles have to occupy more space in the opposing direction when overtaking cyclists.
                                      On two-lane rural roads, the possibility of overtaking improves traffic operation, and
                                when there is cycle traffic at a slower speed, overtaking becomes more necessary to ensure
                                an adequate level of service. On narrow roads, overtaking requires practically full occupa-
                                tion of the opposite direction, and in many cases, the overtaking manoeuvre starts from a
                                follow-up stage generated by the impossibility to overtake due to low visibility or oncom-
                                ing traffic, forcing the vehicle to perform an accelerative manoeuvre. The characteristics of
                                these roads can create a more dangerous situation when motorized vehicles and bicycles
                                interact, and can impede manoeuvring, affecting traffic operation and cyclist’s safety.
                                      To analyze how cycle traffic influence safety and traffic operation on narrow rural
                                roads, it is necessary to obtain field data. From observations, it is possible to obtain safety
                                and performance measures to enable study of the phenomenon. However sometimes,
                                field data are insufficient to perform a complete analysis, and other methodologies, such
                                as traffic microsimulation, can be explored. Microsimulation is a useful tool to analyze
                                many aspects such as traffic stream, emissions, safety, and traffic operation. There are
                                many studies that have applied this methodology to the rural environment, with many
                                different aims. However, there are few that use traffic microsimulation including motorized
                                vehicles and cyclists, and all of them were developed in an urban context [22–24]. As a
                                far as the authors are aware, microsimulation has not been used to evaluate the impact of
                                interurban cycling.
                                      This paper presents a traffic microsimulation study to incorporate cyclists and eval-
                                uate the effect on two-lane narrow roads. Aimsun Next traffic microsimulation software
                                was used. Aimsun Next has an overtaking module for two-lane rural roads that was
                                modeled, calibrated, and validated with field data on Spanish roads by Llorca et al. [25].
                                The current overtaking module was developed considering both light and heavy motorized
                                vehicles, however cyclists were not included. This study introduced bicycles into the
                                overtaking module, incorporating their circulation characteristics and their interaction
                                with motorized vehicles based on field data collected on two-lane narrow roads. To adapt
                                the microsimulator to cycle traffic, several limitations had to be overcome.
                                      Different safety and performance measures obtained from field observations were used
                                to calibrate and validate the microsimulator. By using microsimulation, new performance
                                measures could be obtained. All of these safety and performance measures are used
                                to determine how observed traffic scenarios influence safety and traffic operation on a
                                narrow road.
                                      The results of this study can help road administration to improve the safety and the
                                traffic operation on narrow rural roads with cycle traffic. These improvements can reduce
                                emissions and promote the use of bicycles, increasing the sustainability of the system.
                                      The remainder of the paper is organized as follows: Section 2 presents the main
                                objectives of the research. In Section 3 the research methodology and data are drawn.
                                Section 4 shows the results and discussion. Finally, the last section presents the conclusions.

                                2. Objectives and Hypotheses
                                     Currently, on many Spanish two-lane rural roads, there is an increasing cycling
                                demand that must be considered when determining safety and traffic operation. The aim
                                of this paper was to determine how cycle traffic influences safety and traffic operation on
                                narrow rural roads by using field data and microsimulation results. To achieve this, the
                                following objectives were defined:
                                •    Develop two methodologies for field data collection to obtain the necessary variables
                                     to perform the study;
                                •    Adapt an existent overtaking model in Aimsun Next software to represent bicycle and
                                     motor vehicle traffic and their interaction;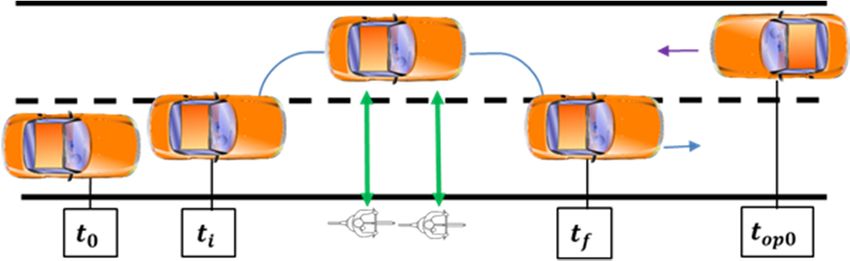
3. Materials and Methods
                                       The methodology developed is shown in Figure 1. The observation of the phenome-
                                 non was performed by using two different methodologies for field data collection; on the
                                 one hand, bicycles were instrumented to obtain data related to the overtaking manoeuvre
Sustainability 2021, 13, 1235                                                                                                         4 of 17
                                 at a microscopic level, and on the other, naturalistic videos from static positions were rec-
                                 orded in the study segment to obtain traffic volumes and performance measures that char-
                                 acterize traffic operation at a macroscopic level.
                                •      The microscopic
                                      Characterize     the level  covers
                                                           influence    ofthe  individual
                                                                            cycle           datasafety
                                                                                  traffic from    of eachandroad  user, suchmeasures
                                                                                                               performed      as specificob-
                                 speeds   or headways.     The  macroscopic     level
                                      tained from observations and microsimulation.   encompasses      traffic stream  variables,  which
                                 represent the operation of the entire system, such as average travel speed or percent fol-
                                      In this study, it has been hypothesized that the presence of cyclists reduces motorized
                                 lowers. Thus, the phenomenon will be analyzed at two levels, micro and macro, because
                                vehicle   speed, and increases percent followers and delays; thus, groups formed by higher
                                 the two types of variables are necessary to understand the behavior of drivers and cyclists.
                                number Onceof the
                                              cyclists
                                                  dataand
                                                        weretwo-abreast      configurations
                                                              collected, safety               increasemeasures
                                                                                  and performance        the effect.and different traffic
                                 scenarios, both bicycles and motorized vehicles, were obtained from observations.
                                3. Materials and Methods
                                       The microsimulation model and the overtaking module developed for two-lane rural
                                 roadsThe  methodology
                                        in Aimsun           developed
                                                     Next were           is shown
                                                                   analyzed         in Figure
                                                                              and adapted    to1.correctly
                                                                                                   The observation
                                                                                                            reproduce ofcycle
                                                                                                                         the phenomenon
                                                                                                                              traffic and
                                was   performed    by   using two   different   methodologies      for field  data
                                 their interaction with motorized vehicles. The adapted model was calibrated and   collection;  on the  one
                                                                                                                                     vali-
                                hand,   bicycles  were   instrumented      to obtain  data related   to the  overtaking
                                 dated with field data, and their validity was verified to simulate narrow two-lane rural manoeuvre     at a
                                microscopic     level, and  on the  other,  naturalistic
                                 roads with motorized vehicle and bicycle traffic.        videos   from  static  positions were   recorded
                                in theThe
                                        study  segment
                                            impact        to obtain
                                                     on safety   andtraffic
                                                                      trafficvolumes
                                                                               operationand
                                                                                          of performance
                                                                                             cycle traffic wasmeasures   that characterize
                                                                                                                  determined    by using
                                traffic operation   at  a macroscopic     level.
                                 data from observations and microsimulation.

                                Figure 1. Methodology
                                 Figure1.             scheme.
                                          Methodology scheme.

                                     The microscopic level covers the individual data of each road user, such as specific
                                speeds or headways. The macroscopic level encompasses traffic stream variables, which
                                represent the operation of the entire system, such as average travel speed or percent
                                followers. Thus, the phenomenon will be analyzed at two levels, micro and macro, because
                                the two types of variables are necessary to understand the behavior of drivers and cyclists.
                                     Once the data were collected, safety and performance measures and different traffic
                                scenarios, both bicycles and motorized vehicles, were obtained from observations.
                                     The microsimulation model and the overtaking module developed for two-lane rural
                                roads in Aimsun Next were analyzed and adapted to correctly reproduce cycle traffic and
                                their interaction with motorized vehicles. The adapted model was calibrated and validated
                                with field data, and their validity was verified to simulate narrow two-lane rural roads
                                with motorized vehicle and bicycle traffic.
                                     The impact on safety and traffic operation of cycle traffic was determined by using
                                data from observations and microsimulation.

                                3.1. Study Segment
                                      This study was performed on a segment of narrow two-lane road situated near
                                Valencia (CV–502), so the model could be calibrated and validated with real data. The
                                studied segment had no shoulder, had a lane width of 3.5 m, an Annual Average Daily
                                Traffic (AADT) of 4633 vehicle/day, and a percentage of heavy vehicles of 1.34% [26]. It was
                                parallel to the coast, and the slope was practically nil throughout the segment. Its length
                                was 2.185 km. The segment was homogeneous without intermediate entrances or exits. To
                                insert the segment into the microsimulator geometric data, posted speed limits and solid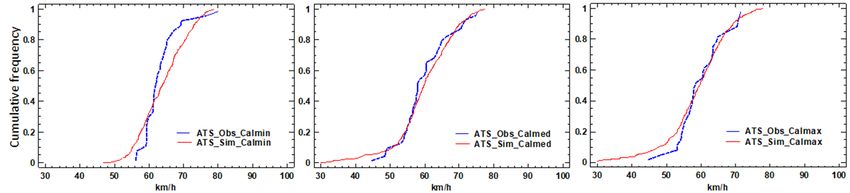
homogeneously distributed within the segment.
In this road, several traffic counts were performed, and a high presenc
was verified, both on weekdays and weekends. Most of these cyclist gr
Sustainability 2021, 13, 1235
abreast. This is a regular road for cycling club tours, where, in5recent
of 17
yea
dents involving cyclists have been reported.
lines were collected in the field. The speed limit was 60 km/h. There were 6 curves with
3.2. between
radii Microscopic
246 andLevel Data
760 m, and only one with a higher radius (2012.6 m) situated in
the middle
To correctly analyzewere
of the segment. There the4 interactions
non-passing zones, with lengths
between less than 350
motorized m,
vehicles an
homogeneously distributed within the segment.
necessary to understand
In this road, the overtaking
several traffic counts manoeuvre.
were performed, and a highTo studyofthis,
presence cyclea data
odology
traffic basedboth
was verified, on instrumented
on weekdays and bicycles
weekends. riding
Most of the
thesestudied segment
cyclist groups rode was
two-abreast. This is a regular road for cycling club tours, where, in recent years, several
Instrumented bicycles can be observed in Figure 1. They were equ
accidents involving cyclists have been reported.
high-definition video cameras, one located on the bicycle’s handlebar an
3.2. Microscopic
cated in theLevel
rearData
of the bicycle. The frontal camera recorded interactions
To correctly analyze the interactions between motorized vehicles and bicycles, it
vehicles and the end of the overtaking manoeuvre, and the rear camera r
is necessary to understand the overtaking manoeuvre. To study this, a data collection
proachingbased
methodology vehicle and the start
on instrumented of the
bicycles manoeuvre.
riding Thesewas
the studied segment cameras
designed.incorpor
provided the position
Instrumented bicycles can and the speed
be observed of the1.bicycles.
in Figure They wereBicycles
equipped werewith twoalso equ
high-definition video cameras, one located on the bicycle’s handlebar and the second
devices that collected overtaking vehicle speed and lateral clearance betw
located in the rear of the bicycle. The frontal camera recorded interactions with oncoming
bicycleand
vehicles during
the endthe overtaking
of the overtaking manoeuvre.
manoeuvre, and the rear camera recorded the
Before collecting data with the instrumented
approaching vehicle and the start of the manoeuvre. These cameras bicycles, observations
incorporated a GPS of
that provided the position and the speed of the bicycles. Bicycles were also equipped with
fic were performed in the studied road to determine the most common
laser devices that collected overtaking vehicle speed and lateral clearance between vehicle
used
and by during
bicycle cyclists. From these
the overtaking observations, the data collection with instrum
manoeuvre.
wasBefore collectingin
designed, data with the
which instrumented
7 different bicycles, observations
configurations of thecyclist
of the bicycle traffic
group wer
were performed in the studied road to determine the most common configurations used
was a group of 10 cyclists in the first tests, and 4 cyclists in the following te
by cyclists. From these observations, the data collection with instrumented bicycles was
in the configurations
designed, in which 7 differentindicated
configurations byofthetheresearch team
cyclist group were(Figure 1). Cyclists
studied. There was w
asionals,
group of 10 cyclists in the first tests, and 4 cyclists in the following
who usually practiced cycling as a sport on two-lane rural roads. tests, which rode in the
configurations indicated by the research team (Figure 1). Cyclists were semi-professionals,
Frompracticed
who usually data collection
cycling as a and sport reduction,
on two-lane ruralvariables
roads. characterizing the over
vreFrom
of motorized
data collection vehicles to cyclists
and reduction, variables were identified.
characterizing Overtaking
the overtaking duration
manoeu-
vre of motorized vehicles to cyclists were identified. Overtaking
groups of cyclists was the main variable used to calibrate and validate duration for the different
groups of cyclists was the main variable used to calibrate and validate the traffic microsimu-
crosimulator.
lator. The duration ofThe duration
overtaking of overtaking
is defined as the time fromis defined as the
the overtaking time
vehicle from the o
starting
clemanoeuvre
the starting until
the itmanoeuvre
returns to its laneuntil it returns
(Figure 2). to its lane (Figure 2).
Figure
Figure 2. Definition
2. Definition of overtaking
of overtaking duration. t0duration.
: time whentthe
0: time when
vehicle the
reaches thevehicle
bicycle, tireaches
: time the
when the vehicle starts the overtaking manoeuvre changing to the opposing
when the vehicle starts the overtaking manoeuvre changing tof the opposing lane, lane, t : time when the
vehicle finishes the manoeuvre and returns to its lane, top0 : time when the opposing vehicle is visible
vehicle finishes the manoeuvre and returns to its lane, top0: time when the opposin
for first time, tf −ti : overtaking duration.
ble for first time, tf−ti: overtaking duration.
Other variables obtained with this methodology, for each overtaking manoeuvre, were
overtaking vehicle speed, lateral clearance, opposing lane occupation, type of overtaking
vehicle, and the presence of an oncoming vehicle.Sustainability 2021, 13, 1235 6 of 17
3.3. Macroscopic Level Data
To study the effect that cyclists have, videos from a static position at the start and
end points of the studied segment were recorded simultaneously. All these recordings
were made with high-definition video cameras, which were strategically positioned so the
studied variables were perfectly collected in a naturalistic way.
Data reduction, beginning with the start of the segment and following with the end,
was carried out using Kinovea video processing software. The timestamp and the typology
of each road user was registered. In the case of groups of cyclists, the number of cyclists,
their configuration (in-line or two-abreast), and a description to identify the same user in
the end point were registered.
Following the methodology of the Highway Capacity Manual (HCM) [27], traffic
volumes were calculated with sliding windows of 5 min, and for each 15 min value the
equivalent hourly traffic volume was obtained. Traffic volumes were calculated for bicycles
and motorized vehicles, for each traffic direction. To perform the macroscopic analysis,
after processing the data, the following variables were calculated:
• Time headway between users at start and end points of the segment (TH);
• Number of cyclists that form each cyclist group and its in-line (L) or two-abreast
configuration (TA);
• Travel time of each user (TT);
• Average travel speed of individual bicycles (BInd_ATS);
• Average travel speed of groups of cyclists (BGroup_ATS);
• Average travel speed of motorized vehicles (Motor_ATS);
• Percent of followers considering the 3 s criterion suggested by the HCM. It was calcu-
lated both at the start and end points of the segment and considering all users (PF);
• Percent time spent following, calculated according to the HCM methodology (PTSF).
Finally, equivalent hourly volumes were used to provide the traffic scenarios necessary
to calibrate and validate the microsimulator, and to determine the effect of cycle traffic on
the road.
3.4. Microsimulation Model Adaptation
Aimsun Next software, version Aimsun Next 20 [28], was used in this study. Aimsun
Next correctly represents the motorized vehicle traffic characteristics on two-lane rural
roads, especially the overtaking manoeuvre, because it was developed and tested in
different studies [25,29].
The passing model is based on three stages of the overtaking manoeuvre: desire,
decision, and execution. In the current model, when a vehicle cannot reach its desired
speed, it considers the possibility to overtake. The desire to pass is based on four variables
(time spent following, difference between desired and actual speed, rank in the queue, and
remaining time to the end of the segment). Considering motorized vehicles and bicycles,
the desire is always positive due to the high speed difference. The decision to pass is
conditioned to verifying if passing is allowed by a non-solid centre line and if simultaneous
passing maneuvers are allowed; if this occurs, the gap acceptance process starts. An
available gap is accepted if the required gap is minor. In Aimsun Next, it is assumed that
each passing vehicle maintains a constant acceleration during overtaking until its desired
speed is reached, and then a constant speed is maintained. A passing gap in the opposing
direction is accepted if the overtaking duration needed plus a safety margin is less than
the time to collision with the oncoming vehicle, whenever the passing time is less than
the time until the end of the passing zone. This is an iterative process evaluated in every
simulation step. When a gap is accepted, the overtaking vehicle starts the maneuver by
accelerating and changing to the opposing lane. In the passing phase the abort time is
calculated, and the maneuver is evaluated at each simulation step by re-calculating the
overtaking duration needed, time to collision, abort time and the safety margin considered.
However, the overtaking manoeuvre on cyclists has some particularities that have to
be included into the microsimulation model: the possibility to overtake a group of cyclistsSustainability 2021, 13, 1235 7 of 17
even with a solid line and with partial opposing lane invasion. Some modifications have
to be performed to adapt the current passing model to correctly represent bicycles and
their interaction with motorized vehicles, without neglecting the interactions between
motorized vehicles.
From the authors’ collaboration with the Aimsun Next team, Aimsun Next 20 version
has a two-way overtaking model enhancement to model vehicles overtaking other vehicles
with a very low desired speed even when there is a solid line. This reflects the fact that, in
some countries, a motorized vehicle is allowed to overtake a cyclist even on a road with a
solid line [28]. In this way, it is possible to simulate two overtaking behaviors inside the
same simulation, one between motorized vehicles and other between motorized vehicles
and bicycles.
In the current two-lane passing module, the bidirectional and the bidimensional
models were not compatible, so the lateral movement into the lane was not possible,
therefore being impossible to represent the partial opposing lane invasion. To overcome
this limitation, the effective length of the different cyclist groups to achieve simulated
overtaking durations considering a total opposing lane invasion closer than those observed
was calibrated. Every group of cyclists was considered as one user in the microsimulation
model, because they rode together at the same speed, as seen in the field observations.
Microsimulation Model Calibration and Validation
The model was calibrated firstly at microscopic level, checking that overtaking ma-
noeuvres to bicycles were carried out correctly. Observed overtaking durations to the
different groups of cyclists were used to calibrate the equivalent lengths of each cyclist
group introduced into the microsimulator. In Aimsun Next 20, overtaking duration is
considered the opposing lane occupation time. Therefore, the length of each cyclist group
was a parameter to calibrate, thus overcoming the limitation of the impossibility of par-
tial invasion of the opposing direction. The desired speeds of each road user type were
calibrated as well, to obtain a correct behavior.
Secondly, the model was calibrated at macroscopic level by checking basic perfor-
mance measures for different traffic scenarios. To achieve a PF at the entrance of the
segment closer than that observed, a queue generation segment was connected before the
studied segment, and its length was calibrated. Motor_ATS, TH, and PF at the end of the
segment were used to calibrate the rest of the model parameters.
Statistic tests were performed to compare the simulation results to observed data. A
non-parametric Kolmogorov–Smirnov (K–S) test was used to compare distributions of
overtaking durations, Motor_ATS and TH. The null hypothesis implied that both sam-
ples come from the same distribution. The maximum distance between the cumulative
distributions were obtained and compared to an admissible distance.
Mean, standard deviations, and median values of simulated and observed distribu-
tions were compared by t-test, F-test, and U-test, respectively. The null hypothesis in these
tests implied that the mean, standard deviation, or median of simulated and observed
samples would be equal. ANOVA tests were performed to determine the existence of statis-
tically significant differences between two samples of data that comply to the assumptions
required to apply an ANOVA test. To compare results from the simulation and observed
data, the root mean square error (RMSE) was used:
s
2
∑in (Vobs,i − Vsim,i )
RMSE = (1)
N
where Vsim,i is the simulated variable at scenario i; Vobs,i is the observed variable at scenario
I; and N is the number of calibration or validation scenarios.
The calibration process was carried out with three traffic scenarios: the maximum
(Calmax), minimum (Calmin), and medium (Calmed) bicycle volumes. The model was
validated in four traffic scenarios, different from those used for calibration.Sustainability 2021, 13, 1235 8 of 17
3.5. Safety and Performance Measures
To analyze the impact that cyclists produce, the following measures were evaluated:
• Safety (from field observation): overtaking duration, overtaking speed and clearance;
• Operation (from field observation): average travel speed, percent followers, percent
time spent following, and time headways;
• Operation (from microsimulation): delay time.
4. Results and Discussion
To begin with, details of the results obtained using the methodologies to collect field
data are described. Secondly, the results of the calibration and validation processes of the
Aimsun Next software are shown. From these results, a safety and an operational analysis
are carried out.
4.1. Microscopic Level Data
A total of 235 overtaking manoeuvres on the cyclist groups were recorded: 96% of cases
were carried out by light vehicles, 3% by heavy vehicles, and 1% by motorcycles. Heavy
vehicles were characterized as those with two axles or were longer than 10 m. The aim of
this study was to analyze the interaction between light vehicles (mainly passenger cars) and
bicycles. The main reason was that the behavior of drivers of the light and heavy vehicles
and motorcycles when interacting with cyclists may be different, due to the differences
between these motorized vehicles in terms of speed, size, and aerodynamical effects. The
percentage of manoeuvres that were carried out from a previous follow-up was 21%. Most
(99%) of the manoeuvres were realized by invading the opposing lane; from these, 55%
implied a total invasion. A total of 92% of the manoeuvres were realized without a visible
oncoming vehicle. This high percentage of following and opposing lane occupation was
due to the segment cross section, because it was a narrow section without a shoulder, where
vehicles must invade practically the entire opposite lane to overtake the bicycles. These
results agree with García et al. [13] and Bella and Silvestri [8], who determined that narrow
roads presented higher opposing lane invasion and lower clearances.
Table 1 shows the overtaking vehicle speed, the lateral clearance, and the overtaking
duration between motorized vehicles and the different bicycle groups. To explore if
there were significant differences between the study variables among the different cyclist
group configurations, an ANOVA assessment was performed. The results indicated that
overtaking speed was similar for all cyclist configurations and no statistically significant
differences between the means were found (F = 0.76, p = 0.601). Results indicated that there
were statistically significant differences between the mean lateral clearance considering
each cyclist configuration (F = 3.02, p < 0.05), presenting higher values when cyclists rode
in line; considering the mean values, all of them respected the minimum required distance
of 1.5 m.
Table 1. Observed overtaking data description.
Cyclist Overtaking Vehicle Lateral Overtaking
Observations
Configuration Speed (km/h) Clearance (m) Duration (s)
N (%) Mean (SD) Mean (SD) Mean (SD)
Individual (1) 37 (16%) 65.60 (15.66) 1.88 (0.46) 5.65 (1.65)
2 in line (2L) 41 (18%) 66.39 (19.35) 1.78 (0.46) 6.71 (2.11)
2 two-abreast (2TA) 42 (19%) 62.48 (13.94) 1.60 (0.46) 6.17 (1.99)
4 in line (4L) 36 (16%) 68.46 (13.55) 1.91 (0.42) 8.58 (2.22)
4 two-abreast (4TA) 31 (14%) 63.03 (14.84) 1.67 (0.32) 6.84 (2.00)
10 in line (10L) 16 (7%) 62.06 (09.72) 1.99 (0.39) 9.44 (2.22)
10 two-abreast (10TA) 22 (10%) 64.68 (12.75) 1.83 (0.51) 7.59 (1.97)Individual (1) 37 (16%) 65.60 (15.66) 1.88 (0.46) 5.65 (1.65)
2 in line (2L) 41 (18%) 66.39 (19.35) 1.78 (0.46) 6.71 (2.11)
2 two-abreast (2TA) 42 (19%) 62.48 (13.94) 1.60 (0.46) 6.17 (1.99)
4 in line (4L) 36 (16%) 68.46 (13.55) 1.91 (0.42) 8.58 (2.22)
Sustainability 2021, 13, 1235
4 two-abreast (4TA) 31 (14%) 63.03 (14.84) 1.67 (0.32) 6.84 (2.00)
9 of 17
10 in line (10L) 16 (7%) 62.06 (09.72) 1.99 (0.39) 9.44 (2.22)
10 two-abreast (10TA) 22 (10%) 64.68 (12.75) 1.83 (0.51) 7.59 (1.97)
Finally, there were statistically significant differences between the means of overtak-
Finally, there were statistically significant differences between the means of overtaking
ing duration of the different cyclist groups (F = 12.04, p < 0.001). The data present a directly
duration of the different cyclist groups (F = 12.04, p < 0.001). The data present a directly
proportional relationship between the overtaking duration and the number of cyclists that
proportional relationship between the overtaking duration and the number of cyclists that
form the group. It was also observed that, for groups with the same number of cyclists,
form the group. It was also observed that, for groups with the same number of cyclists,
longer durations occurred when they rode in line compared to two-abreast.
longer durations occurred when they rode in line compared to two-abreast.
4.2. Macroscopic
4.2. Macroscopic Level
Level Data
Data
Data were
Data were collected
collected simultaneously
simultaneouslyat atthe
the start
start and
and end
end points
points of
of the
the studied
studied segment
segment
during aa weekday
during weekday morning.
morning. TheThe data
data were
were reduced
reduced and and analyzed
analyzed inin both
both directions,
directions, and
and
finally the
finally thestudy
studywas
wascentred
centred
ononthethe direction
direction withwith a higher
a higher presence
presence of cyclists.
of cyclists. ThereThere
were
were
166 166 bicycles
bicycles and 263and 263 motor
motor vehiclesvehicles registered
registered in the studied
in the studied direction,
direction, and 93 bicy-
and 93 bicycles and
cles motor
319 and 319 motor in
vehicles vehicles in the opposing
the opposing direction.direction.
From 166From 166registered
cyclists cyclists registered in the
in the studied
studied direction,
direction, 59 rode individually
59 rode individually and the restand
rode theinrest rodeofin
groups upgroups of up to
to 12 cyclists, 12 of
most cyclists,
them
most oftwo-abreast.
riding them riding two-abreast.
ANOVA test
An ANOVA test did
did not
not show
show statistically
statistically significant
significant differences
differences between
between the the mean
mean
values ofofindividually
values individuallybicycle
bicycle average
average travel
travel speedspeed
and and bicycle
bicycle groupsgroups
averageaverage travel
travel speed
speed
(F (F =p0.09,
= 0.09, p = 0.759);
= 0.759); then, then, formicrosimulator
for the the microsimulator it wasit was established
established that that all bicycles,
all the the bicy-
both
cles, individual and groups,
both individual ride with
and groups, ridethe same
with the speed
same distribution. The ATS
speed distribution. Thedistributions
ATS distri-
(Figure
butions3)(Figure
were then used then
3) were to model
usedthe
to maximum
model the desired
maximum speed of motorized
desired speed of vehicles and
motorized
bicycles
vehicles onandthe microsimulator.
bicycles on the microsimulator.
Figure 3. Average
Figure 3. Average travel
travel speed
speed (ATS)
(ATS)observed
observeddistributions
distributionsfor
formotorized
motorizedvehicles
vehiclesand
andbicycles.
bicycles.
A total of 31 different traffic scenarios were obtained with different cycle and mo-
A total of 31 different traffic scenarios were obtained with different cycle and motor-
torized vehicle traffic volumes. Table 2 shows the traffic scenarios chosen to calibrate
ized vehicle traffic volumes. Table 2 shows the traffic scenarios chosen to calibrate and
and validate the adapted traffic microsimualtor. Scenarios with maximum, medium, and
validate the adapted traffic microsimualtor. Scenarios with maximum, medium, and min-
minimum hourly bicycle volumes were used to calibrate (Calmax, Calmed, Calmin). The
imum hourly bicycle volumes were used to calibrate (Calmax, Calmed, Calmin). The four
four selected validation scenarios (Val1, Val2, Val3, Val4) covered a wide range of traffic
selected validation scenarios (Val1, Val2, Val3, Val4) covered a wide range of traffic vol-
volumes, both of motorized vehicles and cyclist. For each traffic scenario, the ATS of
umes, both of motorized vehicles and cyclist. For each traffic scenario, the ATS of motor-
motorized vehicles and bicycles was calculated. TH, PF (at start and end segment points)
ized vehicles and bicycles was calculated. TH, PF (at start and end segment points) and
and PTSF was also calculated; these results are shown in the next section.
PTSF was also calculated; these results are shown in the next section.
Table 2. Calibration and validation scenarios traffic volumes (users/h).
Hourly Traffic Volumes (users/h) Calmin Calmed Calmax Val1 Val2 Val3 Val4
Motor vehicles 128 144 120 76 64 136 108
Opposing motor vehicles 156 160 152 136 156 88 84
1 12 36 40 24 16 24 20
2TA 4 12 8 16 0 16 0
4TA 0 0 4 0 4 4 8
10TA 0 4 12 8 0 0 0
Total cyclists 20 100 192 136 32 72 52Sustainability 2021, 13, 1235 10 of 17
Traffic scenarios were simulated considering all cyclists groups riding two-abreast,
because it was the grouping configuration that offered the lower overtaking duration and
was the most frequent in the field observations.
4.3. Microsimulation Calibration and Validation
The values of the parameters that minimized the differences between the observed
values and the results of the simulations are shown in Table 3. The rest of the parameters
were reviewed, and the Aimsun Next default values considering only motorized vehicles
were chosen.
Table 3. Values of traffic microsimulation parameters.
Segment
Speed difference to overtake with solid line (km/h) = 20 km/h
Length of previous queue generation segment (m) = 350 m
Users
Equivalent length (m): Individual = 4 m; 2TA = 6 m; 4TA = 10 m; 10TA = 16 m
Motorized Maximum desired speed distribution = mean 78 km/h (S.D. 10 km/h)
Bicycle Maximum desired speed distribution = mean 30 km/h (S.D. 2 km/h)
Experiment
Delay between simultaneous overtaking manoeuvres (s) = 0 s
Number of simultaneous overtaking manoeuvres allowed = 5
Maximum rank in the platoon to desire passing = 2
Remaining time until the end of the highway segment threshold (s) = 5 s
Results were obtained considering 15 replications of each simulation scenario to
reduce the variability associated with the simulator’s randomness. The model stability
with 15 replications was checked considering travel times and total demands, obtaining a
variation lower than 5% maximum relative error.
4.3.1. Microscopic Calibration
The overtaking manoeuvres were checked in calibration scenarios, and the equivalent
length of each cyclist group (Table 3) was calibrated to obtain overtaking durations closer
to observations. Table 4 shows the simulation results of the overtaking duration for
each calibration scenario and grouping configuration. ANOVA tests were performed,
and results showed that there were no statistically significant differences between the
means of overtaking duration with a 5% significance level, indicating the validity of the
calibration process.
Table 4. Overtaking durations (s) from simulations for each cyclist configuration and calibration
scenario.
Cyclist Calmin Calmed Calmax ANOVA Results
Groups N Mean SD N Mean SD N Mean SD F p-Value
1 148 5.88 1.46 192 5.74 1.57 190 5.56 1.54 1.22 0.303
2TA 45 6.18 1.93 81 6.20 1.64 73 6.06 1.55 0.10 0.961
4TA - - - - - - 40 6.65 1.66 0.19 0.665
10TA - - - 69 7.31 1.73 103 7.14 1.62 0.71 0.495
A total of nine K–S tests were performed to compare the overtaking duration distri-
butions of observed and simulated data for each calibration scenario and cyclist group
configuration. Only for an individual cyclist was a p-value < 0.05 obtained, indicating
that for the other configurations, the distributions of overtaking durations did not present
statistically significant differences at the 95% confidence level.4TA - - - - - - 40 6.65 1.66 0.19 0.665
10TA - - - 69 7.31 1.73 103 7.14 1.62 0.71 0.495
A total of nine K–S tests were performed to compare the overtaking duration distri-
butions of observed and simulated data for each calibration scenario and cyclist group
Sustainability 2021, 13, 1235 configuration. Only for an individual cyclist was a p-value < 0.05 obtained, indicating11
that
of 17
for the other configurations, the distributions of overtaking durations did not present sta-
tistically significant differences at the 95% confidence level.
4.3.2. Macroscopic
Macroscopic Calibration
Calibration
performance measure
The first performance measureused
usedto
tocalibrate
calibratethe
themicrosimulator
microsimulatorwas
wasthe
theaverage
average
travel speed of
of motorized
motorized vehicles.
vehicles.Figure
Figure44shows
showsthat
thatsimulated
simulateddistribution
distributionagrees
agreeswith
with
the observed data
data for
for each
each calibration
calibrationscenario.
scenario.
Figure 4.
Figure 4. Motor_ATS
Motor_ATS distributions
distributionsfrom
fromobservations
observationsand
andsimulations
simulations(km/h).
(km/h).
K–S tests results are
are shown
shown ininTable
Table5,5,indicating
indicatingthere
therewere
werenonostatistically
statistically signifi-
significant
cant differences
differences between
between the average
the average traveltravel
speedspeed of motorized
of motorized vehicles
vehicles distributions
distributions of
of simula-
simulation
tion resultsresults and observed
and those those observed
with awith
95%aconfidence
95% confidence
level level
for allforcalibration
all calibration sce-
scenarios.
narios. Motor_ATS
Motor_ATS mean values
mean values were compared
were compared by a t-test
by a t-test (Table(Table 5), which
5), which indicated
indicated that that
there
there no
were were no differences
differences between between the observed
the observed and simulated
and simulated scenarios.
scenarios.
Table 5. Statistical results
Table for Motor_ATS
5. Statistical results for
for the calibration
Motor_ATS forscenarios.
the calibration scenarios.
Observed Observed
Simulated Simulated K–S Test K–S Test t-Test
t-Test
Scenario N Scenario
Mean (km/h) N N Mean
Mean(km/h) MeanDist.
(km/h) N Max. (km/h) Max.
Adm. Dist.
Dist.Adm.p-Value
Dist. p-valuet t p-Value
p-Value
Calmin 32 63.05 Calmin
57632 63.05
63.95 576 63.95
0.24 0.24
1.33 1.330.059 0.059 −0.75
−0.75 0.454
0.454
Calmed 36 59.71 Calmed67636 59.71
59.82 676 59.82
0.13 0.13
0.78 0.780.572 0.572 −0.08 0.939
−0.08 0.939
Calmax 30 59.73 Calmax53630 59.73
58.78 536 58.78
0.15 0.15
0.79 0.790.563 0.5630.57 0.57 0.568
0.568
RMSE considering simulated and observed mean average travel speed of motorized
vehicles
RMSE values for the calibration
considering simulated and scenarios
observedresulted
meaninaverage
0.76 km/h.
travelMedian
speed ofvalues and
motorized
standardvalues
vehicles deviations were
for the tested, obtaining
calibration scenariosresults
resultedthatinindicated
0.76 km/h. no statistically
Median values signifi-
and
cant differences
standard between
deviations wereobserved and simulated
tested, obtaining resultsvalues in each calibration
that indicated scenario.
no statistically significant
To ensure
differences that users
between observedentered
and the studiedvalues
simulated segment in the
in each same conditions
calibration scenario.as those
which Tohad been
ensure observed,
that a non-passing
users entered the studied segment
segmentwas inserted
in the before the as
same conditions studied seg-
those which
ment.
had Theobserved,
been length of this segment was
a non-passing calibrated
segment was (Table
inserted 3),before
therefore
the the TH and
studied PF simu-
segment. The
lation results
length of this at the startwas
segment of the segment(Table
calibrated were 3),
close to the observations
therefore the TH and PF in the three calibra-
simulation results
tion
at thescenarios (Figure
start of the 5). Atwere
segment the end
closeoftothe
thesegment, different
observations THthree
in the and calibration
PF values were ob-
scenarios
tained than
(Figure at the
5). At the entrance,
end of thebecause
segment,users traveled
different TH theand
segment withwere
PF values different speeds
obtained andat
than
overtaking
the entrance,occurring
becausewithin the segment.
users traveled The parameters
the segment that controlled
with different speeds and the maximum
overtaking
desired speed
occurring of each
within type of user
the segment. Theand the overtaking
parameters manoeuvre
that controlled the(Table
maximum 3) were calibrated
desired speed
of each type of user and the overtaking manoeuvre (Table 3) were calibrated until the
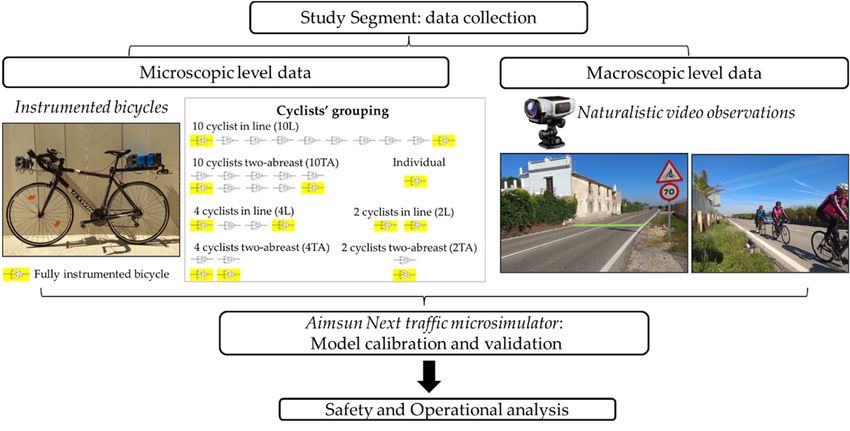
simulated TH and PF at the end point were close enough to those observed (Figure 5).
TH distributions were compared by a K–S test, obtaining no statistically significant
differences between simulated and observed samples at a 95% confidence level, both at
the start and the end of the segment (Table 6). Mean, median, and standard deviation
values were compared as well, obtaining no statistically significant differences with a 5%
significance level. The RMSE calculated for TH means at the start of the segment was 1.24 s,
and at the end it was 2.08 s.
PF values resulting from the simulations and observations were compared using the
RMSE. In both positions, at the start and end of the segment, RMSE values were less than
5%, indicating the quality of the calibration process.
PF is a surrogate measure, easier to measure in the field, to estimate PTSF. HCM
methodology proposes equations to calculate the PTSF depending on traffic characteristics
and road geometry. PTSF was calculated for each traffic scenario (Table 7). Results only
depended on the motorized vehicle traffic in each direction, because the scenarios had theSustainability 2021, 13, 1235 12 of 17
Sustainability 2021, 13, x FOR PEER REVIEW 12 of 18
same geometric characteristics and bicycle traffic was not considered in the calculations.
This
untilfact produced TH
the simulated no real
and result for end
PF at the Calmax,
pointitwere
being the enough
close scenariotowith
thosea observed
higher presence
(Fig-
of cyclists,
ure 5). although a lower value of PTSF was obtained.
Figure 5.
Figure 5. Calibration
Calibrationsimulated
simulatedvs.vs.
observed THTH
observed distributions at the
distributions atstart and end
the start andpoints of the of the
end points
study segment.
study segment.
TH distributions were compared by a K–S test, obtaining no statistically significant
Table 6. Statistical results for TH at the start and the end of the segment for the calibration scenarios.
differences between simulated and observed samples at a 95% confidence level, both at
the start and the end of the segment (Table
Observed 6). Mean, median, andK–S
Simulated standard
Test deviation
values were compared
Scenario N as well,
Meanobtaining
(s) N noMean
statistically
(s) significant
Max. Dist. differences
Adm. Dist.with a 5%
p-Value
significance level.
Calmin The
36 RMSE calculated
23.68 for
2080 TH means
25.45 at the start
0.18 of the segment
1.05 was 1.24
0.223
s,Start
and at the end it was
Calmed 48 2.08 17.47
s. 2892 18.43 0.10 0.72 0.682
point
Calmax 46 19.20 2672 19.93 0.13 0.85 0.481
Table 6. Statistical results for TH at the start and the end of the segment for the calibration scenar-
Calmin 36 25.02 1945 27.34 0.21 1.23 0.098
End
ios.
Calmed 48 16.81 2731 19.54 0.12 0.82 0.525
point
Calmax 46
Observed 21.60 2500
Simulated 21.23 0.15 K–S Test0.99 0.282
Scenario N Mean (s) N Mean (s) Max. Dist. Adm. Dist. p-Value
Calmin 36 23.68 2080 25.45 0.18 1.05 0.223
Start 7. PF simulated and observed and PTSF values for the calibration scenarios.
Table
Calmed 48 17.47 2892 18.43 0.10 0.72 0.682
point
Calmax 46 Start19.20
Point 2672 19.93 0.13End Point0.85 0.481
Calmin 36 25.02 1945 27.34 0.21 1.23 PTSF
0.098
Scenario
End PF Obs. PF Sim. Dif. PF Obs. PF Sim. Dif.
Calmed 48 16.81 2731 19.54 0.12 0.82 0.525
point
Calmin 22.20% 18.80% 3.40% 25.00% 19.10% 5.90% 23.56%
Calmax 46 21.60 2500 21.23 0.15 0.99 0.282
Calmed 29.20% 32.40% −3.20% 27.10% 28.20% −1.10% 25.64%
Calmax
PF values30.40% 29.40%
resulting from 1.00%
the simulations and28.30% 28.90%
observations −0.60% using
were compared 22.55%
the
RMSE.
RMSEIn both positions, at the start and
2.8%end of the segment, RMSE values were less than
3.5%
5%, indicating the quality of the calibration process.
4.3.3. Validation
Table 7. PF simulated and observed and PTSF values for the calibration scenarios.
In the validation process, overtaking durations for the different cyclists’ groups were
checked. In all validationStart Point
scenarios Endt-tests
(Table 2), K–S tests and Point did not present statis-
PTSF
Scenario PF Obs. PF Sim. Dif. PF Obs.
tically significant differences at a 95% confidence level between PF Sim.simulated
Dif. and observed
Calmin
samples. These22.20% 18.80%
results confirm 3.40%
that the 25.00%
duration 19.10%
of overtaking 5.90%
is a key 23.56%
variable to ana-
Calmed 29.20% 32.40% −3.20% 27.10% 28.20% −1.10% 25.64%
lyze the overtaking manoeuvre for cyclists, and that the traffic microsimulator correctly
Calmax 30.40% 29.40% 1.00% 28.30% 28.90% −0.60% 22.55%
represents this phenomenon.
RMSE 2.8% 3.5%
The K–S tests results for Motor_ATS distributions did not present statistically signifi-
cant differences between
PF is a surrogate observed
measure, andto
easier simulated
measuresamples withto
in the field, a 95% confidence
estimate level at
PTSF. HCM
all validation scenarios.
methodology Average travel
proposes equations speedthe
to calculate of motor vehicles simulated
PTSF depending on traffic and observed
characteris-
tics andwere
means roadcompared
geometry.byPTSF was calculated
a t-test, offering nofor each trafficsignificant
statistically scenario (Table 7). Results
differences with a
onlysignificance
5% depended level
on the(Table
motorized
8). Thevehicle
RMSEtraffic
value in
foreach direction, and
the observed because the scenarios
simulated means of
Motor_ATS was 2.57 km/h.Sustainability 2021, 13, 1235 13 of 17
Table 8. Statistical results for Motor_ATS for the validation scenarios.
Observed Simulated K–S Test t-Test
Scenario N Mean (km/h) N Mean (km/h) Max. Dist. Adm. Dist. p-Value t p-Value
Val1 19 65.18 334 60.84 0.25 1.07 0.207 1.94 0.053
Val2 15 65.78 293 63.26 0.32 1.21 0.106 1.24 0.214
Val3 34 61.47 631 62.06 0.17 0.94 0.341 −0.39 0.694
Val4 27 63.99 477 63.11 0.09 0.44 0.990 0.48 0.629
The observed and simulated TH distributions, at the entrance and exit of the study
segment, were analyzed by a K–S test, obtaining non statistically significant differences
at a 95% confidence level for each validation scenario (Table 9). The RSME values were
calculated at the start and end segment points, obtaining values of 1.40 s and 2.56 s,
respectively.
Table 9. Statistical results for TH and PF at the start and end points for the validation scenarios.
TH Observed TH Simulated TH K–S Test PF
Scenario N Mean (s) N Mean (s) Max. Dist. Adm. Dist. p-Value PF Obs. PF Sim.
Val1 30 29.36 1825 29.00 0.14 0.78 0.571 20.0% 22.0%
Start Val2 20 41.66 1224 42.98 0.11 0.47 0.978 15.0% 14.7%
point Val3 44 19.28 2660 20.03 0.16 1.07 0.202 22.7% 31.1%
Val4 33 25.01 1939 27.33 0.12 0.74 0.645 24.2% 20.8%
Val1 30 30.50 1696 31.12 0.09 0.50 0.964 20.0% 19.0%
End Val2 20 40.53 1149 45.47 0.16 0.70 0.719 20.0% 13.4%
point Val3 44 20.03 2511 21.21 0.08 0.55 0.921 20.5% 26.1%
Val4 33 29.43 1813 29.17 0.16 0.90 0.404 18.2% 18.7%
Table 9 shows the PF values calculated at the start and end points of the segment for
each validation scenario. PF was reduced during the travel, offering better results for the
end point of the segment. The RMSE for PF, at two control points, was less than 5% (4.6%
at the entrance and 4.4% at the end), indicating the validity of the model.
4.4. Influence of Sport Cyclists on Narrow Two-Lane Rural Roads
The first result analyzed was the overtaking duration to each cyclist group (Table 1).
The overtaking duration can be considered as a road safety measure, because on narrow
roads this represents practically all the time spent in the opposing lane, when extreme
hazards are manifested [30]. Groups formed by higher number of cyclists offer higher
durations; for the same number of cyclists, when they ride two-abreast, lower durations
than in-line formations are observed. Therefore, considering that on narrow roads 99%
of overtaking manoeuvres are performed with opposing lane invasion, the two-abreast
configuration is considered safer than in-line. These results agree with López et al. [21],
who concluded that, on narrow roads, cyclists feel safer when riding two-abreast.
The performance measures calculated from field observations were used to determine
the influence of cycle traffic on traffic operation. Only traffic scenarios with lower (Calmin)
and higher cycle traffic (Calmax) were considered, because in these scenarios the motorized
vehicle volume was practically equal and had no influence on the results.
Motorized vehicle average travel speed presented a reduction when cycle traffic in-
creased from Calmin to Calmax (Table 5 and Figure 4). Statistical tests showed a significant
difference between the means and medians of both scenarios at a 95% confidence level. A
K–S test concluded that the two distributions presented statistically significant differences.
This reduction was not excessive, due to the higher speed limit restriction in the studied
segment. This result was inconsistent with Schaefer et al. [31], who concluded that cycle
traffic has a negligible influence from a practical perspective on motorized vehicle speed
when sharing urban roads. This fact can be explained by the reduced differential speedYou can also read