Predicting Vertebral Bone Strength Using Finite Element Analysis for Opportunistic Osteoporosis Screening in Routine Multidetector Computed ...
←
→
Page content transcription
If your browser does not render page correctly, please read the page content below
ORIGINAL RESEARCH
                                                                                                                                            published: 19 January 2021
                                                                                                                                      doi: 10.3389/fendo.2020.526332

                                           Predicting Vertebral Bone Strength
                                           Using Finite Element Analysis for
                                           Opportunistic Osteoporosis
                                           Screening in Routine Multidetector
                                           Computed Tomography Scans—A
                                           Feasibility Study
                                           Nithin Manohar Rayudu 1, Michael Dieckmeyer 2, Maximilian T. Löffler 2, Peter B. Noël 3,
                                           Jan S. Kirschke 2, Thomas Baum 2* and Karupppasamy Subburaj 1
                                           1Engineering Product Development (EPD) Pillar, Singapore University of Technology and Design (SUTD), Singapore,
                                           Singapore, 2 Department of Diagnostic and Interventional Neuroradiology, Klinikum rechts der Isar, Technische Universität
                                           München, Munich, Germany, 3 Department of Radiology, Perelman School of Medicine, University of Pennsylvania,
                                           Philadelphia, PA, United States
                             Edited by:
                   Jonathan H. Tobias,
 University of Bristol, United Kingdom     Purpose: To investigate the feasibility of using routine clinical multidetector computed
                       Reviewed by:        tomography (MDCT) scans for conducting finite element (FE) analysis to predict vertebral
                     Stefano Pagano,
                                           bone strength for opportunistic osteoporosis screening.
            University of Perugia, Italy
                          Phil Salmon,     Methods: Routine abdominal MDCT with and without intravenous contrast medium
            Bruker microCT, Belgium
                                           (IVCM) of seven subjects (five male; two female; mean age: 71.86 ± 7.40 years) without
                  *Correspondence:
                      Thomas Baum
                                           any bone disease were used. FE analysis was performed on individual vertebrae (T11,
               thomas.baum@tum.de          T12, L1, and L2) including the posterior elements to investigate the effect of IVCM and
                                           slice thickness (1 and 3 mm) on vertebral bone strength. Another subset of data from
                   Specialty section:
                                           subjects with vs. without osteoporotic vertebral fractures (n = 9 age and gender-matched
         This article was submitted to
                       Bone Research,      pairs) was analyzed for investigating the ability of FE-analysis to differentiate the two
               a section of the journal    cohorts. Bland-Altman plots, box plots, and coefficient of correlation (R2) were calculated
            Frontiers in Endocrinology
                                           to determine the variations in FE-predicted failure loads for different conditions.
        Received: 13 January 2020
      Accepted: 30 November 2020           Results: The FE-predicted failure loads obtained from routine MDCT scans were strongly
       Published: 19 January 2021
                                           correlated with those from without IVCM (R2 = 0.91 for 1mm; R2 = 0.92 for 3mm slice
                             Citation:     thickness, respectively) and different slice thicknesses (R2 = 0.93 for 1mm vs. 3mm with
         Rayudu NM, Dieckmeyer M,
   Löffler MT, Noël PB, Kirschke JS,        IVCM). Furthermore, a good correlation was observed for 3mm slice thickness with IVCM vs.
     Baum T and Subburaj K (2021)          1mm without IVCM (R2 = 0.87). Significant difference between FE-predicted failure loads of
  Predicting Vertebral Bone Strength
    Using Finite Element Analysis for
                                           healthy and fractured patients was observed (4,705 ± 1,238 vs. 4,010 ± 1,297 N; p=0.026).
Opportunistic Osteoporosis Screening       Conclusion: Routine clinical MDCT scans could be reliably used for assessment of
              in Routine Multidetector
   Computed Tomography Scans—              fracture risk based on FE analysis and may be beneficial for patients who are at increased
                   A Feasibility Study.    risk for osteoporotic fractures.
       Front. Endocrinol. 11:526332.
   doi: 10.3389/fendo.2020.526332          Keywords: multidetector computed tomography, spine, finite element analysis, osteoporosis, opportunistic screening

Frontiers in Endocrinology | www.frontiersin.org                                   1                                       January 2021 | Volume 11 | Article 526332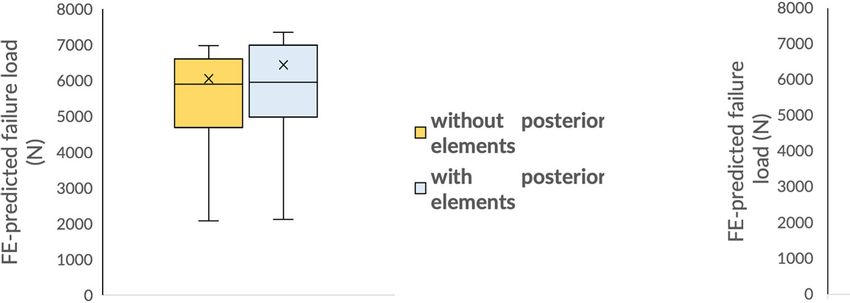
Rayudu et al.                                                                                                                      Opportunistic Screening With Routine Data

INTRODUCTION                                                                               sagitally reformatted with a slice thickness of up to 3 mm to
                                                                                           assess the fracture status at the spine (20, 21).
Osteoporosis is a skeletal disorder that occurs due to bone loss                               The purpose of the current study was to assess the feasibility
and deterioration of bone microarchitecture (1, 2). However,                               of opportunistic osteoporosis screening by finite element
these changes remain undetected until a fragility fracture                                 analysis in routinely acquired MDCT scans. To achieve the
happens and then it significantly affects the quality of life and                           purpose mentioned above, we set out to investigate the
is associated with increased morbidity and mortality (3–6). Thus,                          following objectives:
the assessment of bone health at an early stage of the disease is
crucial in terms of treatment initiation and fracture prevention.                          (1) Compare the failure load predicted by the FE-model
    Currently, dual-energy X-ray absorptiometry (DXA) is                                      generated from 1 and 3mm image data without intravenous
considered as the gold standard for osteoporosis diagnosis (7,                                contrast medium to study the effect of slice thickness,
8). Even though DXA-based aerial bone mineral density (aBMD)                               (2) Compare the failure load predicted by the FE-model
has high clinical relevance, its effectiveness in predicting fragility                        generated from 1 and 3mm image data with and without
fractures is limited (8, 9). Studies have shown that subjects with                            intravenous contrast medium to study the effect of IVCM,
normal aBMD values suffered from osteoporotic fractures and                                   and
vice versa (8, 9). Quantitative computed tomography (QCT) can                              (3) Compare the failure load predicted by the FE-model
be used in place of DXA to measure volumetric BMD from the                                    generated from 1mm without IVCM and 3mm image data
attenuation values using a calibration phantom (10–13).                                       with IVCM to explore the possibility of using routine clinical
Considering the complex three-dimensional microstructure of                                   image data for opportunistic osteoporosis screening.
bone, QCT imaging provides more information required in                                    (4) Compare the failure load predicted by the FE-model
assessing bone quality than DXA (10, 14, 15). Three-                                          generated from subjects with osteoporotic vertebral
dimensional patient-specific finite element (FE) models derived                                 fractures and gender-/age-matched controls to explore the
from medical images (realistic 3D anatomy, heterogeneous                                      feasibility of using FE analysis for differentiating these
material properties mapping based on attenuation values, and                                  cohorts.
loading and boundary conditions to predict response) have been
increasingly used for solving biomechanical-related clinical
problems, including bone strength predictions (16–19).
    Multidetector computed tomography (MDCT) derived                                       MATERIALS AND METHODS
quantitative measures using advanced computational methods,
including texture analysis and patient-specific FE analysis, are                            Figure 1A shows the schematic representation of the
emerging to become clinically relevant metrics in identifying                              methodology followed in generating and analyzing the data to
patients at the risk of having osteoporotic fractures. In the                              study the objectives described in the introduction section. The
literature, most of the studies were performed in research                                 proposed method involves four major sub-sections, namely
settings, where MDCT images are acquired with high                                         MDCT data acquisition, 3D reconstruction of the anatomical
resolution and without intravenously applied contrast medium.                              models from the image data, finite element analysis including
However, in routine clinical settings, MDCT scans are frequently                           meshing, material properties mapping, and applying loading and
acquired with intravenous contrast medium (IVCM) and                                       boundary conditions, and data analysis.

   A                                                                                                                               B

 FIGURE 1 | (A) Schematic representation of the data generation and analysis methodology followed in the study. The vertebrae were delineated on the images
 acquired to generate a 3D model of the geometry to be used in the downstream finite element analysis protocol to predict the bone strength. *IVCM means
 intravenous contrast medium used to acquire contrast enhanced MDCT images. (B) Loading and boundary conditions applied in performing the finite element
 analysis of the full vertebra (with posterior elements). Fixed support represents the zero displacement in all directions at the inferior surface of the vertebral body.
 Displacement load was applied on the superior surface of the vertebral body to predict the failure load.

Frontiers in Endocrinology | www.frontiersin.org                                       2                                         January 2021 | Volume 11 | Article 526332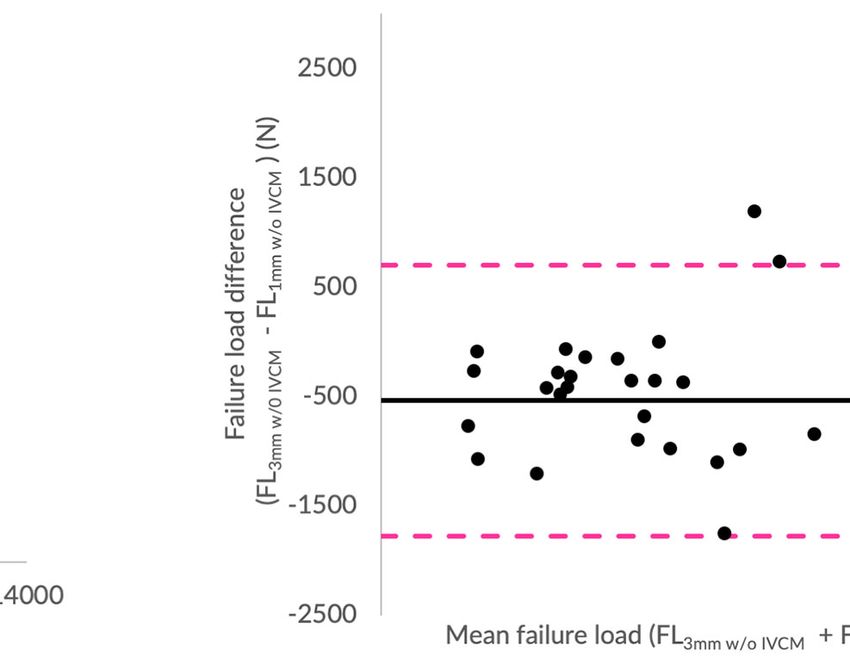
Rayudu et al.                                                                                                        Opportunistic Screening With Routine Data

Subjects                                                                        fractured were acquired using a 256-row scanner (iCT, Philips
This retrospective study was reviewed and approved by the local                 Healthcare, Best, the Netherlands). The scanning parameters, as
institutional review board. Due to retrospective nature, the ethics             well as the protocol for administering intravenous contrast
committee waived the requirement of written informed consent                    medium, are the same as mentioned above. Sagittal reformations
for participation.                                                              of the spine were reconstructed with a slice thickness of 3 mm.
    For investigating the effects of posterior elements, slice thickness,       Vertebrae for this sub-analysis (L1–L4; a total of n = 27 vertebrae in
and IVCM, a total of seven subjects (five males and two females,                 each cohort) were segmented, and the presence of vertebral
median age: 71.86 ± 7.40 years) who underwent routine abdominal                 fractures was determined and documented by a board-certified
MDCT were included in this study, as outlined previously (20).                  radiologist using the sagittal reformations of the spine.
Subjects with known history of bone pathologies, including
metastases, spine fractures, metabolic, or hematological disorders              Finite Element Modeling
aside from osteoporosis were excluded. Patients who underwent                   The acquired non-contrast-enhanced and contrast-enhanced
routine non-contrast abdominal MDCT and immediately followed                    MDCT images along with segmented 3D masks for vertebrae
contrast-enhanced abdominal MDCT at our institution were                        were imported to the medical image analysis software program,
retrospectively identified by a board-certified radiologist in our                Mimics (Materialise NV, Leuven, Belgium), for downstream
institution’s digital image archive (PACS).                                     image analysis. The segmented mask data of each vertebra
    To explore the feasibility of using finite element analysis for              were converted into a 3D geometric model before importing
differentiating healthy from the fractured cohort, a group of subjects          into 3-Matic software program (Materialise NV, Leuven,
with osteoporotic vertebral fractures (nf = 9; four males, five females,         Belgium) to generate finite element mesh using a linear
mean age: 75.44 ± 10.19 years) and gender-/age-matched healthy                  tetrahedral element (C3D4 in Abaqus element library). Once
controls without vertebral fracture (nh = 9; four males, five females;           the meshing was performed, material properties of the vertebra
mean age: 71.44 ± 10.05 years) were included. Patients with                     were derived based on the density (r)—HU and density (r)—
osteoporotic vertebral fractures were retrospectively identified by a            elastic modulus (E) relationship, shown in Table 1, and then
board-certified radiologist based on the available routine abdominal             mapped onto the finite element mesh.
contrast enhanced MDCT scan data in our institution’s digital                       Also, for producing mesh-independent solution, we have
image archive (PACS). These patients had a history of cancer (such              performed mesh sensitivity analysis by varying the maximum
asesophageal, colorectal, or breast cancer). They underwent the                 edge length from 1.0 to 3.0 mm with an interval of 0.5 mm (1.0-,
MDCT examination as long-term follow-up to rule out                             1.5-, 2.0-, 2.5-, and 3.0-mm sizes were considered). The analysis
tumor recurrence.                                                               showed that 2 mm element edge length produced mesh-
                                                                                independent solution based on failure load convergence and
Multidetector Computed Tomography                                               the same was used in all the developed finite element models for
Imaging                                                                         further analysis.
Subjects identified for investigating the effects of posterior
elements, slice thickness, and IVCM underwent abdominal                         Failure and Displacement Load Analysis
non-contrast-enhanced MDCT scans, immediately followed by                       The meshed and material mapped model was exported from the
contrast-enhanced MDCT scans at a 64-row MDCT scanner                           Mimics in the Abaqus input format (*.inp). This file was then
(Somatom Sensation Cardiac 64, Siemens Medical Solution,                        imported to a commercial finite element analysis software,
Erlangen, Germany). The scanning parameters were 120 kVp                        Abaqus ver. 6.10 (Hibbitt, Karlsson, and Sorensen, Inc.,
of tube voltage, 200 mAs of adapted tube load averaged, and                     Pawtucket, RI, USA) and the loading and displacement
0.6 mm of collimation. Acquired data were sagitally reformatted                 boundary conditions for the 3D vertebra model were applied
and reconstructed with slice thicknesses of 1 and 3mm, since the
spine image reformations with a sagittal slice thickness of 3mm
are the standard in clinical routine at our hospital. Intravenous               TABLE 1 | Vertebral bone material mapping relations used in the current finite
contrast medium (Iomeron 400, Bracco, Konstanz, Germany)                        element study (22).
was administered through high-pressure injector (Fresenius Pilot                Property                                       Mapping relations
C, Fresenius Kabi, Bad Homburg, Germany). The intravenous
contrast medium injection was carried out with a delay of 70 s, a               Apparent density (rapp)            rapp = 47 + 1.122 * HU HU—Hounsfield unit
flow rate of 3 ml/s, and a body weight-dependent dose (80 ml for                 Ash density (rash)                 rash= 0.6 * rapp
                                                                                Elastic modulus (E)                Ez = -349 + 5.82 * rapp
bodyweight up to 80 kg, 90 ml for bodyweight up to 100 kg, and                                                     Ex= Ey = 0.333 Ez
100 ml for bodyweight over 100 kg). Segmentations of the                                                           Z-axial direction of the vertebra
vertebrae (T11 to L2; a total of n = 28 vertebrae) were                         Shear modulus (G)                  Gxy = 0.121 Ez
performed by a radiologist using MITK (Medical Imaging                                                             Gxz = Gyz = 0.157 Ez
                                                                                Maximum principal stress           s = 137 * rash 1.88, rash < 0.317
Interaction Toolkit; www.mitk.org) software program for these
                                                                                limit (s)                          s = 114 * rash 1.72, rash > 0.317
sub-analyses.                                                                   Plastic strain (ϵAB)               ϵAB = -0.00315 + 0.0728 rash
   MDCT scans for the subjects identified to explore the                         Minimum principal stress           smin = 65.1 * rash 1.93
feasibility of using FE analysis to differentiate healthy from the              limit (smin)

Frontiers in Endocrinology | www.frontiersin.org                            3                                       January 2021 | Volume 11 | Article 526332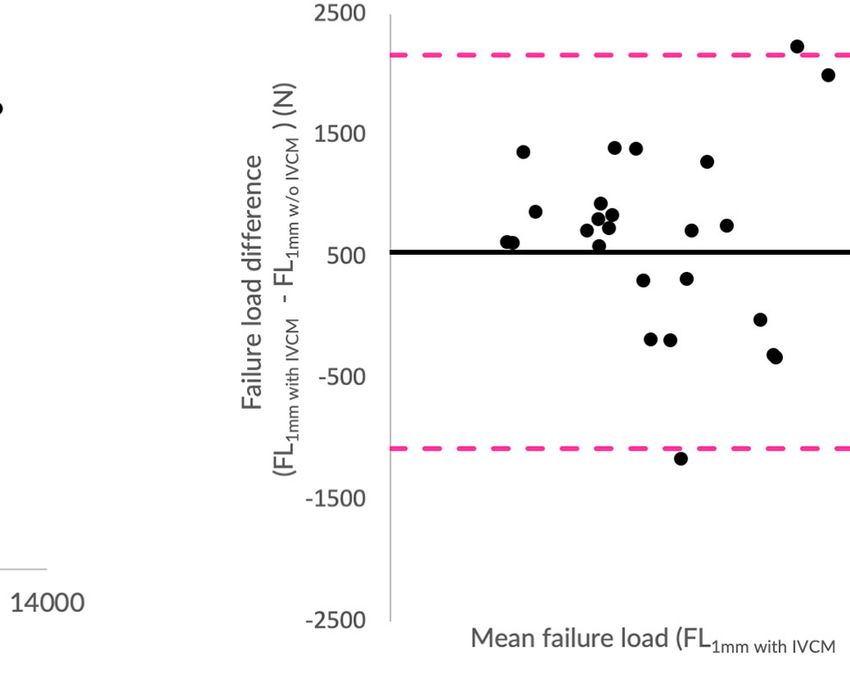
Rayudu et al.                                                                                                               Opportunistic Screening With Routine Data

and the model is analyzed. In this study, the vertebra was                            RESULTS
subjected to compression load and simulated to obtain the
failure load (16, 22). The inferior surface of the vertebral body                     Effect of Vertebral Posterior Elements on
was fully constrained in all the directions and then a                                Finite Element-Predicted Failure Load
displacement load was applied on the superior surface of the                          Considering many of the FE studies reported in the literature
vertebral body, as shown in Figure 1B. Transversely isotropic                         only included the vertebral body for the strength prediction of
properties were given to the vertebra and the failure load was                        the vertebra, we analyzed a sub-cohort of seven subjects T11
calculated. The failure load was defined as the peak of the force-                     vertebra with and without posterior elements to study its effect
displacement curve and it was considered as the bone strength                         on the FE-predicted failure load. The results showed a significant
(16, 22).                                                                             difference of 5.13 ± 3.05% (p
Rayudu et al.                                                                                                               Opportunistic Screening With Routine Data

different slice thicknesses (1mm w/o IVCM vs. 1mm with IVCM and                       MDCT images with different slices thicknesses (1 and 3 mm) and
3mm w/o IVCM vs. 3mm with IVCM, respectively). Correlations                           with and without contrast medium (IVCM). FE-predicted failure
between FE-predicted failure loads based on the images with and                       loads with different slice thicknesses (1mm vs. 3mm w/o IVCM;
without IVCM were high at both, 1mm (R²=0.91) and 3mm slice                           1mm vs. 3mm with IVCM) were found to be highly correlated in
thickness (R²=0.92). To assess the relationship between FE-predicted                  both instances of with (R²=0.93) and without contrast medium
failure loads obtained from the models of data acquired with and                      (R²=0.95). The interaction between slice thickness and contrast
without IVCM, we plotted the difference between failure loads of                      medium on the predicted failure loads was not significant
these two instances against the mean of them. Figures 3B, D show                      (p>0.05). To assess the relationship between FE-predicted
the Bland-Altman plots of FE-predicted failure loads obtained from                    failure loads obtained from the models developed from the
images with and without IVCM with two different slices thicknesses,                   image data acquired at different slice thicknesses (1 and 3mm),
1 and 3mm, respectively. A positive bias (540 N for 1mm and 850 N                     we plotted the difference between failure loads of these two
for 3mm) toward the data obtained with IVCM than without was                          instances against the mean of them. Figures 4B, D show the
evident in both plots (different slice thicknesses) and the data spread               Bland-Altman plots of FE-predicted failure loads obtained from
on both sides of the mean line appeared to be even in both plots.                     images at two different slice thickness and with and without
                                                                                      IVCM, respectively. A negative bias (−538 N for without IVCM
Effect of Slice Thicknesses on Finite                                                 and −228 N for with IVCM) toward the data obtained with 3mm
Element-Predicted Failure Load                                                        than 1 mm was evident in both the plots (with and w/o IVCM)
Figures 4A, C show the correlations between failure load values                       and the data spread on both sides of the mean line appeared to be
predicted by the FE analysis of the vertebrae modeled from                            even in both the plots.

                A                                                                     B

                C                                                                     D

 FIGURE 3 | Effect of intravenous contrast medium (IVCM) on finite element (FE)-predicted failure load values. (A) Correlation plot between FE-predicted failure load
 values for 1mm with and without IVCM, (C) correlation plot between FE-predicted failure load values for 3mm with and without IVCM, and (B, D) Bland Altman plots
 representing the mean of FE-predicted failure load values versus difference between them in 1 and 3mm scan settings, respectively. Horizontal lines represent mean
 and dashed line ±1.96 standard deviation. FL represents FE-predicted vertebral failure load (N).

Frontiers in Endocrinology | www.frontiersin.org                                  5                                       January 2021 | Volume 11 | Article 526332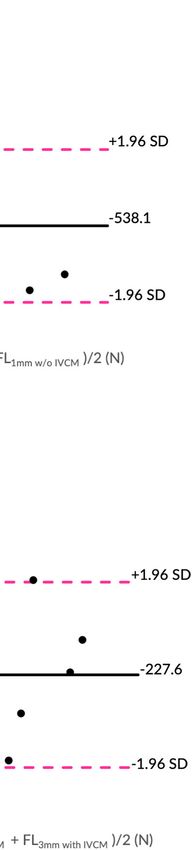
Rayudu et al. Opportunistic Screening With Routine Data
A B
C D
FIGURE 4 | Effect of slice thickness on finite element (FE)-predicted failure load values. (A) Correlation plot between FE-predicted failure load values for 1 and 3mm
without intravenous contrast medium (IVCM), (C) correlation plot between FE-predicted failure load values for 1 and 3mm with IVCM, and (B, D) Bland Altman plots
representing the mean of FE-predicted failure load values versus difference between them in with and without IVCM scan settings, respectively. Horizontal lines
represent mean and dashed line ±1.96 standard deviation. FL represents FE-predicted vertebral failure load (N).
A B
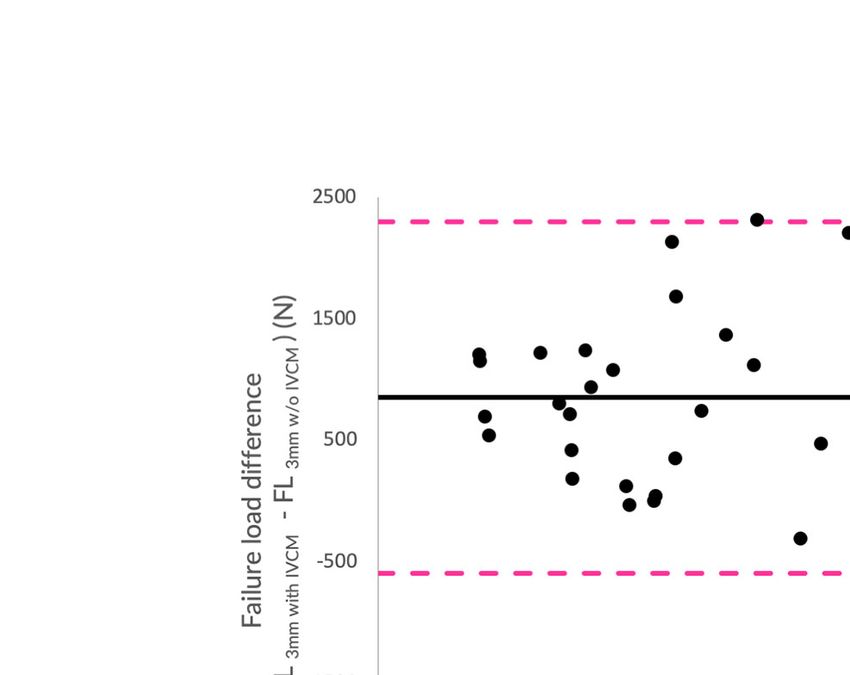
FIGURE 5 | Routine clinical image data for finite element (FE)-Analysis. (A) Correlation plot between FE-predicted failure load values for high-resolution and routine
image data, and (B) Bland Altman plot representing the mean of FE-predicted failure load values versus difference between them in for high-resolution and routine
image data scan settings, respectively. Horizontal lines represent mean and dashed line ±1.96 standard deviation. FL represents FE-predicted vertebral failure load (N).
Frontiers in Endocrinology | www.frontiersin.org 6 January 2021 | Volume 11 | Article 526332Rayudu et al. Opportunistic Screening With Routine Data
Feasibility of Using Routine Clinical Image from partial volume effects. In this study, we observed that the
Data for Finite Element Analysis increase in slice thickness from 1 to 3mm resulted in a slightly
Figure 5A shows the correlations between failure load values lower FE-predicted failure load, but with a strong correlation.
predicted by the FE analysis of the vertebrae modeled from 1mm This variation could be attributed to the process of generating the
slice thickness w/o IVCM vs. 3mm slice thickness with IVCM. 3D geometric model of the anatomy from the segmented masks,
We found that the correlation between FE-predicted failure loads which may have contributed to a difference in the overall volume
from routine clinical data and high-resolution data was high of the model (26, 27). The stronger correlation with bias
(R²=0.87). To assess the relationship between FE-predicted indicates only a shift in the predicted values while following
failure loads obtained from the models generated from these the same trend. This result suggests that the FE-predicted failure
image data, we plotted the difference between failure loads of load value for the models generated from the image data with a
these two instances against the mean of them. Figure 5B shows higher slice thickness possibly be lower than the one with thinner
the Bland-Altman plot of FE-predicted failure loads. A positive slice thickness and corrections may be needed to account for
bias (341 N) toward the values obtained from the routine clinical when using the value for diagnostic purpose or extrapolating it
data than high-resolution data was evident in the plot and the for other analyses.
data spread on both sides of the mean line appeared to be even. FE-predicted failure loads obtained from the models
generated from the image data acquired with and without
Feasibility of Using Finite Element Analysis contrast medium were strongly correlated. However, despite
for Differentiating Healthy and Fractured the stronger correlations between them, the values predicted
Cohort from the data with IVCM were slightly higher at both instances
We analyzed a sub-cohort of nine subjects (with/without vertebral with two different slice thicknesses (1 and 3mm). In routine
fractures) of depicted vertebrae (L1–L4) to explore the feasibility of clinical scans, intravenous contrast medium is administered
using FE analysis of routine clinical MDCT images in differentiating before the CT scan to improve the image contrast and
healthy and fractured patients. The results showed a significant detection of pathological findings, thus improving the
difference in FE-predicted failure load (4,705 ± 1,238 N for healthy diagnostic accuracy. Studies have shown that the contrast
and 4,010 ± 1,297 N for fractured patients; p=0.026) (Figure 2B), medium absorbed by the vertebral body increases the signal
indicating the vertebrae in the healthy cohort have a higher failure intensity, which affects the material mapping step of the FE
load than in the fractured cohort. analysis workflow (28–30). In addition, the interplay of slice
thickness (partial volume effect) and contract-enhancement
(signal intensity) in the routine clinical MDCT images can
DISCUSSION have effect on the material properties assigned based on the
image data and reconstructed geometric model of the anatomy
In the current study, we evaluated the feasibility of using routine for downstream finite element analysis to predict bone strength,
clinical MDCT data to generate finite element models for the which has not been studied extensively in the literature (10, 31).
opportunistic assessment of osteoporotic fracture risk based on Thus, we can conclude from these results that there is a slight
FE-predicted vertebral strength. In routine clinical diagnostic image increase in the value predicted from the image data acquired with
acquisition settings, MDCT image data is frequently reconstructed contrast medium than the one without independent of slice
with a larger slice thickness and acquired with intravenous contrast thickness while following the same trend. This finding is
medium administered. Our results suggest that the FE-predicted consistent with opportunistic BMD assessment in contrast-
vertebral failure loads obtained from routine MDCT data, i) with enhanced MDCT (32–34).
contrast medium were slightly higher but strongly correlated with Opportunistic analysis of fracture risk using MDCT scans
the values derived from the data without IVCM (R2 = 0.91 for 1mm; acquired for other purposes would reduce costs and radiation
R2 = 0.92 for 3mm) and ii) with a larger slice thickness were slightly exposure. Moreover, it would allow conducting big retrospective
lower but strongly correlated with the values derived from the data clinical studies and analyses (20, 35, 36). Any abdominal, chest,
with a smaller slice thickness (R2 = 0.93 for 1mm vs. 3mm with or head and neck scan could be suitable for vertebral strength
IVCM). The routine clinical image data with IVCM also showed a assessment. Recently, Schwaiger et al. demonstrated the
high correlation with the high-resolution image data without IVCM feasibility of using retrospective positron emission tomography
(R2 = 0.87 for 3mm with IVCM vs. 1mm w/o IVCM). Furthermore, with computed tomography (PET/CT) data to opportunistically
a considerable difference was observed between the FE-predicted evaluate bone density and strength in men with prostate cancer
failure loads of healthy and fractured cohort (4,705 ± 1,238 N vs. (35). Mookiah et al. demonstrated the feasibility of using
4,010 ± 1,297 N; p=0.026). Thus, the routine clinical data could abdominal MDCT scans for evaluating bone quality using
potentially be used for opportunistic assessment of osteoporotic image textural parameters (20). These studies have demonstrated
fracture risk based on FE-predicted vertebral strength in patients the feasibility that additional information that can be extracted
who are at risk for osteoporotic fractures such as cancer from the scans acquired for other purposes, without the extra
patients (24). burden of radiation and scan time, to assist the clinician in making
In routine clinical settings, high slice thickness is used due to clinical decisions. In this study, we have evaluated the feasibility of
its advantages like reduced image noise (25). However, it suffers using routinely acquired clinical image data for the diagnostic
Frontiers in Endocrinology | www.frontiersin.org 7 January 2021 | Volume 11 | Article 526332Rayudu et al. Opportunistic Screening With Routine Data
purpose (3mm slice thickness with contrast medium) to generate algorithms have to be applied for widespread clinical use in the
finite element model of the anatomy, map the material properties future. Second, this pilot study was carried out with a relatively
based on the image intensity, and simulate to predict the bone small cohort size, which may have contributed to the higher
strength of the specific patient. Our results suggest that the FE- variations observed in some of the analyses performed. Future
predicted failure load values from the routine clinical data are in studies have to evaluate the performance of opportunistic FE
very good correlation (R2 = 0.87) with the one predicted from the analysis in clinical routine MDCT data to predict incidental
high-resolution image data. However, a slight positive bias toward fractures in a longitudinal setting. Third, there were some
the routine data was evident and the predicted failure load values outliers in observed failure load in all cases in both with/
are on the higher side than the high-resolution data. This result without contrast medium and with different slice thickness,
suggests that, with adjustment, the routine clinical data can which may have contributed to computing correlations and
potentially be used to conduct downstream finite element analysis. affected the comparison. Fourth, large differences between the
Osteoporotic vertebral fractures are a significant determinant FE-predicted failure load values were observed for a few subjects.
of the quality of life in the elderly, including increased back pain, This may be due to observed higher material stiffness in those,
impairment of mobility, and functional limitations on which may have resulted in a higher failure load under current
performing activities of daily living (37). Identifying subjects loading configuration. Fifth, in this study, we have considered
who are at the risk of having vertebral fractures is a crucial step in only static compression loading configuration for comparison
disease management and treatment. The effectiveness of dual- purposes; however, in other loading configurations, the FE-
energy X-ray absorptiometry (DXA)-derived areal bone mineral predicted failure load values and the differences among the
density (aBMD), a standard osteoporosis diagnostic tool, in models may vary. Sixth, the observed bias in this study could
differentiating patients with fracture risk and monitoring be influenced when we expand to a larger dataset acquired in
treatment effect is limited (8, 9). Vertebral strength measures different scanners and site locations by variations in scanning
derived from validated FE modeling and analysis have shown parameters (gantry tilt, tube voltage, reconstruction kernel, and
potential in assessing fracture risk and detecting short-term slice orientation) and intravenous contrast application (time
treatment efficacy (16, 18, 22, 38, 39). In this study, we have interval) (20, 52, 53). Seventh, the variations in the material
explored the feasibility of using FE models generated from strength data from Hounsfield value due to partial volume effect
routine clinical image data in differentiating healthy from the is not considered in the current study.
fractured cohort. Our results suggest that there is a significant In conclusion, we have demonstrated the feasibility of using
difference in the observed FE-predicted failure loads between routine clinical MDCT scans to generate finite element (FE)
healthy and fractured (4,705 ± 1,238 N vs. 4,010 ± 1,297 N; models for the opportunistic assessment of osteoporotic fracture
p=0.026). Besides, the predicted values are well within the range risk based on FE-predicted vertebral strength. We found stronger
obtained from the research-level image data, as reported in the correlations between the FE-predicted bone strength measures
literature (16, 22). Thus, we can conclude from the results that derived from the images with different slice thicknesses and with
the FE based measures could be used to assess fracture risk and and without intravenous contrast medium with some bias. Thus,
differentiate the healthy and fractured cohorts. routine clinical MDCT scans and retrospective scan data could be
The vertebral bone has two major load-bearing elements, i.e., exploited for opportunistic screening for patients with increased
vertebral body and posterior elements (facet joints). The majority risk for osteoporotic fracture using finite element analysis.
of the reported studies have analyzed the vertebrae by modeling
only the vertebral body due to difficulties and time associated
with segmenting the posterior elements (22, 40, 41). However, DATA AVAILABILITY STATEMENT
advances in automated vertebrae segmentation algorithms,
including artificial intelligence-driven ones, significantly reduced The raw data supporting the conclusions of this article will be
those issues (42–45). Considering approximately 10% of the load made available by the authors, without undue reservation.
on the vertebral column transferred through the facet joints and
posterior elements (46–48), we contend that it should be included
in quantifying the strength of a vertebra. In this study, we have ETHICS STATEMENT
observed that the FE-predicted failure load values are higher when
the posterior elements are included. Recent finite element studies The studies involving human participants were reviewed and
(49–51) have shown improved accuracy in calculating vertebral approved by Technische Universität München institute review
bone strength through finite element analysis when the posterior board. The ethics committee waived the requirement of written
elements are included in the analysis compared to not. Thus, for informed consent for participation.
accurate calculation of failure load, the analysis should consider
including the posterior elements in the model.
There are some associated limitations of the study which AUTHOR CONTRIBUTIONS
have to be taken into account when interpreting the results
obtained. First, the segmentation of the vertebrae was performed NR, MD, ML, PN, JK, TB, and SK contributed conception and
manually, which was time-consuming. Automated segmentation design of the study; SK and TB supervised the work; NR
Frontiers in Endocrinology | www.frontiersin.org 8 January 2021 | Volume 11 | Article 526332Rayudu et al. Opportunistic Screening With Routine Data
performed the finite element analysis; SK and NR performed FUNDING
statistical analysis; SK and NR wrote the first draft of the
manuscript. All authors contributed to manuscript revision, This work was supported by grants of the German Research
read and approved the submitted version. All authors Foundation Project 32290010 (to JK, TB, and PN) and SGP
contributed to the article and approved the submitted version. Healthcare Fund, PIE-SGP-HC-2019-01 (Thrust 3-2) (to KS).
19. Cody DD, Gross GJ, Hou FJ, Spencer HJ, Goldstein SA, Fyhrie DP. Predicted
REFERENCES by finite element models than Femoral strength is better predicted by finite
1. Kanis JA, McCloskey EV, Johansson H, Oden A, Melton LJ, Khaltaev N. A element models. J Biomech (1999) 32:1013–20. doi: 10.1016/S0021-9290(99)
reference standard for the description of osteoporosis. Bone (2008) 42:467–75. 00099-8
doi: 10.1016/j.bone.2007.11.001 20. Mookiah MRK, Rohrmeier A, Dieckmeyer M, Mei K, Kopp FK, Noel PB, et al.
2. Drake MT, Clarke BL, Lewiecki EM. The Pathophysiology and Treatment of Feasibility of opportunistic osteoporosis screening in routine contrast-
Osteoporosis. Clin Ther (2015) 37:1837–50. doi: 10.1016/j.clinthera.2015.06.006 enhanced multi detector computed tomography (MDCT). Osteoporos Int
3. Magaziner J. Changes in Functional Status Attributable to Hip Fracture: A (2018) 29:825–35. doi: 10.1007/s00198-017-4342-3
Comparison of Hip Fracture Patients to Community-dwelling Aged. Am J 21. Müller D, Bauer JS, Rummeny EJ, Link TM. Significance of sagittal
Epidemiol (2003) 157:1023–31. doi: 10.1093/aje/kwg081 reformations in routine thoracic and abdominal multislice CT studies for
4. Bliuc D, Alarkawi D, Nguyen TV, Eisman JA. Risk of Subsequent Fractures detecting osteoporotic fractures and other spine abnormalities. Eur Radiol
and Mortality in with and without Osteoporotic Bone Density: The Dubbo (2008) 18:1696–702. doi: 10.1007/s00330-008-0920-2
Osteoporosis Epidemiology Study. J Bone Miner Res (2015) 4:637–46. 22. Anitha D, Thomas B, Jan KS, Subburaj K. Risk of vertebral compression
doi: 10.1002/jbmr.2393 fractures in multiple myeloma patients. Medicine (Baltimore) (2017) 96:e5825.
5. Oskar S, Borgström F, Zethraeus N, Johnell O, Ponzer S, Svensson O, et al. Long- doi: 10.1097/MD.0000000000005825
term cost and effect on quality of life of osteoporosis-related fractures in Sweden 23. Bland JM, Altman DG. Measuring agreement in method comparison studies.
Long-term cost and effect on quality of life of osteoporosis-related fractures in Stat Methods Med Res (1999) 8:135–60. doi: 10.1191/096228099673819272
Sweden. Acta Orthop (2008) 79:269–80. doi: 10.1080/17453670710015094 24. Guise TA. Bone Loss and Fracture Risk Associated with Cancer Therapy.
6. Papaioannou A, Giangregorio L, Kvern B, Boulos P, Ioannidis G, Adachi JD. Oncologist (2006) 11:1121–31. doi: 10.1634/theoncologist.11-10-1121
The osteoporosis care gap in Canada. BMC Musculoskelet Disord (2004) 5:1– 25. Alshipli M, Kabir NA. Effect of slice thickness on image noise and diagnostic
6. doi: 10.1186/1471-2474-5-11 content of single-source-dual energy computed tomography. J Phys Conf Ser
7. Blake GM, Fogelman I. An Update on Dual-Energy X-Ray Absorptiometry. (2017) 851:0–6. doi: 10.1088/1742-6596/851/1/012005
Semin Nucl Med (2010) 40:62–73. doi: 10.1053/j.semnuclmed.2009.08.001 26. Rathnayaka K, Sahama T, Schuetz MA, Schmutz B. Effects of CT image
8. Choksi P, Jepsen KJ, Clines GA. The challenges of diagnosing osteoporosis segmentation methods on the accuracy of long bone 3D reconstructions. Med
and the limitations of currently available tools. Clin Diabetes Endocrinol Eng Phys (2011) 33:226–33. doi: 10.1016/j.medengphy.2010.10.002
(2018) 4:1–13. doi: 10.1186/s40842-018-0062-7 27. Gelaude F, Vander Sloten J, Lauwers B. Accuracy assessment of CT-based
9. Schuit SCE, Van Der Klift M, Weel AEAM, De Laet CEDH, Burger H, Seeman E, outer surface femur meshes. Comput Aided Surg (2008) 13:188–99.
et al. Fracture incidence and association with bone mineral density in elderly men doi: 10.1080/10929080802195783
and women: The Rotterdam Study. Bone (2004) 34:195–202. doi: 10.1016/ 28. Liebl H, Garcia EG, Holzner F, Noel PB, Burgkart R. In-vivo assessment of
j.bone.2003.10.001 femoral bone strength using finite element analysis (FEA) based on routine
10. Brett AD, Brown JK. Quantitative computed tomography and opportunistic MDCT imaging: A preliminary study on patients with vertebral fractures. PloS
bone density screening by dual use of computed tomography scans. J Orthop One (2015) 10. doi: 10.1371/journal.pone.0116907
Transl (2015) 3:178–84. doi: 10.1016/j.jot.2015.08.006 29. Link TM. Osteoporosis imaging: State of the art and advanced imaging.
11. Malekzadeh M, Abbasi-rad S, Shahgholi M, Naghdi P, Hoseini MS, Yazdi NA. Design Radiology (2012) 263:3–17. doi: 10.1148/radiol.12110462
and Validation of Synchronous QCT Calibration Phantom: Practical Methodology. 30. Oei L, Koromani F, Rivadeneira F, Zillikens MC, Oei EHG. Quantitative
J Med Imaging Radiat Sci (2019) 50:157–62. doi: 10.1016/j.jmir.2018.10.002 imaging methods in osteoporosis. Quant Imaging Med Surg (2016) 6:680–98.
12. Lenchik L, Weaver AA, Ward RJ, Boone JM, Boutin RD, Ward RJ, et al. doi: 10.21037/qims.2016.12.13
Opportunistic Screening for Osteoporosis Using Computed Tomography: 31. Klein MA. Lumbar spine evaluation: Accuracy on abdominal CT. Br J Radiol
State of the Art and Argument for Paradigm Shift. Curr Rheumatol Rep (2018) (2017) 90:20170313. doi: 10.1259/bjr.20170313
21:74. doi: 10.1007/s11926-018-0784-7 32. Baum T, Müller D, Dobritz M, Rummeny EJ, Link TM, Bauer JS. BMD
13. Löffler MT, Sollmann N, Mei K, Valentinitsch A, Noël PB, Kirschke JS, et al. measurements of the spine derived from sagittal reformations of contrast-
X-ray-based quantitative osteoporosis imaging at the spine. Osteoporos Int enhanced MDCT without dedicated software. Eur J Radiol J (2011) 80:140–5.
(2019) 1–18. doi: 10.1007/s00198-019-05212-2 doi: 10.1016/j.ejrad.2010.08.034
14. Li N, Li X, Xu L, Sun W, Cheng X, Tian W. Comparison of QCT and DXA: 33. Baum T, Muller D, Dobritz M, Wolf P, Rummeny EJ, Link TM, et al.
Osteoporosis Detection Rates in Postmenopausal Women. Int J Endocrinol Converted Lumbar BMD Values Derived from Sagittal Reformations of
(2013) 5–10. doi: 10.1155/2013/895474 Contrast-Enhanced MDCT Predict Incidental Osteoporotic Vertebral
15. Masala S, Tarantino U, Marinetti A, Aiello N, Fiori R, Sorge RP, et al. DXA vs . Fractures. Calcif Tissue Int (2012) 90:481–7. doi: 10.1007/s00223-012-9596-3
QCT: in vitro and in vivo studies. Acta Diabetol (2003) 86–8. doi: 10.1007/ 34. Pompe E, Willemink MJ, Dijkhuis GR, Verhaar HJJ, Hoesein FAAM, Jong
s00592-003-0035-9 PAD. Intravenous contrast injection significantly affects bone mineral
16. Anitha D, Subburaj K, Mei K, Kopp FK, Foehr P, Noel PB, et al. Effects of dose density measured on CT. Eur Radiol (2015) 25:283–9. doi: 10.1007/
reduction on bone strength prediction using finite element analysis. Sci Rep s00330-014-3408-2
(2016) 6:1–9. doi: 10.1038/srep38441 35. Schwaiger BJ, Kopperdahl DL, Nardo L, Facchetti L, Gersing AS, Neumann J,
17. Anitha D, Kim KJ, Lim SK, Lee T. Implications of local osteoporosis on the et al. Vertebral and femoral bone mineral density and bone strength in prostate
efficacy of anti-resorptive drug treatment: A 3-year follow-up finite element cancer patients assessed in phantomless PET / CT examinations. Bone (2017)
study in risedronate-treated women. Osteoporos Int (2013) 24:3043–51. 101:62–9. doi: 10.1016/j.bone.2017.04.008
doi: 10.1007/s00198-013-2424-4 36. Ziemlewicz TJ, Binkley N, Lubner MG, Pickhardt PJ. Opportunistic
18. Crawford RP, Cann CE, Keaveny TM. Finite element models predict in vitro Osteoporosis Screening: Addition of Quantitative CT Bone Mineral Density
vertebral body compressive strength better than quantitative computed Evaluation to CT Colonography Timothy. J Am Coll Radiol (2015) 12:1036–
tomography. Bone (2003) 33:744–50. doi: 10.1016/S8756-3282(03)00210-2 41. doi: 10.1016/j.jacr.2015.04.018
Frontiers in Endocrinology | www.frontiersin.org 9 January 2021 | Volume 11 | Article 526332Rayudu et al. Opportunistic Screening With Routine Data
37. Allaire BT, Lu D, Johannesdottir F, Kopperdahl D, Keaveny TM, Jarraya M, 47. Jaumard NV, Welch WC, Winkelstein BA. Spinal facet joint biomechanics
et al. Prediction of incident vertebral fracture using CT-based finite element and mechanotransduction in normal, injury and degenerative conditions.
analysis. Osteoporos Int (2018) 30:323–31. doi: 10.1007/s00198-018-4716-1 J Biomech Eng (2011) 133:1–31. doi: 10.1115/1.4004493
38. Ward J, Wood C, Rouch K, Pienkowski D, Malluche HH. Stiffness and 48. Frost BA, Camarero-Espinosa S, Johan Foster E. Materials for the spine:
strength of bone in osteoporotic patients treated with varying durations of oral Anatomy, problems, and solutions. Materials (Basel) (2019) 12:1–41.
bisphosphonates. Osteoporos Int (2016) 27:2681–8. doi: 10.1007/s00198-016- doi: 10.3390/ma12020253
3661-0 49. Whyne CM, Hu SS, Klisch S, Lotz JC. Effect of the pedicle and posterior arch
39. Kopperdahl DL, Aspelund T, Hoffmann PF, Siggeirsdottir K, Harris TB, on vertebral body strength predictions in finite element modeling. Spine (Phila
Gudnason V, et al. Assessment of incident spine and hip fractures in women Pa) (1998) 1976). 23:899–907. doi: 10.1097/00007632-199804150-00011
and men using finite element analysis of CT scans. J Bone Miner Res (2014) 50. Du CF, Yang N, Guo JC, Huang YP, Zhang C. Biomechanical response of
29:570–80. doi: 10.1002/jbmr.2069 lumbar facet joints under follower preload: A finite element study. BMC
40. Rayudu NM, Anitha DP, Mei K, Zoffl F, Kopp FK, Sollmann N, et al. Low- Musculoskelet Disord (2016) 17:1–13. doi: 10.1186/s12891-016-0980-4
dose and sparse sampling MDCT-based femoral bone strength prediction 51. Cai X, Sun M, Huang YP, Liu ZX, Liu CJ, Du CF, et al. Biomechanical Effect of
using finite element analysis. Arch Osteoporos (2020) 15:17. doi: 10.1007/ L4–L5 Intervertebral Disc Degeneration on the Lower Lumbar Spine: A Finite
s11657-020-0708-9 Element Study. Orthop Surg (2020) 12:917–30. doi: 10.1111/os.12703
41. Christiansen BA, Kopperdahl DL, Kiel DP, Keaveny TM, Bouxsein ML. 52. Anitha D, Mei K, Dieckmeyer M, Kopp FK, Sollmann N, Zimmer C, et al.
Mechanical contributions of the cortical and trabecular compartments MDCT-based Finite Element Analysis of Vertebral Fracture Risk: What Dose is
contribute to differences in age-related changes in vertebral body strength Needed? Clin Neuroradiol (2018) 29:645–51. doi: 10.1007/s00062-018-0722-0
in men and women assessed by QCT-based finite element analysis. J Bone 53. Nithin MR, Subburaj K, Dieckmeyer M, Jan SK, Noel PB, Baum T. MDCT-
Miner Res (2011) 26:974–83. doi: 10.1002/jbmr.287 based Vertebral Bone Strength Prediction using Finite Element Analysis: how
42. Galbusera F, Casaroli G, Bassani T. Artificial intelligence and machine low can we go? Front Endocrinol (Lausanne) (2020) 1–4. doi: 10.3389/
learning in spine research. Jor Spine (2019) 2:1–20. doi: 10.1002/jsp2.1044 fendo.2020.00442
43. Rehman F, Ali Shah SI, Riaz N, Gilani SO. A Robust Scheme of Vertebrae
Segmentation for Medical Diagnosis. IEEE Access (2019) 7:120387–98. Conflict of Interest: The authors declare that the research was conducted in the
doi: 10.1109/access.2019.2936492 absence of any commercial or financial relationships that could be construed as a
44. Löffler MT, Sekuboyina A, Jacob MEA, Grau A, Scharr A, Husseini ME. A potential conflict of interest.
Vertebral Segmentation Dataset with Fracture Grading. Oak Brook, Chicago:
Radiol Intell (2020). Copyright © 2021 Rayudu, Dieckmeyer, Löffler, Noël, Kirschke, Baum and Subburaj.
45. Sekuboyina A, Bayat A, Husseini ME, Löffler M, Rempfler M, Kukačka J, et al. This is an open-access article distributed under the terms of the Creative Commons
VerSe: A Vertebrae Labelling and Segmentation Benchmark. arXiv (2020) 2 Attribution License (CC BY). The use, distribution or reproduction in other forums is
(4):e190138. doi: 10.1148/ryai.2020190138 permitted, provided the original author(s) and the copyright owner(s) are credited and
46. Adams MA, Pollintine P, Tobias JH, Wakley GK, Dolan P. Intervertebral disc that the original publication in this journal is cited, in accordance with accepted
degeneration can predispose to anterior vertebral fractures in the thoracolumbar academic practice. No use, distribution or reproduction is permitted which does not
spine. J Bone Miner Res (2006) 21:1409–16. doi: 10.1359/jbmr.060609 comply with these terms.
Frontiers in Endocrinology | www.frontiersin.org 10 January 2021 | Volume 11 | Article 526332You can also read