Vehicles as sensors: high-accuracy rainfall maps from windshield wiper measurements
←
→
Page content transcription
If your browser does not render page correctly, please read the page content below
Vehicles as sensors: high-accuracy rainfall maps
                                           from windshield wiper measurements
                                           Matthew Bartos1,+ , Hyongju Park2,+ , Tian Zhou2 , Branko Kerkez1,* , and Ramanarayan
                                           Vasudevan2
                                           1 Department of Civil and Environmental Engineering, University of Michigan, Ann Arbor, MI, 48109, United States
                                           2 Department of Mechanical Engineering, University of Michigan, Ann Arbor, MI, 48109, United States
                                           * Correspondence to: bkerkez@umich.edu
                                           + These authors contributed equally to this work
arXiv:1806.10988v1 [eess.SP] 19 Jun 2018

                                           ABSTRACT

                                           Connected vehicles are poised to transform the field of environmental sensing by enabling acquisition of scientific data at
                                           unprecedented scales. Drawing on a real-world dataset collected from almost 70 connected vehicles, this study generates
                                           improved rainfall estimates by combining weather radar with windshield wiper observations. Existing methods for measuring
                                           precipitation are subject to spatial and temporal uncertainties that compromise high-precision applications like flash flood
                                           forecasting. Windshield wiper measurements from connected vehicles correct these uncertainties by providing precise
                                           information about the timing and location of rainfall. Using co-located vehicle dashboard camera footage, we find that wiper
                                           measurements are a stronger predictor of binary rainfall state than traditional stationary gages or radar-based measurements.
                                           We introduce a Bayesian filtering framework that generates improved rainfall estimates by updating radar rainfall fields with
                                           windshield wiper observations. We find that the resulting rainfall field estimate captures rainfall events that would otherwise be
                                           missed by conventional measurements. We discuss how these enhanced rainfall maps can be used to improve flood warnings
                                           and facilitate real-time operation of stormwater infrastructure.

                                           Introduction
                                           Accurate rainfall measurements are essential for the effective management of water resources1 . Historical rainfall records are
                                           used extensively in the design of water infrastructure2 , while at finer scales, real-time rainfall measurements are an integral
                                           component of flood forecasting systems3 . Despite the central role that precipitation measurements play in the design and
                                           operation of water infrastructure, current methods for measuring precipitation often do not provide the spatial resolution or
                                           measurement certainty required for real-time applications3 . As the demand for real-time precipitation data increases, new
                                           sensing modalities are needed to address deficiencies found in conventional data sources.
                                                The need for high-resolution precipitation estimates is perhaps best illustrated by the problem of urban flash flooding.
                                           Flooding is the number one cause of natural disaster fatalities worldwide, with flash floods accounting for a majority of flooding
                                           deaths in developed countries4 . Despite the risks posed by flash flooding, there is “no existing model [that is] capable of
                                           making reliable flash flood forecasts in urban watersheds”3 . Flash flood forecasting is to a large extent hindered by a lack of
                                           high-resolution precipitation data, with spatial resolutions of < 500 m and temporal resolutions of 1-15 minutes required for
                                           urban areas5, 6 .
                                                Contemporary rain measurement technologies—such as stationary rain gages and weather radar—struggle to achieve the
                                           level of precision necessary for flash flood forecasting. While rain gages have long served as a trusted source of surface-
                                           level precipitation measurements7 , they often fail to capture the spatial variability of rain events, especially during convective
                                           storms8–10 . This inability to resolve spatial patterns in rainfall is made worse by the fact that the number of rain gages worldwide
                                           is rapidly declining1 . Weather radar is a useful tool for capturing the spatial distribution of rainfall. However, radar-rainfall
                                           estimates are subject to large spatial and temporal uncertainties11–14 . Additionally, weather radar tends to show systematically
                                           large biases for major flood events, and may perform poorly for small watersheds6 , making urban flood forecasting problematic.
                                                The rise of connected and autonomous vehicles offers an unprecedented opportunity to enhance the density of environmental
                                           measurements15, 16 . While dedicated sensor networks are expensive to deploy and maintain, fleets of connected vehicles can
                                           capture real-time data at fine spatial and temporal scales through the use of incidental onboard sensors. With regard to rainfall
                                           measurement, windshield wiper activity offers a novel means to detect the location and timing of rainfall with enhanced
                                           precision. When used in conjunction with modern signal processing techniques, wiper-based sensing offers several attractive
                                           properties: (i) vehicles achieve vastly improved coverage of urban areas, where flood monitoring is important; (ii) windshield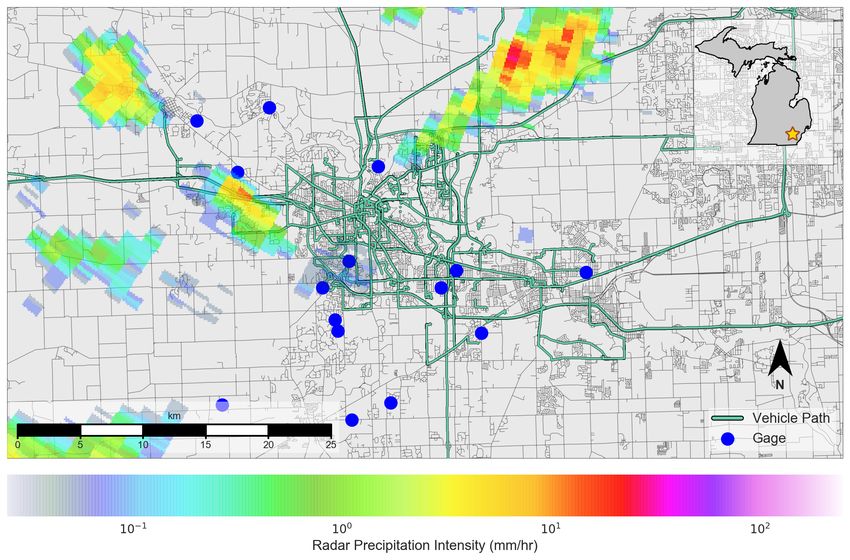
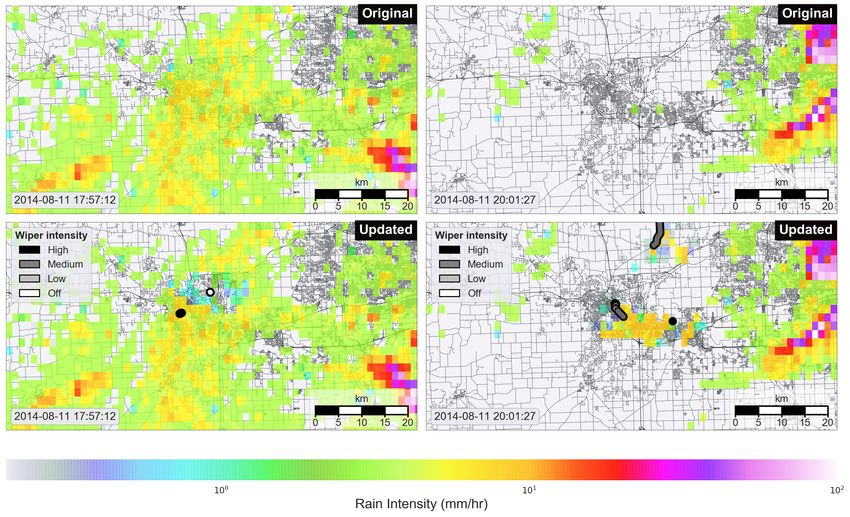
Figure 1. Overview of the study area on June 12, 2014. Blue circles represent rain gages. Vehicle paths are shown as green
lines, while roads are shown in gray. A radar overlay shows the average precipitation intensity as estimated by radar.

wiper intensity is easy to measure and requires little overhead for processing (as opposed to video or audio data); and (iii)
vehicle-based sensing can be readily scaled as vehicle-to-infrastructure communication becomes more widespread. Moreover,
many new vehicles come equipped with optical rain sensors that enable direct measurement of rainfall intensities. When paired
with data assimilation techniques, these sensors may enable even higher-accuracy estimation of rainfall fields compared to
wipers alone.
    While a small number of studies have investigated vehicle-based precipitation measurements, the results of these studies are
strictly based on simulated wiper data instead of real measurements. As such, the premise that windshield wiper data can be
used to improve rainfall estimates has never been verified using a large real-world dataset. Hill (2015) combines simulated
binary (wet/dry) rainfall sensors with weather radar observations to generate improved areal rainfall estimates, which are then
validated against rainfall fields produced by interpolation of tipping-bucket rain gages15 . Similarly, Haberlandt (2010) combines
simulated vehicle wiper measurements with rain gage observations to improve rainfall field estimates, and then validates the
resulting product against weather radar16 . Although these studies highlight the potential for vehicle-based measurements to
improve the spatial and temporal resolution of rainfall estimates, their findings have not yet been validated using data from
real-world connected vehicles.
    To address these challenges, this study leverages windshield wiper measurements collected from nearly 70 vehicles to
produce corrected rainfall maps (see Figure 1 for a description of the study area and data sources). In the first part of this paper,
we demonstrate that windshield wiper measurements offer a reliable indicator of rainfall by comparing wiper measurements
against dashboard camera footage that indicates the ground truth binary rainfall state (raining/not raining). In the second part of
this paper, we develop a Bayesian data fusion procedure that combines weather radar with vehicle-based wiper measurements
to produce an updated probabilistic rainfall field map. We validate this novel data product by showing that it is more effective
than the original radar data at predicting the binary rainfall state. Finally, we discuss how these enhanced rainfall maps can be
used to improve flood warnings and facilitate real-time operation of stormwater infrastructure.

                                                                                                                                2/13
Results

Figure 2. Analysis of a single vehicle trip occurring from 21:46 - 22:26 on August 11, 2014. The top two panels show
video footage during the rainy (left) and dry (right) segments of the trip. The bottom left panel shows a map of the vehicle’s
trip, with the wiper intensity indicated by color. A radar overlay shows the average rainfall intensity over the 40-minute time
period. Blue circles represent the gages nearest to the vehicle path. The two bottom right panels show the precipitation intensity
as estimated by radar and gage measurements (center), and the 1-minute average wiper intensity (bottom).

Windshield wipers improve binary rainfall detection
Windshield wiper measurements enhance rainfall estimation by enabling greater certainty about the timing and location
of rainfall. While wiper intensity is generally a poor predictor of rainfall intensity (see Figure S1 in the Supplementary
Information), we find that wiper status (on/off) is a stronger predictor of binary rainfall state than either radar or gage-based
measurements. This result suggests that vehicle-based measurements can be used to validate and correct rainfall fields derived
from conventional data sources.
    Wiper measurements provide a more accurate indicator of binary rainfall state than either radar or gage measurements. We
determine the binary classification performance for each technology (gages, radar and wipers) by comparing the measured
rainfall state with co-located dashboard video footage. Dashboard video is taken to represent the ground truth, given that
the presence or absence of rainfall can readily be determined by visually inspecting the windshield for raindrops. Figure 2
shows an example of co-located radar, gage, wiper and camera measurements for a single vehicle trip. In this case, rainfall
is visible during the first half of the trip (top left). Aggregating these cross-comparisons for every vehicle trip across three
storm events, we find that wiper status is the best estimator of binary rainfall state, with a true positive rate (TPR) of 93.1%,
and a true negative rate (TNR) of 98.2%. By comparison, weather radar achieves a smaller TPR of 89.5%, while stationary
gages show a much smaller TPR of 44.5% (see Table 2). These results can partly be explained by the superior spatial and
temporal resolution of the vehicle-based measurements. Wipers detect intermittent changes in rainfall at a temporal resolution
on the order of seconds, while radar and gage measurements can only detect the average rate over a 5-minute period. When
ground truth camera observations are collected at a 3-second temporal resolution, the benefit of wiper measurements over
radar measurements becomes even more pronounced, with a TPR advantage of 5.2%, a TNR advantage of 7.7%, and an
overall wiper TPR of 97.0% (see the supplementary note on factors affecting binary detection performance). The results of this
analysis suggest that conventional rainfall measurement technologies can be enhanced through the inclusion of vehicle-based
measurements.

                                                                                                                             3/13
Metric Gage Radar Wiper
True Positive Rate (%) 44.5 89.5 93.1
True Negative Rate (%) 96.7 97.5 98.2
Table 1. Classification performance of each rainfall measurement technology. The true positive rate indicates the
percentage of instances where the given technology successfully detects rainfall when rainfall is actually occurring. The true
negative rate indicates the percentage of instances where the technology does not detect rainfall when rainfall is not occurring.
Assimilation of wiper data yields corrected rainfall maps
Based on the observation that wiper measurements are a strong binary predictor of rainfall, we develop a Bayesian filtering
framework that combines radar rainfall estimates with wiper observations to generate corrected rainfall maps. Radar is used to
estimate a prior distribution of rainfall intensities. This prior is then updated with wiper observations to produce a corrected
rainfall field. The results of this filtering procedure are demonstrated in Figure 3, which shows the original rainfall field (top)
along with the corrected rainfall field (bottom). In some cases (left panel), vehicles detect no rain in regions where radar had
previously estimated rain. In these cases, the updated product reduces the rainfall field in the proximity of the vehicle. In other
cases (right panel), the updated product predicts rainfall in regions where little to no rainfall was observed in the original dataset.
This outcome shows that windshield wiper activity is sensitive to intermittent rainfall events that radar may not otherwise detect.
To see the full evolution of the rainfall field under both the original and corrected data sets, refer to Video S1.
Figure 3. Original and updated rainfall maps. Top (left and right): Original weather radar rainfall intensity map. Radial
radar scans have been resampled to a 1 km grid to ensure computational tractability. Bottom (left and right): updated rainfall
intensity map, combining radar data with wiper measurements using the Bayesian filter. In the bottom left panel, a “hole” in the
rainfall field occurs when a vehicle detects no rain in a location where radar alone estimated rain. In the bottom right panel,
vehicles detect rainfall where radar previously did not detect rainfall.
The wiper-corrected rainfall field predicts the binary rainfall state with greater accuracy than the radar-only data product.
To validate the wiper-corrected rainfall field, we use an iterated “leave-one-out” approach, in which an updated rainfall field
is generated while excluding a vehicle, and the resulting data product is compared against the measured rainfall state of the
omitted vehicle. Repeating this process for each vehicle yields the receiver operator characteristics shown in Figure 4. These
4/13curves map the relationship between the TPR and TNR for both the original rainfall field (radar only) and the corrected rainfall
field (radar and wiper). Curves located closer to the upper-left corner (i.e. those with a larger area under the curve) exhibit the
best performance, given that they have a large true positive rate and a small false negative rate. Based on these curves, it can
be seen that the corrected data product performs consistently better than the original radar product at predicting the presence
or absence of rain, with a TPR and TNR close to unity. These results confirm that inclusion of vehicle-based measurements
enables improved prediction of the underlying rainfall field.
Discussion
The enhanced rainfall maps developed in this study have the potential to assist in the real-time operation of transportation
and water infrastructure. In particular, high accuracy rainfall field estimates will enable improved prediction of flash floods in
urban centers, and will help to inform real-time control strategies for stormwater systems. As mentioned previously, flash flood
forecasting is contingent on high-resolution areal rainfall estimates, with accurate measurements on the order of 500 m or finer
required for forecasting in urban areas. By enabling real-time validation and filtering of radar rainfall estimates, vehicle-based
sensors may help fill measurement gaps and improve the prediction of flood events near roadways. Monitoring of roadways is
especially important given that in the US, roughly 74% of flood fatalities are vehicle related4 . While the vehicles used in this
study provide only binary measurements of rainfall state, many newer vehicles feature optical rain sensors that are capable
of measuring precipitation rate directly. When combined with the Bayesian sensor fusion framework described in this study,
these optical rain sensors may enable robust mapping of rainfall volumes at the fine spatial and temporal scales needed for
high-accuracy flash flood forecasting. Moreover, as connected and autonomous vehicles become more widely adopted, the
spatial coverage and measurement certainty of this new rainfall sensing modality will be even further enhanced.
In addition to assisting with flash flood response, high-precision rainfall data products may one day inform the operation
of new “smart” water infrastructure. Recent work has highlighted the potential of “smart” water systems to mitigate water
hazards through real-time control of distributed gates, valves and pumps17–21 . When informed by accurate and timely data,
these systems can significantly reduce operating costs, prevent combined sewer overflows, and halt the degradation of aquatic
ecosystems by adaptively reconfiguring water infrastructure in real time17, 18 . However, recent findings suggest that optimal
control strategies for “smart” water systems are highly sensitive to the location, timing and intensity of rainfall inputs22 . In
this regard, the wiper-corrected rainfall product presented in this study may help to enable more fine-grained control of water
infrastructure by reducing uncertainty in conventional rainfall field estimates.
Figure 4. Binary classification performance of the updated rainfall product. Receiver operator characteristic (ROC)
curves indicate the rainfall state prediction accuracy for the original radar estimate and the updated (wiper-corrected) data
product. The area under the curve (AUC) measures overall classification performance.
5/13Conclusions
This study generates enhanced probabilistic rainfall maps by combining conventional radar-based precipitation fields with
ubiquitous windshield wiper measurements from almost 70 unique vehicles. We find that while windshield wiper intensity is a
poor predictor of rainfall intensity, wiper activity is a stronger predictor of binary rainfall state than conventional radar and
gage-based data sources. With this result in mind, we develop a novel Bayesian filtering framework that combines a radar-based
rainfall prior with binary windshield wiper observations to produce an updated rainfall map. We find that the Bayesian filtering
process is effective at detecting changes in the rainfall field that conventional measurement technologies may otherwise miss.
We validate the updated rainfall data product by assessing its ability to reproduce the binary rainfall state anticipated by an
omitted vehicle. Based on this analysis, we find that the corrected rainfall field is better at predicting the binary rainfall state
than the original radar product. As connected vehicles become more widespread, the ubiquitous sensing approach proposed by
this study may one day help to inform real-time warning and control systems for water infrastructure by providing fine-grained
estimates of the rainfall field.
Materials and Methods
Evaluating vehicle-based measurements
In the first part of this study, we assess the degree to which windshield wiper activity serves as a proxy for both rainfall intensity
and binary rainfall state. First, wiper measurements are compared against conventional rainfall measurement technologies to
determine if there is a direct relationship between wiper intensity and rain intensity. Next, we assess the degree to which each
data source reflects the ground truth rainfall state by comparing measurements from all three sources (gages, radar and wipers)
with vehicle-based video footage. Video footage provides instantaneous visual confirmation of the rainfall state (raining or
not raining), and is thus taken to represent the ground truth. We characterize the binary classification performance of each
technology in terms of its true positive and true negative rates.
To ensure that our analysis is computationally tractable, we isolate the study to a subset of three storms in 2014. We assess
the validity of our procedure for storms of different magnitudes by selecting a large storm (2014-08-11), a medium-sized storm
(2014-06-28) and a small storm (2014-06-12). Storms are selected during the summertime months to avoid conflating rainfall
measurements with snow measurements. The year 2014 is chosen because it is the year for which the greatest number of
vehicles are available. Unless otherwise specified, data are co-located using a nearest neighbor search. For comparison of wiper
and gage readings, we select only those gages within a 2 km range of any given vehicle.
Data sources
We consider four data sources: (i) stationary rain gages, (ii) weather surveillance radar, (iii) vehicle windshield wiper data, and
(iv) vehicle dashboard camera footage. We provide a brief description of each data source here:
Gage data are obtained from personal weather stations maintained by the Weather Underground23 . Within the city of Ann
Arbor (Michigan), Weather Underground hosts 21 personal weather stations, each of which yield rainfall estimates at a
time interval of approximately 5 minutes. Locations of gages are indicated by blue circles in Figure 1. Although verified
gage data from the National Weather Service (NWS) and the National Oceanic and Atmospheric Administration (NOAA)
are available, Weather Underground gages are selected because (i) NOAA and NWS each maintain only a single gage in
the city of Ann Arbor, meaning that intra-urban spatial variations in precipitation intensity cannot be captured, and (ii)
the temporal resolution of NOAA and NWS gages are relatively coarse for real-time applications (with NOAA offering a
maximum temporal resolution of 15 minutes and NWS offering a maximum temporal resolution of 1 hour).
Weather radar observations are obtained from NOAA’s NEXRAD Level 3 Radar product archive24 . We use the “Instanta-
neous Precipitation Rate” data product (p176). Radar precipitation estimates are obtained at a temporal resolution of 5
minutes, and a spatial resolution of 0.25 km by 0.5 degree (azimuth). Radar station KDTX in Detroit is used because it is
the closest radar station to the City of Ann Arbor. Radial radar scans are interpolated to cartesian coordinates using a
nearest neighbor approach.
Vehicle-based wiper intensities are obtained from the University of Michigan Transportation Research Institute (UMTRI)
Safety Pilot Model Deployment database25 . For each vehicle, this dataset includes time series of latitude, longitude,
and windshield wiper intensity at a temporal resolution of 2 milliseconds. Windshield wiper intensity is given on
an ordinal scale from 0 to 3, with 0 indicating that the wiper is turned off, 1 representing the lowest wiper intensity,
and 3 representing the highest wiper intensity. A wiper reading of 4 indicates that the vehicle’s “mister” is activated,
distinguishing between wiper use for rain removal and wiper use for windshield cleaning. For the year 2014, 69 unique
vehicles are available in the UMTRI dataset. However, typically less than ten vehicles are active at any given time during
6/13the observation period. Vehicles with no sensor output or invalid readings were removed from the dataset prior to the
analysis (see the Supplementary Note for more details).
Camera observations are also obtained from the UMTRI vehicle database25 . Located on the inside of each vehicle, cameras
provide streaming video footage of the windshield, side-facing windows, rear-facing windows, and the driver. For the
purposes of validation, we use the front-facing windshield camera. Camera frames are manually inspected for rain drops
striking the windshield. Time intervals where rain is observed are classified as “raining”; similarly time intervals where
no new droplets are observed are classified as “not raining”. Manual inspection and labeling of the video data was
performed independently by two reviewers to ensure robustness.
A Bayesian filtering framework
In the second part of this study, we develop a Bayesian filtering framework that combines binary wiper observations with
radar-based rainfall intensity measurements to generate corrected rainfall maps. In simple terms, the Bayesian filter generates
an updated rainfall field map, in which binary (on/off) wiper measurements adaptively correct the underlying radar rainfall field.
Windshield wiper status is taken to represent a measurement of the ground truth binary rainfall state, given that it is a better
predictor of the binary rainfall state than radar- or gage-based measurements. Under this framework, four distinct cases are
possible. If both the wiper and radar measure precipitation, the radar reading is taken to be correct, and the original rainfall
field remains the same. Similarly, if neither the wiper nor the radar measure precipitation, the radar rainfall field remains zero.
However, if the radar measures precipitation at a target location and the wiper does not, then the filter will update the rainfall
field such that rain intensity is reduced within the proximity of the vehicle (with a decay pattern corresponding to the Gaussian
kernel and an intensity of zero at the location of the wiper reading). Similarly, if the wiper measures precipitation, but the radar
measures no precipitation, the rainfall intensity will be increased around the proximity of the vehicle (with an intensity defined
by the empirical intensity distribution associated with the given wiper intensity).
A more formal description of the filtering framework is given here in terms of a noisy sensor model (for additional details,
see26 ). Consider a noisy sensor model in which each sensor produces a binary measurement given a target state. The target
state is represented as a random tuple z = (q, I ) where q is a location state (e.g. the latitude and longitude at the target), and I
is an information state (e.g. the precipitation intensity at the target) with all the random quantities indicated by bold italics.
We denote by Mt the event that sensors correctly measure the intensity, and by Mt the event that sensors fail to measure the
intensity correctly. The joint measurement likelihood at any time t is given by:
p(Mt |zz, xt ) (1)
where xt represents the locations of the sensors at time t. Equation 1 yields the probability distribution of precipitation
intensity measurement at q by sensors at xt . The expected value of Equation 1 with respect to I is equivalent to the rainfall
intensity experienced at the location q. Because the effective range of the wipers is limited, we account for the probability of
detection as a function of the distance between the sensor and the target. We denote by Dt the event that sensors detect the
target, and by Dt the event that sensors fail to detect the target at time t. The probability of detecting a target located at q by
sensors located at xt , p(Dt |q, xt ), is taken to decay with increasing distance to the sensor. Using the law of total probability, the
conditional probability of a correct measurement is then given by:
p(Mt |zz, xt ) = p(Mt |zz, Dt , xt )p(Dt |q, xt ) + p(Mt |zz, Dt , xt )p(Dt |q, xt ) (2)
where Dt is conditionally independent of I when conditioned on q. For example, consider xt = (0, 0), and q = (q1 , q2 ). If
the decay function is taken to be a 2D Gaussian centered at xt with covariance matrix σ I where I is a 2 by 2 identity matrix,
then:
2
q1 + q22
1
p(Dt |q, xt ) = η
et exp − (3)
2πσ 2 2σ 2
Where η et is a normalization constraint. If the target is not detected (i.e., Dt ), then the measurement is assumed to be
unreliable, and the likelihood, p(Mt |zz, Dt , xt ), is modeled using a prior distribution. If there is no prior information available,
the function is modeled using a uniform distribution. Now let bt (zz) represent the posterior probability of the precipitation
intensity given a target location q at time t. Using Bayes’ Theorem, bt (zz) can be formulated:
bt (zz) = ηt p(Mt |zz, xt )bt−1 (zz), t = 1, 2, . . . (4)
7/13Where ηt is a normalization constant and b0 is uniform if no information is available at t = 0. This filtering equation forms
the basis of the rainfall field updating algorithm. To reduce computational complexity, the filtering operation is implemented
using a Sequential Importance Resampling (SIR) Particle Filter27 .
The results of the Bayesian sensor fusion procedure are evaluated by determining the proportion of instances where the
combined data product is able to predict the binary rainfall state. We characterize the true and false positive rates for the largest
storm event (2014-08-11) using an iterated “leave-one-out” cross-validation approach. First, a single vehicle is removed from
the set of vehicles. The Bayesian update procedure is then executed using all vehicles except the excluded vehicle, and an
updated rainfall map is generated. Next, the rainfall states predicted by the corrected rainfall field (radar and wiper) and the
original rainfall field (radar only) are compared against the rainfall states predicted by the omitted vehicle. The performance
of each data product is evaluated based on its ability to reproduce the binary rainfall state observed by the omitted vehicle.
Performing this process iteratively yields the true and false positive rates for both the original (radar only) and updated (radar
and wiper) rainfall fields. This procedure is repeated for each vehicle in the set of vehicles to generate Receiver-Operator
Characteristic (ROC) curves, which characterize the true and false positive rates across an ensemble of simulations.
References
1. Overeem, A., Leijnse, H. & Uijlenhoet, R. Country-wide rainfall maps from cellular communication networks. Proc. Natl.
Acad. Sci. 110, 2741–2745 (2013). DOI 10.1073/pnas.1217961110.
2. Cheng, L. & AghaKouchak, A. Nonstationary precipitation intensity-duration-frequency curves for infrastructure design in
a changing climate. Sci. Reports 4 (2014). DOI 10.1038/srep07093.
3. Hapuarachchi, H. A. P., Wang, Q. J. & Pagano, T. C. A review of advances in flash flood forecasting. Hydrol. Process. 25,
2771–2784 (2011). DOI 10.1002/hyp.8040.
4. Doocy, S., Daniels, A., Murray, S. & Kirsch, T. D. The human impact of floods: a historical review of events 1980-2009
and systematic literature review. PLoS Curr. (2013). DOI 10.1371/currents.dis.f4deb457904936b07c09daa98ee8171a.
5. Berne, A., Delrieu, G., Creutin, J.-D. & Obled, C. Temporal and spatial resolution of rainfall measurements required for
urban hydrology. J. Hydrol. 299, 166–179 (2004). DOI 10.1016/j.jhydrol.2004.08.002.
6. Smith, J. A., Baeck, M. L., Meierdiercks, K. L., Miller, A. J. & Krajewski, W. F. Radar rainfall estimation for flash flood
forecasting in small urban watersheds. Adv. Water Resour. 30, 2087–2097 (2007). DOI 10.1016/j.advwatres.2006.09.007.
7. Grimes, D., Pardo-Igúzquiza, E. & Bonifacio, R. Optimal areal rainfall estimation using raingauges and satellite data. J.
Hydrol. 222, 93–108 (1999). DOI 10.1016/s0022-1694(99)00092-x.
8. Xiaoyang, L., Jietai, M., Yuanjing, Z. & Jiren, L. Runoff simulation using radar and rain gauge data. Adv. Atmos. Sci. 20,
213–218 (2003). DOI 10.1007/s00376-003-0006-7.
9. Yilmaz, K. K. et al. Intercomparison of rain gauge, radar, and satellite-based precipitation estimates with emphasis on
hydrologic forecasting. J. Hydrometeor 6, 497–517 (2005). DOI 10.1175/jhm431.1.
10. Sun, X., Mein, R., Keenan, T. & Elliott, J. Flood estimation using radar and raingauge data. J. Hydrol. 239, 4–18 (2000).
DOI 10.1016/s0022-1694(00)00350-4.
11. Winchell, M., Gupta, H. V. & Sorooshian, S. On the simulation of infiltration- and saturation-excess runoff using radar-
based rainfall estimates: Effects of algorithm uncertainty and pixel aggregation. Water Resour. Res. 34, 2655–2670 (1998).
DOI 10.1029/98wr02009.
12. Morin, E., Krajewski, W. F., Goodrich, D. C., Gao, X. & Sorooshian, S. Estimating rainfall intensities from
weather radar data: the scale-dependency problem. J. Hydrometeorol. 4, 782–797 (2003). DOI 10.1175/1525-
7541(2003)004¡0782:ERIFWR¿2.0.CO;2.
13. Smith, J. A., Seo, D. J., Baeck, M. L. & Hudlow, M. D. An intercomparison study of NEXRAD precipitation estimates.
Water Resour. Res. 32, 2035–2045 (1996). DOI 10.1029/96wr00270.
14. Islam, T., Rico-Ramirez, M. A., Han, D. & Srivastava, P. K. Artificial intelligence techniques for clutter identification with
polarimetric radar signatures. Atmospheric Res. 109-110, 95–113 (2012). DOI 10.1016/j.atmosres.2012.02.007.
15. Hill, D. J. Assimilation of weather radar and binary ubiquitous sensor measurements for quantitative precipitation
estimation. J. Hydroinformatics 17, 598 (2015). DOI 10.2166/hydro.2015.072.
16. Haberlandt, U. & Sester, M. Areal rainfall estimation using moving cars as rain gauges – a modelling study. Hydrol. Earth
Syst. Sci. 14, 1139–1151 (2010). DOI 10.5194/hess-14-1139-2010.
8/1317. Bartos, M., Wong, B. & Kerkez, B. Open storm: a complete framework for sensing and control of urban watersheds.
Environ. Sci. Water Res. & Technol. (2017). DOI 10.1039/c7ew00374a.
18. Kerkez, B. et al. Smarter stormwater systems. Environ. Sci. & Technol. 50, 7267–7273 (2016). DOI
10.1021/acs.est.5b05870.
19. Wong, B. P. & Kerkez, B. Adaptive measurements of urban runoff quality. Water Resour. Res. 52, 8986–9000 (2016). DOI
10.1002/2015WR018013.
20. Wong, B. P. & Kerkez, B. Real-time environmental sensor data: An application to water quality using web services.
Environ. Model. & Softw. 84, 505–517 (2016). DOI 10.1016/j.envsoft.2016.07.020.
21. Mullapudi, A., Wong, B. P. & Kerkez, B. Emerging investigators series: building a theory for smart stormwater systems.
Environ. Sci.: Water Res. Technol. 3, 66–77 (2017). DOI 10.1039/c6ew00211k.
22. Wong, B. Real-time measurement and control of urban stormwater systems. Ph.D. thesis, University of Michigan (2017).
23. Weather Underground. Weather Underground personal weather stations (City of Ann Arbor) (2014).
24. NOAA National Weather Service (NWS) Radar Operations Center. NOAA next generation radar (NEXRAD) level 3
products (instantaneous precipitation rate) (1992). DOI 10.7289/V5W9574V.
25. University of Michigan Transportation Research Institute. Safety pilot model deployment / Ann Arbor connected vehicle
test environment data (2014).
26. Park, H., Liu, J., Johnson-Roberson, M. & Vasudevan, R. In Robust Environmental Mapping by Mobile Sensor Networks.
IEEE International Conference on Robotics and Automation (2018). URL: https://arxiv.org/abs/1711.07510.
27. Berzuini, C., Best, N. G., Gilks, W. R. & Larizza, C. Dynamic conditional independence models and markov chain monte
carlo methods. J. Am. Stat. Assoc. 92, 1403–1412 (1997).
Acknowledgements
Funding for this project was provided by MCubed (grant 985), the Ford Motor Company–University of Michigan Alliance
(grant N022977), and the University of Michigan. Vehicle metadata and camera footage are provided courtesy of the University
of Michigan Transportation Research Institute.
Author contributions statement
M.B. wrote the paper, performed the analysis, and helped with the implementation of the filtering algorithm. H.P. developed,
implemented, and validated the filtering algorithm. T.Z. analyzed the dashboard camera data and assisted with analysis of the
windshield wiper data. B.K. and R.V. originated the concept of the study, guided the development of the methods, and assisted
in writing the paper. Additional inspection and labeling of vehicle dashboard footage was performed by Aditya Prakash Singh.
All authors reviewed the manuscript.
Additional information
Data access links
Upon publication, code and data for this study will be made available at: github.com/kLabUM/vehicles-as-sensors.
Competing financial interests statement
The authors declare no competing interests.
9/13Supplementary Materials
Supplementary note on binary detection performance
Binary detection performance is sensitive to a number of factors, including the temporal resolution of the ground truth data
and the configuration of wiper sensors. While these factors can affect the magnitude of binary classification performance,
under all scenarios considered, wiper measurements are a better detector of the binary rainfall state than either radar or gage
measurements.
Binary detection performance can be affected by the temporal resolution at which the ground truth data is collected. To
ensure robustness, labeling of vehicle footage was performed independently by two reviewers. The first reviewer labeled the
observed rainfall state for each vehicle over all three days of the study period (2014-06-12, 2014-06-28, 2014-08-11) at a
temporal interval of 1 minute. A second reviewer labeled the observed rainfall and wiper state for the largest storm event
(2014-08-11) at an enhanced time resolution of roughly 3 seconds. Due to the time-intensive nature of labeling video data at
this temporal resolution, and due to the strong agreement between the two labeled datasets, this second round of labeling was
not performed for the remaining two days (2014-06-12 and 2014-06-28). Despite the difference in time resolution, manual
labeling of the video data showed strong agreement. Taking the high-resolution dataset to represent the ground truth rainfall
state (and aggregating the high-resolution dataset to the temporal resolution of the low-resolution dataset), the true positive rate
of the low temporal-resolution camera observations was 92.6%, while the true negative rate was 99.3%. Agreement in terms of
positive detection was lower due to the difference in temporal resolution between the two sources. The low-resolution camera
observation dataset classifies each minute-long interval as either “raining” or “not raining”. However, the high-resolution
ground truth dataset contains many instances in which part of a given minute-long interval contains rain, and part does not. Thus,
when the high-resolution dataset is aggregated to match the resolution of the low-resolution dataset, there are more intervals
where some amount of rain is detected (yielding more instances of positive detection overall). A similar mismatch occurs
if the low-resolution dataset is interpolated to match the time resolution of the high-resolution dataset. This time resolution
mismatch also affects comparisons between the ground truth and other data sources (e.g. wiper, radar and gages). In general,
the difference in classification performance between data sources decreases when the ground truth dataset is aggregated in time.
Differences in classification performance become more pronounced when a high-resolution ground truth dataset is used.
Many vehicles exhibited data quality issues such as non-reporting wiper sensors, malfunctioning wiper sensors, or
unobservable wiper modes. These data quality issues may impact the performance of the wiper as a classifier, but are largely
attributable to the fact that the data is taken from a pilot study in which sensor configurations are not standardized. For some
vehicles, wiper sensors were simply not configured to report wiper data. In these instances, the reported wiper value was zero
for the entire observation period even though wiper movement was observed during manual inspection of the dashboard footage.
Vehicles for which wiper sensors were not configured were removed from the analysis. Other vehicles exhibited malfunctioning
or poorly configured sensors. For instance, in some cases the wiper intensity fluctuated between 0 and 1 at a frequency on the
order of milliseconds—a behavior which is clearly not possible for a human driver. Video footage confirmed that the sensor
was malfunctioning during these time periods. Malfunctioning vehicles were also removed from the analysis. Perhaps the
most common data quality issue, however, is that several vehicles exhibited unobservable wiper modes. In this case, sensors
were configured to report some wiper intensity states but not others. For example, the sensor may report the wiper intensity
when the wiper switch is in a “continuous” mode, but may not report the wiper intensity when the wiper is placed in a manual
“wipe” mode. These cases could only be detected by manual inspection of the camera footage. These data issues can largely be
attributed to the fact that the sensor data is taken from a pilot study in which sensor configurations vary from vehicle to vehicle.
As manufacturers standardize sensor configurations for connected vehicles, the relevance of these issues is likely to diminish.
The performance of the wiper as a classifier can be improved by (i) comparing wiper data against a ground truth dataset
obtained at a high temporal resolution, and (ii) correcting errors in the wiper sensor readings. When manual observations of the
wiper state are used to correct unobservable wiper modes, and the resulting corrected wiper data is compared to the 3-second
resolution camera observations, the binary classification performance over weather radar is significantly enhanced: the true
positive rate of the wiper data is 5.2% higher than radar, while the true negative rate is 7.7% higher. Table S1 shows the true
and false positive rates for all technologies (during the 2014-08-11 storm event) when these two conditions are met.
10/13Fig. S1
Wiper intensity vs. radar rainfall intensity Wiper intensity vs. gage rainfall intensity
14 Mean n = 1, 040, 511 14 Mean n = 426, 966
12 12
Radar Intensity (mm/hr)
Gage Intensity (mm/hr)
10 10
8 8
6 6
4 4
2 2
0 0
0 1 2 3 0 1 2 3
Wiper Intensity Wiper Intensity
Figure 5. Comparison of radar, gage and wiper intensities for three storm events on 6/12/2014, 6/28/2014, and
8/11/2014. The left panel shows the distribution of radar precipitation measurements associated with each wiper intensity. The
right panel shows the distribution of gage precipitation measurements associated with each wiper intensity for vehicles located
within 2 kilometers of the gage. Note that the range limitation reduces the number of data points available. No clear
relationship is observed between wiper intensity and rainfall intensity.
11/13Table S1
Metric Gage Radar Wiper
True Positive Rate (%) 55.1 91.8 97.0
True Negative Rate (%) 96.9 87.4 95.1
Table 2. Classification performance of each rainfall measurement technology when using high-temporal resolution
ground truth data, and correcting misreporting wiper states. These binary performance metrics hold when (i) ground
truth observations at a resolution of 2.4 seconds are used, and (ii) manual corrections are made to the wiper state according to
the wiper state in the observed camera footage (i.e. unobservable wiper modes are corrected).
12/13Video S1
Original rainfall field (top) vs. updated data product (bottom) for a large storm event on 2014-08-11. Vehicle paths can be seen
in the bottom frame, with windshield wiper intensities indicated by greyscale intensity from off (white) to high intensity (dark
grey).
13/13You can also read