Development of a Mobile Application for the Decoding of Honeybee Tags in Field Experiments
←
→
Page content transcription
If your browser does not render page correctly, please read the page content below
Bachelor Thesis in Computer Science
Biorobotics Lab, Dahlem Center of Machine Learning and Robotics
     Institute of Computer Science, Freie Universität Berlin

Development of a Mobile Application for
the Decoding of Honeybee Tags in Field
             Experiments

     Author                                      Supervisor
     Aki Saksala                  Prof. Dr. Tim Landgraf

                      Berlin, 11 April 2018

                            Abstract

   For the research on honeybee behaviour in the BeesBook
   project, all bees in a colony are tracked over their entire
   lifetimes using circular tags that uniquely identify every
   individual bee in the hive. The identification and
   documentation of bee tags required in various field
   experiments is currently done manually, an approach that is
   inconvenient and error-prone. In this thesis, a mobile
   application for the decoding of bee tags is developed that
   aims to automate or eliminate parts of the manual data
   collection process, improving its efficiency and reliability.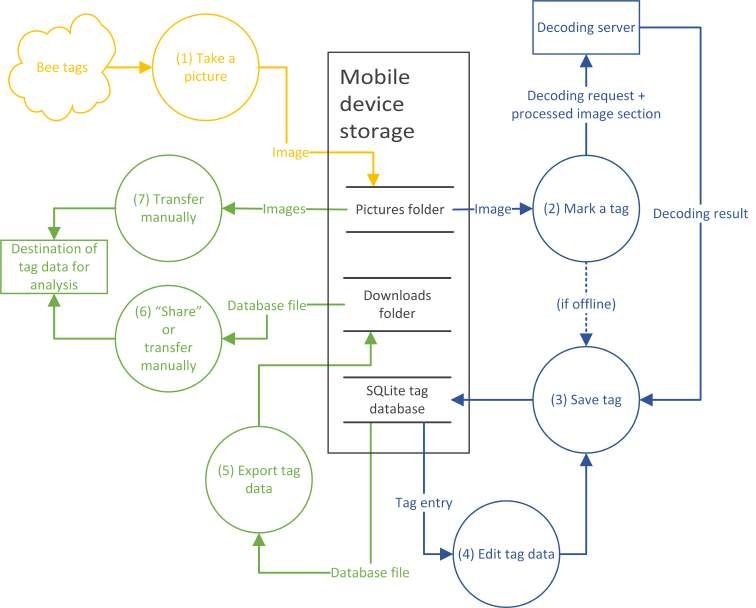
Contents
1 Introduction                                                                                                              1

2 Related Work                                                                                                              5

3 Implementation                                                                                                             6
  3.1 Requirements . . . . . . .    .   .   .   .   .   .   .   .   .   .   .   .   .   .   .   .   .   .   .   .   .   .    6
  3.2 Execution . . . . . . . . .   .   .   .   .   .   .   .   .   .   .   .   .   .   .   .   .   .   .   .   .   .   .    7
      3.2.1 Choice of platform      .   .   .   .   .   .   .   .   .   .   .   .   .   .   .   .   .   .   .   .   .   .    7
      3.2.2 Gallery . . . . . .     .   .   .   .   .   .   .   .   .   .   .   .   .   .   .   .   .   .   .   .   .   .    7
      3.2.3 Image capture . .       .   .   .   .   .   .   .   .   .   .   .   .   .   .   .   .   .   .   .   .   .   .    7
      3.2.4 Decoding screen .       .   .   .   .   .   .   .   .   .   .   .   .   .   .   .   .   .   .   .   .   .   .    7
      3.2.5 Settings . . . . . .    .   .   .   .   .   .   .   .   .   .   .   .   .   .   .   .   .   .   .   .   .   .   10
      3.2.6 Data export . . . .     .   .   .   .   .   .   .   .   .   .   .   .   .   .   .   .   .   .   .   .   .   .   14

4 Evaluation                                                                                                                15

5 Conclusion and future work                                                 17
  5.1 Summary . . . . . . . . . . . . . . . . . . . . . . . . . . . . . . . 17
  5.2 Further considerations . . . . . . . . . . . . . . . . . . . . . . . . 17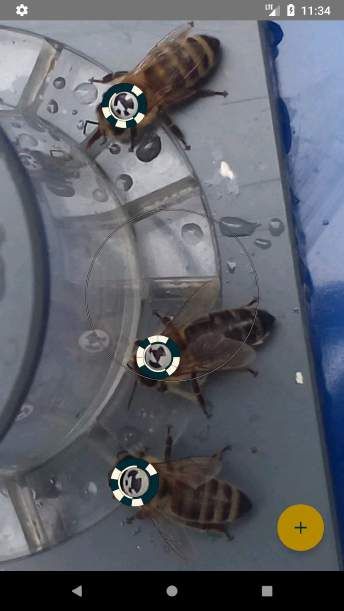
Statement of originality
I declare that this thesis is the product of my own original work and has not
been submitted in similar form to any university institution for assessment pur-
poses. All external sources used, such as books, websites, articles, etc. have
been indicated as such and have been cited in the references section.

Berlin, 11 April 2018

Aki Saksala
1   INTRODUCTION                                                                  1

1     Introduction
The behavioral study of honeybees in a project called BeesBook is one of the
main focal points of research in the Biorobotics Lab at Freie Universität Berlin.
   To be able to track all bees in a colony over their entire lifetimes, each
individual bee is marked with a tag glued to its thorax. This circle-shaped
plastic disk contains a black and white bit pattern (see figure 1) that uniquely
identifies the bee within the colony. This means that the interaction between

                                        (a)

                                        (b)

    Figure 1: (a): Design of the bee tags. A unique ID for the bee is encoded
    in the bit segments on the outside (0-11), while the two semicircles (12-
    13) indicate the orientation. Figure adapted from [26]. (b): Two tagged
    bees, photographed during a field experiment.

specific individuals of the colony can be studied, a level of detail at which it was
previously not possible to collect data for a comparably long time period [20],
due to the amount of effort required for a manual analysis [24].
    Because of the permanency of the identification tag, research on the bees’
behavior is not locally limited to the inside of the beehive. One example of
this is the study of the communication of food source locations by forager bees.
These are some of the questions that arise when the forager bee returns to the
hive from a newly found food source:
    • Does the forager bee tell the other colony members about the food source
      it has found?
    • How do the other bees (that have never visited the food source) react to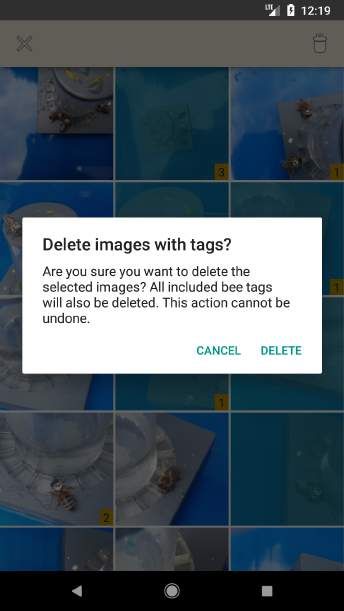
1   INTRODUCTION                                                                                     2

     Figure 2: Exemplary bee tag templates that are printed out on paper.
     The top row shows the blank templates, into which the researcher at
     the artificial feeder draws the tag patterns of the observed bees (bottom
     row).

       the new information? Do they pass it on to other colony members? Do
       they fly out to the food source?
    • How fast and in what way does this information spread inside the hive?
    • Does the forager bee have any preference regarding which bees it relays
      the information to?
To be able to answer each of the above questions accurately, the researchers need
to know a few things in advance, which is the reason why this topic is, for the
most part, studied through controlled experiments. Firstly, the location of the
food source that the forager bee has found needs to be known. This is ensured
by setting up an artificial feeder, usually a sort of small container filled with a
sugar solution. Secondly, the identities of all bees that visit the food source,
as well as the identities of the bees that receive the information about the food
source, have to be known. The bees inside the hive are tracked continuously by a
camera setup. This system is used to identify bees and record their interactions
[26, 27]. This way, the identities of the bees that receive information about the
food source can be extracted. The identities of the forager bees that visit the
food source need to be determined at the feeder itself.
    A record of these forager bees is kept by a researcher at the feeder. This
researcher usually carries a pre-printed paper form containing blank bee tags
to be filled out (see figure 2). For each bee, they note down the time at which
it visited1 the feeder and either draw the pattern of its tag into one of the
   1 In this case, “visiting” the feeder refers to the bee noticing it as a food source, i.e., drinking

from the sugar solution.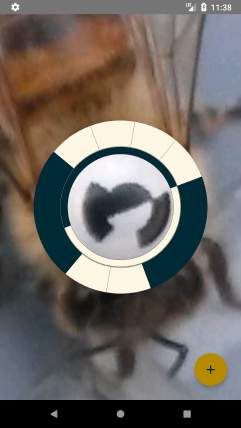
1   INTRODUCTION                                                                            3

templates or note down its ID2 . Sometimes, additional information needs to
be written down, for example, which feeder the bee visited (in a setup with
multiple feeders) or the fact that the duration of the visit was extraordinarily
short. While the idea of keeping track of the bees that the researcher has seen
seems fairly straightforward, this kind of manual approach is error-prone and
inconvenient in a number of ways:

Bad efficiency. It takes a comparatively long time to note down the visit of
even a single bee since all 12 bits on its tag need to be written down or drawn
in, as well as the time of observation. In addition to meaning more repetitive
and tiresome work for the researcher, this could in some cases lead to visits
being missed, especially due to multiple bees sometimes being at the feeder at
the same time. To prevent bees from potentially leaving the feeder before their
IDs are noted down, the researcher usually has to take pictures of the bees first.

Errors. The bits of the tag always need to be read in the same order, regard-
less of the orientation of the bee’s body from the researcher’s perspective. When
also taking into account that the opportunity to note down a visit is limited by
the time the bee stays at the feeder, this means that mistakes, which result in
errors in the data, are not unlikely.

No verification. There is no possibility to verify the integrity of the collected
data afterward, without documenting the visits in additional ways, for example
by taking pictures of the bees.

Need for a notation standard. To ensure that the IDs are interpreted
correctly after collecting the data, a standardized way of noting down the ID is
needed, that is followed by all researchers. Different researchers have in the past
used various notations, which in most cases only differed in minor aspects, for
example in what direction (clockwise or counter-clockwise) the tag was read, or
which bit on the tag was used as the starting point when writing the ID down
as a bit sequence. These differences, although minor, would lead to incorrect
data nonetheless if someone else interprets the ID in a different way since the
notation that was used is rarely recognizable from only looking at the written
ID.

Manual processing. Before the data can be used for analysis by software,
the data needs to be transferred manually from the written notes into a digital
format, taking up more time.

All of these problems call for a way to collect data of the visiting bees digi-
tally. The mobile application developed in the context of this thesis aims to be
a replacement for the paper forms that the researchers use at the feeder, making
the data collection easier, more efficient and more reliable. However, the use
   2 The term “ID” refers to the unique identification number encoded by a bee tag throughout

this thesis. Note that this does not imply a particular written representation of this number:
neither in terms of the numeral system used nor in terms of a set transformation method from
the bit pattern on the tag itself to the identification number.
1    INTRODUCTION                                                            4

cases of the application should not be limited to this kind of experiment alone
but should serve as a general tool for the documentation of bee IDs.3

    3 This   will be addressed again in section 5.1.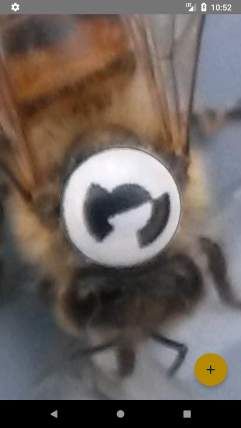
2    RELATED WORK                                                                      5

2      Related Work
Various different ways of documenting bee observations have been used in the
past while conducting similar experiments. Marking the visiting bee with paint
can be considered as one of the first and most popular methods. It was already
applied by Karl von Frisch [25] in his extensive studies of bee behavior but was
also used in more recent experiments examining the behavior of bees [23, 28, 22]
and other insects, such as ants [21]. The purpose of this method is to mark each
individual animal in a unique pattern, so that it can be recognized in later
observations, for example when studying its interactions with other individuals.
In the BeesBook project, each bee already having a pre-applied identification
tag renders the additional marking of bees at the feeder meaningless. Since the
bees’ IDs are also automatically detected in the hive by the camera system,
keeping track of them using the same ID makes the analysis easier.
    One possibility of potentially improving the method of data collection would
be the use of QR codes instead of the circular bee tags. QR codes are widely
used, so there is a vast amount of free mobile applications available to scan
them.4 Even if these applications turn out not to be sufficient on their own
to replace the current method of data collection (for example due to a lack
of features to export the data in a useful way or the possibility to annotate
the codes with information), several development frameworks implementing QR
code scanning capabilities exist (for instance the “Mobile Vision API” by Google
[12]). Such a framework could be used to develop an application that can scan
QR codes and is adapted to this use case. The downside of using QR codes
would be the difficulty to replace the existing tag system with a QR code system.
Firstly, switching to a different tag system would mean that substantial parts
of the automatic detection software would need to be adjusted or rewritten.
Secondly, even when using the smallest QR code version that currently exists5 ,
the data modules6 would still be smaller than the bit segments in the pattern
currently in use, if printed on a tag of the same size (see figure 3). The resolution
of the images recorded by the camera in the hive would most likely be too low to
decode the QR codes consistently. Increasing the resolution would require better
(and more expensive) camera equipment as well as more computing resources
while resulting in a larger amount of data to be stored.
    In conclusion, changing the existing tag system for the sole purpose of facil-
itating the data collection is unfeasible. The mobile application assisting in the
data collection should be designed to be used with the existing tags.

    4 Examples for Android: [4, 15]; Examples for iOS: [14, 16]
    5 Thesmallest QR code currently in existence is version M1 of the so-called “Micro QR
code”, for details see [11].
   6 The black or white squares that represent the bits in the code are called “modules”.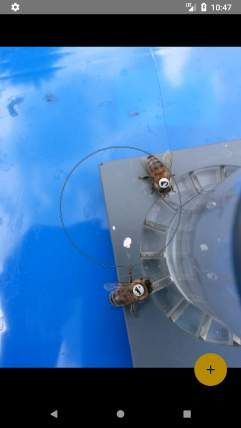
3   IMPLEMENTATION                                                               6

                        (a)                            (b)

     Figure 3: Size comparison of the data cells between (a): a Micro QR
     code (version M1) and (b): a bee tag following the current design. The
     modules on the QR code are considerably smaller than the bit segments
     on the bee tag, making them more difficult to detect in a low resolution
     image.

3     Implementation
3.1     Requirements
To be considered a better alternative to the current method of data collection
using paper forms, the mobile application should meet the following require-
ments:
    1. The researcher collecting data at the hive (the “user”) can note down in-
       dividual bee IDs together with the time of observation. This can be done
       efficiently and reliably, saving time during the data collection. The detec-
       tion and decoding process of the tags in the image should be automated
       as much as possible.
    2. The user does not need to remember a particular ID notation, i.e., a
       particular way of converting the bit pattern on the tag to a number.

    3. The data can be annotated with arbitrary notes or comments.
    4. The IDs are verifiable after the data collection.
    5. The data can be exported in a usable format for analysis or further pro-
       cessing.

Following these requirements, a general approach to the entry of data can be
drafted:
    • The observation of one or more bees is documented by taking a picture
      of the tag(s) using the camera on the mobile device. The picture is saved
      for the future verification of the collected data.

    • The tags are decoded with the image as a reference and later displayed
      using an overlay on top of the image. Having the picture as a reference
      makes the entry of the ID more convenient. The display of all marked tags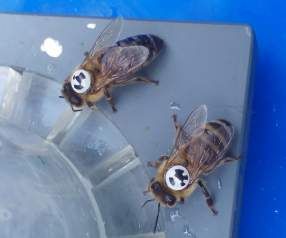
3 IMPLEMENTATION 7
on the image provides an overview of the IDs that are already documented,
which is helpful if the picture contains multiple tags.
• The IDs are entered using some sort of visual template, based solely on
the appearance of the bee tag. This means that users do not need to know
any representation of the ID as a bit sequence or decimal number, they
only need to know what the tag looks like.
• If needed, notes or labels can be added separately for each tag, as well as
a time of observation.
• The IDs are saved in some form of a database which is then exported. The
data also contains all additional information that was entered, including
the image on which the tag was marked.
3.2 Execution
3.2.1 Choice of platform
The application was developed for the Android operating system, due to its
wide-spread use compared to other platforms [9] and due to the development
being free of charge. Android Studio [1], the official IDE for Android by Google,
was used for development. For external code libraries utilized in the implemen-
tation, see [19, 7, 6, 10, 13, 8].
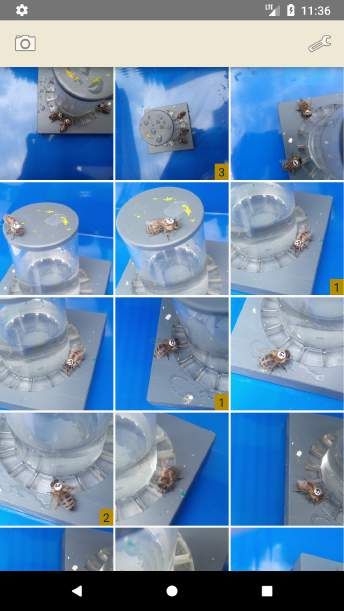
3.2.2 Gallery
Previously captured images can be browsed through in the gallery, which is the
first screen that opens after launching the application. Here, their thumbnails
are displayed in a grid, with a number in one corner indicating the number of
tags that have already been marked in the image (see figure 4a). Any number
of images can be selected and deleted, which also removes all marked tags that
they contain from the database (see figure 4b). The reason for removing the tag
entries is to keep the tags in the database consistent with the ones visible on the
images, since a tag entry could not be deleted anymore within the application
if only the image file were to be removed.
3.2.3 Image capture
Tapping on the camera icon at the top of the gallery screen opens a camera
application that can be used to take a picture of one or multiple bee tags. All
captured images are saved in a dedicated folder to separate them from other
images on the phone.
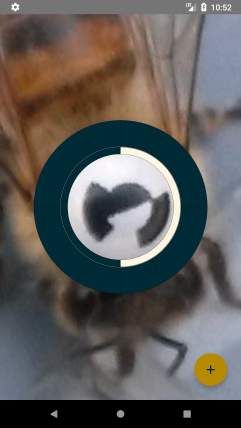
3.2.4 Decoding screen
Tapping on one of the thumbnails in the gallery opens the image and displays
it over the whole screen, where the user can move it and zoom in and out.
A bee tag is marked and decoded by dragging it into the circle overlay (see
figures 5a and 5b) and tapping on the button at the bottom of the screen. A
circular overlay is then displayed on top of the bee tag, representing the state
of its data bits (see figure 5c). Because the tag has not been decoded yet, this3 IMPLEMENTATION 8
(a) (b)
Figure 4: Gallery screen. (a): The image thumbnails are arranged in
a grid. The small numbers in the corners indicate the amount of tags
marked in the image. The camera button and settings button are located
at the top. (b): By holding down a finger on one of the thumbnails,
images are be selected. They can then be deleted by tapping on the
trash can icon in the top right corner.3 IMPLEMENTATION 9
(a) (b)
(c) (d)
Figure 5: Marking a bee tag in the image. A circle overlay is displayed in
the middle (a), into which a tag is moved (b). After pressing the button
at the bottom, the tag is marked by an overlay that is either blank (c)
or already contains an ID detected by a remote decoding server (d).3 IMPLEMENTATION 10
visualization still shows a tag with only black segments. The visualization, along
with the visualizations of all other tags, is continuously displayed, following the
movements and size changes of the image. This way, opening an image quickly
shows which bee tags have already been marked (see figure 6a for an example).
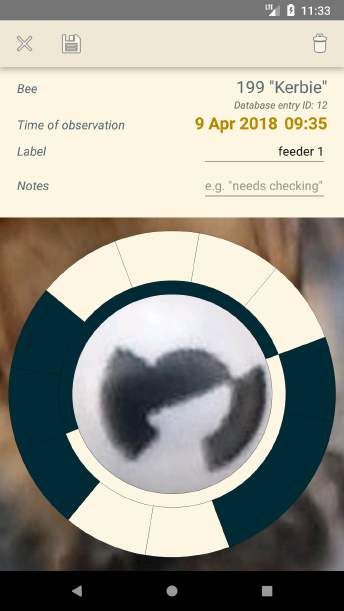
Tapping on an overlay opens a panel containing information about that tag
while moving its visualization to the bottom of the screen (see figure 6b). At
the top of the panel, the ID of the bee is displayed both as a decimal number
and a name7 . Below, the user can correct the time of observation8 of the bee, as
well as add a label or notes to the data entry. While the “Notes” field provides
an opportunity to enter any additional information if needed, the “Label” field
is intended to hold some kind of identifier or a keyword that can later be used
to separate or sort different data sets. For this reason, the “Label” field can
only hold one line of text, while the “Notes” field supports any number of lines.
The tag visualization below can be rotated and its data bits toggled to match
the actual bee tag that was photographed. The ID at the top is always updated
to show the decimal representation of the pattern in the tag visualization.
It is possible to speed up the entry of the bee ID by using a remote server to
decode the tag automatically. If the corresponding option is enabled (see section
3.2.5) and the button in the decoding screen is pressed, a request is issued to the
decoding server first, instead of immediately displaying a blank tag overlay. In
order for the decoding software to be able to recognize the tag, a square section
of the image that contains the tag is selected and prepared according to the
requirements of the software. The image section is cropped and scaled in such
a way that the tag is positioned in the center with a diameter of 50 pixels, and
the image has an overall resolution of 100*100 pixels. It is then encoded as an
8-bit grayscale PNG file and sent to the remote server in an HTTP request. The
server responds with the detected and decoded ID and orientation of the tag in
the image, which is then marked and visualized in the same way as a manually
entered tag (see figure 5d). The blue part of the data flow diagram in figure 7
shows the process of decoding a tag and saving and editing the database entry
(components 2, 3 and 4 respectively).
The remote server acts as an API endpoint to the decoding software that is
also used for the identification of the bee tags in the hive [2]. The software relies
on machine learning to detect and decode the tags. While a first version of the
API itself was already in place before the writing of this thesis, its performance
has been optimized and its functionality adapted to this use case. The API was
implemented using Flask, a Python web application framework [6].
3.2.5 Settings
The settings screen is accessed by tapping on the wrench symbol at the top of
the gallery screen. It is used for settings that usually need to be set only once
and are changed rarely. At the top, the automatic tag decoding by a remote
server can be toggled and the URL to the decoding server can be specified (see
figure 8a). Being able to switch the automatic decoding off is important in case
the user wants to reduce the device’s internet traffic (the device could be on a
cellular network). Furthermore, the user being able to resort to a manual way
7 This alias is uniquely assigned for each bee ID out of a generated set of names [3] and can
thus be used as an alternative to the decimal number.
8 The time of observation defaults to the last modified date of the image file.3 IMPLEMENTATION 11
(a) (b)
Figure 6: Editing and saving bee tags. (a): Image containing three
marked bees with their tag visualizations. (b): Tapping on a tag overlay
displays additional data, which can be edited. The bit segments in the
overlay can be toggled by tapping on them. Holding down a finger on
the visualization enables the adjustment of its orientation. Using the
three buttons at the top, the panel can be closed (cross icon), changes
saved (floppy disk icon) and the database entry deleted (trash can icon).3 IMPLEMENTATION 12
Figure 7: Data flow diagram showing the creation and processing of the
bee tag data in the application. The image capture is displayed in yellow
(1), the decoding procedure of the tags in blue (2-4) and the export of
the data in green (5-7).3 IMPLEMENTATION 13
(a)
(b) (c)
Figure 8: Settings screen. At the top, the decoding of bee tags by
a remote server can be configured (a). Tapping on the export button
below copies the tag database file to the “Download” folder and displays
a dialog enabling the sharing of the file with other applications on the
device (b, c).3 IMPLEMENTATION 14
of entering the IDs saves time waiting for a slow server response in case of a
bad internet connection and avoids any potential failures of functionality if the
server behaves in an unexpected way.
Underneath the server settings, a label can be entered that is automatically
added to each new tag entry. Since labels are intended to help with the or-
ganization of data sets (see section 3.2.4), in many cases the same label will
be assigned to all tags that are marked in one session of collecting data. This
option prevents the need to repeatedly enter the same label for every tag.
The display of a bee’s assigned name in addition to the decimal ID mentioned
in section 3.2.4 can be deactivated below.
3.2.6 Data export
Internally, each tag, including its bee ID, label, notes and time of observation
is saved in an SQLite database. To be able to display the tag visualizations in
the decoding screen correctly, the orientation and size of the tag in the picture,
as well as the filename of the picture is also stored.
SQLite [17] is a very commonly used light-weight open source database en-
gine. Due to its availability, an abundance of free software exists for the browsing
and processing of SQLite database files9 , hence there is no need for the data
to be converted to a different format to be used elsewhere. However, because
the application uses an abstraction layer integrated into the Android SDK, the
database file on the device is in most cases difficult to find or access. For this
reason, the settings screen contains a button at the bottom that copies the
database file to the accessible “Download” folder on the device. The file can
then also be shared with other applications on the device (see figures 8b and
8c), to facilitate the transfer of the file elsewhere, for example by attaching it
to an email or uploading it to a cloud storage system. In figure 7, this process
is shown in green (components 5, 6 and 7).
9 For examples, see [5, 18].4 EVALUATION 15
4 Evaluation
Usage of the application in a data collection process (e.g., for an experiment)
mainly involves these three actions:
1. Taking pictures of tags
2. Marking and decoding the tags
3. Exporting the data
The efficiency and reliability of these steps can be compared directly to the
previous, manual approach.
Taking pictures of the tags was in many cases already part of the process.
After bees arrive at the artificial feeder, the researcher on site would take a
picture of their tags before the bees leave again. Since this was usually done
with a smartphone, this part of the process remains exactly the same, apart
from the way the camera application is launched.
The second action, marking and decoding the tags, replaces the entry of bee
IDs on paper mentioned in section 1. Using the application is arguably more
convenient. Entering a bee ID requires the relatively small effort of zooming
onto the tag in the picture, rotating the overlay visualization on screen correctly
and matching its data bits to the data bits on the tag. Matching the data bits
involves tapping all bit modules that contain the wrong value (inverting them
as a result), as opposed to drawing all black segments of the tag into the paper
template in the previous approach. Although this method will likely already be
faster in comparison, the process is sped up even more when using the remote
server to automatically decode the tag, since this does not require any more
steps after pressing the decoding button. An exception to this is when the
server delivers an incorrect ID, but even in this case, entering the ID requires
the same steps as if the decoding server had not been used. Besides, correct
decoding results are returned fairly reliably, despite the fact that the images
captured by the mobile device have considerably different lighting conditions
than the images used to train the decoding software.10 The decoding request
and the response require around 8 kilobytes of data to be transferred in total,
which means that the tags can also be decoded while on a mobile internet
connection with a limited data plan.
The picture provides a constant and immediate reference to the actual bee
tag, reducing the likelihood of errors. It is used to enter the bee ID in a visual
way, after which it is converted to a decimal number automatically, without
the user needing to know the actual conversion method. This eliminates the
possibility of incorrect data due to differing notations mentioned in section 1.
During field experiments, the fact that the tag can be decoded to a decimal
number on-site also has the benefit that it can be compared more easily with
other tags. For example, checking if a given list of IDs contains the ID of
a bee at the feeder is far easier when the decimal representations of the IDs
can be compared. In these kinds of situations, the improved memorability and
10 From pictures taken during a field experiment in daylight outside, 60 tags were arbitrarily
chosen and decoded by the server. In 5 cases, the tag was not decoded correctly, all of them
with exactly one incorrect bit segment. In 3 of these cases, the sun was directly reflected as
a white spot in one of the black segments, causing it to be registered as a white segment.4 EVALUATION 16
recognizability of the generated names for the bees could be of additional help.
However, if the IDs are not needed immediately, the tags do not necessarily
have to be decoded on-site. The observation time of the tags being automatically
inferred from the last modified date of the image file offers the option of marking
the tags at a later time, for example after the data collection stage of the
experiment.
Compared to the copying of handwritten notes to a different format, the
amount of manual work required to use the recorded data is minimized in the
application. The exported SQLite file can be quickly transferred from the device
to a different location and provides a format that is usable and easily convertible
to other formats, such as CSV. The entered IDs can also be easily checked
for errors inside the application by comparing the tag on the picture with the
overlay. After the data is transferred, they can still be validated, although this
requires the additional exportation of the captured images and would have to
be done manually using the image name contained in the database.5 CONCLUSION AND FUTURE WORK 17
5 Conclusion and future work
5.1 Summary
For this thesis, an application was developed that facilitates the record keeping
of bee tags in the BeesBook project. Compared to the current manual method
of documentation, the application serves as an alternative that is more efficient
and convenient to use while making the entry of bee IDs more robust against
mistakes. Additionally, it provides a way of entering bee IDs visually while
exporting them in a digital format, resulting in a consistency in the decimal
representation of the tags that is integral to the prevention of errors in the
collected data.
Although an important use case of the application is the documentation of
bees at an artificial feeder, due to the relatively straightforward usage concept,
it can also be used in other situations where bee tags need to be noted down.
For example, when newly hatched bees are tagged, the ID of their tags and the
date on which the tag was applied need to be noted down. This data is later
used to determine the age of the bee. The application could prove to be useful
in any cases similar to these, where bee IDs need to be decoded and stored in a
database with a timestamp.
5.2 Further considerations
Even though the application provides the functionality to be used instead of
paper notes, it has yet to be tested in a real scenario. While the user interface
was designed from the ground up to be functional, but also minimalistic and
uncluttered, it will have to be used for some time to determine whether or not
it truly serves as an adequate replacement. One example would be that the
“Label” and “Notes” fields enable the addition of written information, but are
limited to text input. For a researcher that is used to drawing information onto
the form using arrows or illustrations, this would pose a restriction.
A few considerations can be made about further improvement in the future
of the application itself and the overall system of collecting data. Firstly, the
tag data is only stored on the device itself. As a result, it needs to be moved
or sent elsewhere before being used. Especially if multiple devices are in use
for data collection, this applies to all devices separately, and if their data is to
be used in one data set, the databases need to be merged first. To avoid or
simplify this manual organization of the data, an automated server-side storage
of the marked tags could be implemented, building upon the already established
server-side decoding process.
Another aspect that could be improved in the future is the organization of
pictures. While the application allows for the deletion of images, the pictures
cannot be structured or sorted into a folder structure. Moreover, the application
does not directly provide the means to export the image files together with the
tag data. These have to be transferred by using a file management application,
or by connecting the device to a computer.
The decoding of the tags also has the potential to be streamlined. Despite
the marking and decoding of the tags in the application being efficient, it still
requires the user to specify the location of each tag in the image individually.
This step could be skipped by automatically detecting tags in the image, which5 CONCLUSION AND FUTURE WORK 18
is already possible with existing software. The decoding software on the server
includes a module that can automatically detect the location of bee tags, as
long as they have the correct pixel diameter. Since all tags in an image usually
have roughly the same pixel size, the application could send the entire picture
to a server using this module, so that every tag is automatically marked and
decoded, without the need to specify their locations. This feature would be
especially helpful in situations like the one described in section 5.1, where some-
times an extraordinarily high amount of tags are photographed and need to be
documented. Although it ended up not being implemented in the application
due to lack of development time and a comparatively higher priority of other
features, support for this feature has been partly integrated into both the appli-
cation and the server, so developing it would not require a lot of effort. Another
way to automatically detect tags in the image would be to implement the de-
tection in the application itself. This would eliminate the need for a decoding
server entirely, but would also require even more effort and development time.
Lastly, it should be noted that using a smartphone with a customized ap-
plication for the data collection opens up possibilities for the researchers to
potentially have even more information at hand than just the ID of the bee
they photographed. In the future, if data about the bees and their visits to
feeders are stored remotely in a central database, more useful data for the ex-
periment could be fetched from it, like the age of the bees on the image, or the
date on which they were last seen at a feeder.REFERENCES 19
References
[1] Android Studio IDE. https://developer.android.com/studio/index.
html. Accessed on 04.04.2018.
[2] bb_pipeline (bee tag detection and decoding software). https://github.
com/BioroboticsLab/bb_pipeline. Accessed on 04.04.2018.
[3] beenames.csv (Mapping from bee IDs to names). https:
//github.com/BioroboticsLab/bb_utils/blob/master/bb_utils/
data/beenames.csv. Accessed on 09.04.2018.
[4] Blitz QR Scanner (Google Play Store). https://play.google.com/
store/apps/details?id=com.application_4u.qrcode.barcode.
scanner.reader.flashlight. Accessed on 08.04.2018.
[5] DB Browser for SQLite (open source software). http://sqlitebrowser.
org/. Accessed on 08.04.2018.
[6] Flask (Python web application framework). http://flask.pocoo.org/.
Accessed on 08.04.2018.
[7] Glide, version 4.2.0 (Android image loading library). https://github.
com/bumptech/glide. Accessed on 10.04.2018.
[8] Joda Time, version 2.9.9 (Java time library). http://www.joda.org/
joda-time/. Accessed on 10.04.2018.
[9] Market share of smartphone OS of total smartphone installed base
from 2013 to 2017. https://www.statista.com/statistics/385022/
smartphone-worldwide-installed-base-operating-systems-share/.
Accessed on 27.03.2018.
[10] MessagePack (cross-platform serialization library). https://msgpack.
org/. Accessed on 10.04.2018.
[11] Micro QR code. http://www.qrcode.com/en/codes/microqr.html. Ac-
cessed on 08.04.2018.
[12] Mobile Vision API (Google). https://developers.google.com/vision/.
Accessed on 08.04.2018.
[13] PNGJ (Java PNG encoding library). https://github.com/leonbloy/
pngj. Accessed on 10.04.2018.
[14] QR Code & Barcode Scanner (iTunes App Store). https://itunes.
apple.com/de/app/qr-code-barcode-scanner/id1048473097. Accessed
on 08.04.2018.
[15] QR Code Reader (Google Play Store). https://play.google.com/
store/apps/details?id=tw.mobileapp.qrcode.banner. Accessed on
08.04.2018.
[16] QR Code Scanner (iTunes App Store). https://itunes.apple.com/de/
app/qr-code-scanner/id1200318119. Accessed on 08.04.2018.REFERENCES 20
[17] SQLite. https://www.sqlite.org/. Accessed on 08.04.2018.
[18] SQLite Browser (online tool). https://sqliteonline.com/. Accessed on
08.04.2018.
[19] Subsampling Scale Image View, version 3.6.0 (library for im-
age interaction and overlays). https://github.com/davemorrissey/
subsampling-scale-image-view. Accessed on 10.04.2018.
[20] F. Boenisch, B. Rosemann, B. Wild, F. Wario, D. Dormagen, and T. Land-
graf. Tracking all members of a honey bee colony over their lifetime. 2018.
[21] T. Fasciano, H. Nguyen, A. Dornhaus, and M. C. Shin. Tracking multiple
ants in a colony. IEEE Workshop on Applications of Computer Vision
(WACV), 2013.
[22] J. Goyret and W. M. Farina. Non-random nectar unloading interactions
between foragers and their receivers in the honeybee hive. Naturwis-
senschaften, 92(9):440–443, 2005.
[23] R. T. Jack-McCollough and J. C. Nieh. Honeybees tune excitatory and in-
hibitory recruitment signalling to resource value and predation risk. Animal
Behaviour, 110:9–17, 2015.
[24] D. Naug. Structure of the social network and its influence on transmis-
sion dynamics in a honeybee colony. Behavioral Ecology and Sociobiology,
62(11):1719–1725, 2008.
[25] K. von Frisch. Über die "Sprache" der Bienen, eine tierpsychologische Un-
tersuchung. G. Fischer, 1923.
[26] F. Wario, B. Wild, M. J. Couvillon, R. Rojas, and T. Landgraf. Auto-
matic methods for long-term tracking and the detection and decoding of
communication dances in honeybees. Frontiers in Ecology and Evolution,
3, 2015.
[27] B. Wild, L. Sixt, and T. Landgraf. Automatic localization and decoding of
honeybee markers using deep convolutional neural networks. 2018.
[28] M. K. Wray, B. A. Klein, and T. D. Seeley. Honey bees use social infor-
mation in waggle dances more fully when foraging errors are more costly.
Behavioral Ecology, 23(1):125–131, 2011.You can also read