Flux.Land: A Data-driven Toolkit for Urban Flood Adaptation
←
→
Page content transcription
If your browser does not render page correctly, please read the page content below
Full Paper 381

Flux.Land: A Data-driven Toolkit for
Urban Flood Adaptation
Isaac Seah1, Fadi Masoud2, Fabio Dias2, Aditya Barve3, Mayank Ojha3, Miho Mazereeuw3
1University of Toronto, Centre for Landscape Research, Ontario/Canada ·
isaac.seah@mail.utoronto.ca
2University of Toronto, Centre for Landscape Research, Ontario/Canada
3Massachusetts Institute of Technology, Urban Risk Lab, Massachusetts/USA

Abstract: Climate-change-induced hazards are causing large scale displacements of communities, de-
struction of property, and disruption of critical infrastructure. These increasingly unpredictable climate
events result in complex and cascading impacts, emphasizing the need for comprehensive, data-driven,
multidisciplinary design and planning toolkits. To effectively adapt to such unpredictability, these
toolkits must consider a complex network of interdependencies – a range of interconnected factors,
datasets, and stakeholders – that influence the planning process. With the emergence of powerful and
accessible web-based computational capabilities, there is an opportunity to enhance risk management
tools and allow for data-driven planning and design scenarios to support adaptive infrastructure provi-
sions and retrofits. This paper shares the development of Flux.Land, an accessible and collaborative
spatial decision support system (SDSS), allows community and planning agencies to visualize climate
impacts and take collective action. In the context of flood-prone Broward County, Florida, this paper
showcases how a large corpus of data-driven design and planning scenarios can be generated through
the systematic definition of quantifiable design goals, evaluation metrics, and curation of computation-
ally derived design recommendations. Through Flux.Land, we illustrate how data-driven, collaborative,
web-based toolkits can be harnessed for data-driven planning and decision making across geographical,
social, and environmental scales.
Keywords: Climate change, urban flooding, risk management toolkits

1 Introduction
Many cities around the world are experiencing more frequent rainfall events, storm surge,
saltwater intrusion, and an increased risk of urban flooding due to climate change
(HETTIARACHCHI et al. 2018). The intensification of unpredictable weather events results in
significant impacts at the environmental, geographical, and social levels (DOOCY et al. 2013).
As cities attempt to prevent and reduce the negative impacts of climate change, critical urban
issues related to these impacts are often treated independently (BETTENCOURT & GEOFFREY
2010). This lack of cross-sectoral collaboration can result in ineffective policy-making and
urban planning, sometimes leading to unfortunate and “disastrous unintended consequences”
(JABAREEN 2013). For instance, design of hard and mechanical infrastructures such as levees
or seawalls that are not sensitive to future cascading impacts can prove to be inadequate to
future climatic conditions, either because of their limited assumed variability (MILLY et al.
2008), or inaccurate climate projections (JOHN & WICKEL 2009). Some of these conse-
quences result in increasing socio-economic vulnerability of many low-lying coastal cities
by precipitating adverse impacts of disasters such as flooding. Some projections depict that
the cost of future flood losses in South Florida could be over US$ 50 billion (€ 41.4 billion)
by 2050 (HALLEGATTE et al. 2013); while others indicate a 1.8m sea-level rise by 2100 would
displace over two million people (OPPENHEIMER et al. 2019). To avoid such consequences,

Journal of Digital Landscape Architecture, 6-2021, pp. 381-392. © Wichmann Verlag, VDE VERLAG GMBH ·
Berlin · Offenbach. ISBN 978-3-87907-705-2, ISSN 2367-4253, e-ISSN 2511-624X, doi:10.14627/537705034.
This article is an open access article distributed under the terms and conditions of the Creative Commons
Attribution license (http://creativecommons.org/licenses/by-nd/4.0/).
382 Journal of Digital Landscape Architecture · 6-2021

planners and stakeholders should not only consider physical vulnerabilities, but also socio-
economic and environmental aspects (TINGSANCHALI 2012).
With difficult-to-quantify social, environmental, and economic dimensions involved in cli-
mate change adaptation, one strategy devised to address the ‘ill-structured’ problem domain
is the utility of spatial decision support systems (SDSS) and visualization tools for adaptation
planning (LIESKE 2015). Referencing Goudine’s Climate Visualizations for Adaptations
Products (CVAP) framework, existing SDSS and visualization tools can be categorized into
the spectrum of “Inform”, “Consult'', “Involve”, and “Partner” themes (GOUDINE et al. 2020).
As SDSS and visualization tools move from “Inform” to “Partner” engagement themes, they
become increasingly interactive, realistic, and suitable for high-risk decision making.
Within the “Inform” engagement theme, SDSS and visualization tools are often used to sup-
port decisions associated with lower risk in terms of outcomes and impacts; most often used
to present, rather than produce research findings (GOUDINE et al. 2020). Examples include
SimilarityExplorer, a visual inter-comparison tool that allows for filtering and cross-compar-
ison of climate level data but does not reflect a high accuracy of data related to vital public
infrastructure or demographic data (POCO et al. 2014). On the other end of the spectrum, the
“Partner” theme in the CVAP’s framework describes realistic SDSS and visualization tools
that allow for interactivity, communication and fostering ‘partner-like’ relationships between
decision-makers and stakeholders, facilitating decision making processes with a high level
of inherent risk. Examples of such tools include the Mobile Augmented Reality (MAR) app,
where a user is allowed to track an unspecified location, populate it with geometry, and vis-
ualize an augmented reality flooding of that environment (HAYNES et al. 2018).
The research team from the University of Toronto’s Centre for Landscape Research (CLR)
and MIT’s Urban Risk Lab (URL) has developed Flux.Land to address the increasingly com-
plex problem domain in climate change adaptation. Flux.Land is a web-based SDSS that
extends the functions described in CVAP’s “Partner” engagement theme to facilitate discus-
sions in situations where solutions to climate-driven urban planning problems are not appar-
ent (GOUDINE et al. 2020), but involve a high level of inherent risk. Flux.Land aims to facil-
itate these discussions through the three following approaches:
1. Developing data visualization features on Flux.Land to visualize precise geospatial data
 sets
2. Implementing data clustering algorithms and tools on Flux.Land for rapid analysis of
 hidden relationships across social, environmental, and economic dimensions
3. Introduce an integrated, data-driven design and scenario planning methodology, allowing
 stored data points on Flux.Land to be used to generate data-driven recommendations,
 enabling use cases such as rapid prototyping of land use intents
By combining visualization and analytical capabilities with the latest data-driven design
methodologies, Flux.Land is able to foster greater interactivity and understanding of the in-
tertwining relationships that exist between climate change, environment, social and economic
factors.
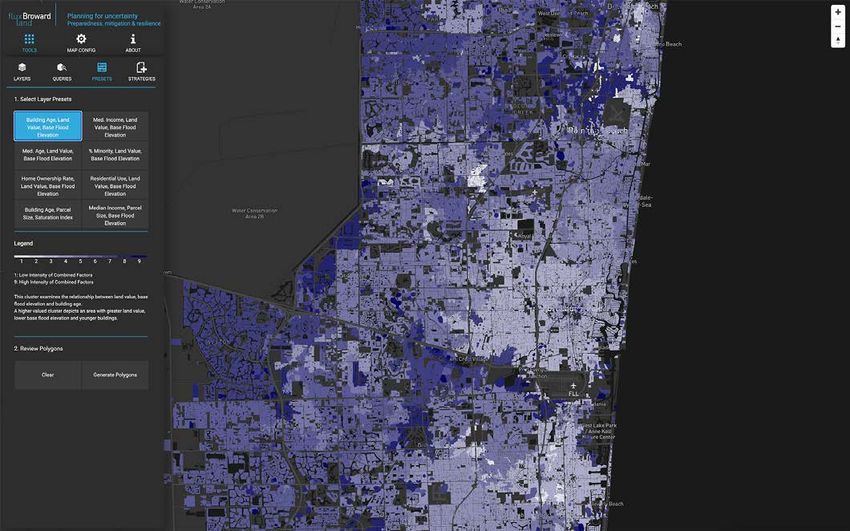
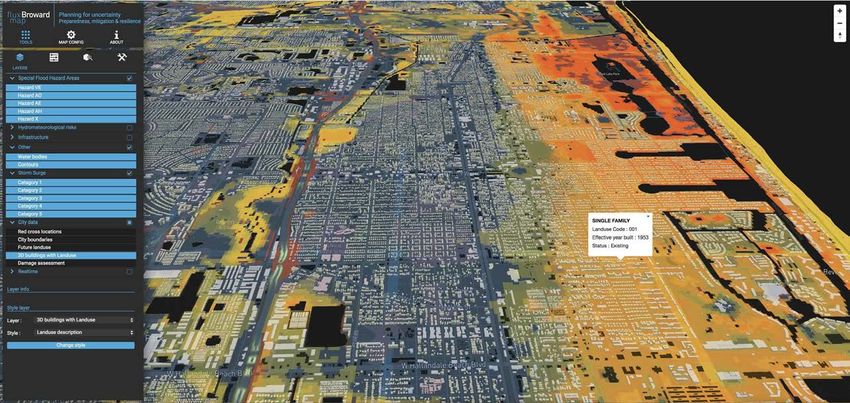
I. Seah et al.: Flux.Land: A Data-driven Toolkit for Urban Flood Adaptation 383

2 Methods: Integrating Data Visualization, Data Analytics, and
 Data-driven Design
Using Broward County’s urban-flooding vulnerability as the subject of study, Flux.Land fo-
cuses on the environment, infrastructure, and demographic datasets of the region. This data
was collected from Broward County’s open-source data platforms (BROWARD COUNTY
GOVERNMENT 2019), cross-referenced with land-parcel data, and further hosted on cloud-
based database servers. The data was then processed for visualization through each of
Flux.Land’s different modules. These modules include data visualization and querying, clus-
tering presets, and data-driven design examples.

2.1 Data Visualization Capabilities
For Flux.Land’s data visualization capabilities, we developed two main interfaces: a 3D/ or-
thographic map view and a sectional tool that correlates elevational information of streets,
water bodies, and future sea-level rise impacts on groundwater tables. Flux.Land’s 3D/ortho-
graphic map view allows for layered visualization and analysis of geospatial data (Figure 1).
A user can use this view to identify relationships across a diverse set of factors such as in-
come, elevation saltwater intrusion areas, and flood risk zones. Flux.Land’s sectional tool
allows for the visualization of above and below ground data, highlighting the relationship
between groundwater and surface elevation considering sea-level rise (Figure 2). Emphasis
was placed on the platform’s simple navigation and design aimed at stakeholders from vary-
ing degrees of expertise – from the general public to planners. These visualization approaches
were adopted as they have shown to be effective in the exchange of views on spatial decision
problems (ANDRIENKO et al. 2007). In addition, collaborators using a shared map interface
often experienced a heightened awareness of different scopes relevant to other collaborators,
allowing for more efficient inter-disciplinary discussions (ARCINIEGAS & JANSSEN 2012).

Fig. 1: Flux.Land’s 3D orthographic map view
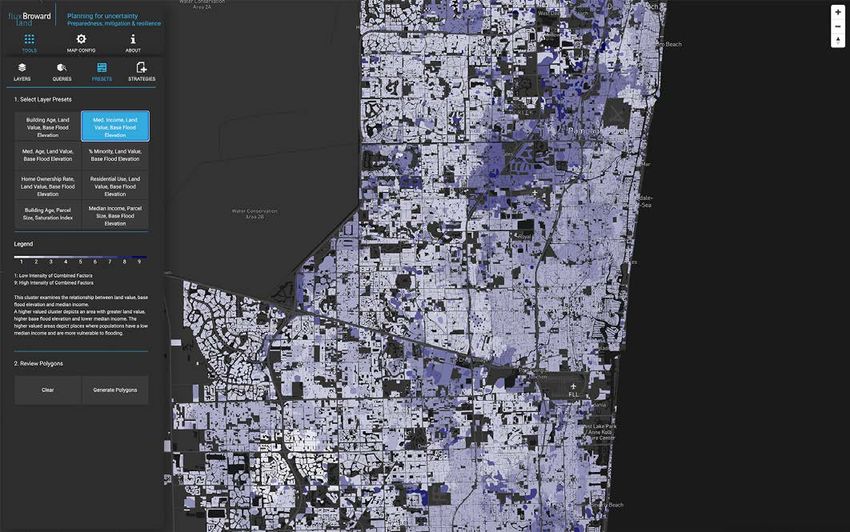
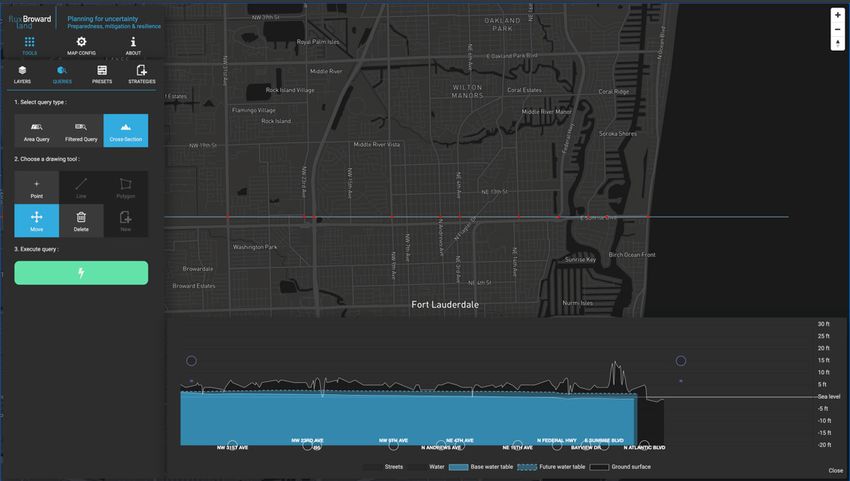
384 Journal of Digital Landscape Architecture · 6-2021

Fig. 2: Sectional tool depicting relationship between groundwater, surface elevation and
 water bodies

2.2 Hierarchical Clustering: Identifying Latent Relationships
While planning processes are often constrained within the administrative boundaries, the im-
pacts of climate change and climate disasters are not (YOO et al. 2011). A hierarchical data
clustering feature was developed in order to elicit these underlying similarities and differ-
ences within areas of interest beyond simple visualization of datasets across administrative
boundaries. Contrary to conventional tapestry segmentation where a model of social classi-
fications is created with segments of neighbourhood derived addresses (ESRI 2020),
Flux.Land’s hierarchical clustering allows segments to form from a confluence of geospatial,
social and environmental data that are often not bounded by administrative boundaries. By
visualizing geographical clusters with similar properties, identified through a hierarchy-
based relationship tree (algorithm 1), Flux.Land can highlight latent relationships across so-
cial, economic, and environmental factors and provide impetus to collaborate across admin-
istrative divisions to overcome these issues. Here, the clustering feature identifies different
non-administratively bounded regions that have shared characteristics, enabling policymak-
ers and stakeholders to effectively deploy different climate adaptation strategies based on
different vulnerability patterns that transcend physical factors.
On Flux.Land, a set of parcel-level features for clustering were selected via working sessions
with government officials from Broward County’s Environmental Planning and Community
Resilience Division. In order to represent three general areas of interrelated impacts – age
and affordance of the built fabric, latent socio-economic factors, and future forecasts, clusters
were generated based on selected features that include building age, land value, base flood
elevation, median income, percentage of minorities, homeownership rate and residential
building usage. Once the features for clustering were identified, the overall clustering ap-
proach can be broken into 3 main steps: (1) generation of clusters based on input geospatial,
I. Seah et al.: Flux.Land: A Data-driven Toolkit for Urban Flood Adaptation 385

parcel-level data, (2) creation of a cost layer to present relationships between identified clus-
ters and (3) visualization and analysis of resulting clusters (Figure 3).

Fig. 3: Workflow to create clusters that have shared characteristics

Using parcel-level data, neighbourhoods and regions of similarity were generated using an
agglomerative clustering algorithm (algorithm 1). We first identified the distribution of each
parcel-level feature across Broward County. Then, we implemented a distance function to
derive a relationship tree based on the variance between each feature in a group of parcels,
relative to each parcel’s feature’s position in the overall distribution (DIAS & SILVER 2018).

Algorithm 1: Hierarchical Agglomerative Clustering (DIAS & SILVER 2018)
 1: Input: Parcel data { }
 =1 , group-wise distance ( , )

 2: ← ∅ > There are 0 clusters in the Active Set at the start
 3: for < 1 … do
 4: ← ∪ {{ }} > Each parcel is added as a cluster to the Active Set
 5: ← > Create a tree containing every cluster generated
 6: while | | > 1 do > Loop until all parcels are in a single cluster
 7: 1∗ , 2∗ ← ( 1 , 2 ) > group parcels with the smallest distance
 8: ← ( ∖ { 1∗ }) ∖ { 2∗ } > remove individual cluster/parcels from Active Set
 9: ← ∪ { 1∗ ∪ 2∗ } > add resulting cluster into Active Set
 10: ← ∪ { 1∗ ∪ 2∗ } > add resulting cluster into tree
 11: end while

The resulting clusters of similarity were then joined against a cost layer that was developed
based on a heuristic equation derived from the normalized values of the factors of interest,
highlighting the hierarchical relationships between each cluster. In the current implementa-
tion, the weights for each factor of interest are identified and refined via working sessions
with stakeholders, where factors of greater importance to existing planning problems are
given higher weights.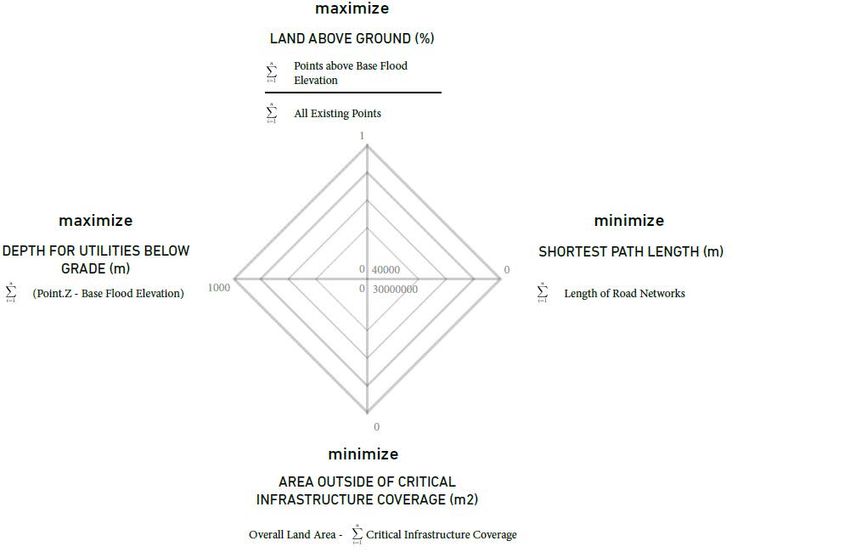
386 Journal of Digital Landscape Architecture · 6-2021

Cost Layer Equation
 ( 1 − 1 ) ( 2 − 2 ) ( 3 − 3 )
 = + +
 ( 1 − 1 ) ( 2 − 2 ) ( 3 − 3 )
 = cost of region
 F1, F2, F3 = values of factors
 , , = pre-defined weights

The resulting clusters were then uploaded onto Flux.Land, enabling users to examine latent
relationships across geographical areas and interdisciplinary factors.

2.3 Data-driven Design Methodology
Building on the data points and clusters embedded on Flux.Land, we further propose an in-
tegrated data-driven design and scenario planning methodology, where government officials,
planners, or individuals are able to use the data points stored on the platform to generate a set
of data-driven recommendations. Using contextual-specific data points and clusters gener-
ated on the platform, a practitioner can leverage the platform’s information database to make
better design decisions. The integrated data-driven design methodology can be summarized
in three key steps: (1) defining design priorities and goals, (2) quantifying evaluation metrics
and design parameters, (3) design discovery, optimization, and curation of design recommen-
dations.
In the first step, two key design goals were established for this initial study in the context of
South Florida by reducing flood risk for 2.5 million residents by generating interconnected
open-space networks of floodable low-lying parcels, and increasing land values and the mu-
nicipal tax-base by maximizing developable, infrastructurally connected parcels on high-
ground.

Fig. 4: Goals, evaluation metrics and design parameters designed to reduce flood risk and
 increase land value
I. Seah et al.: Flux.Land: A Data-driven Toolkit for Urban Flood Adaptation 387

The second step of the data-driven design methodology further distills each design goal into
evaluation metrics and the urban morphology into constituent design parameters through an
iterative design process. For Flux.Land’s initial proof-of-concept, land value was evaluated
by a combination of coverage by critical infrastructure, the distance of property parcel to
transportation networks, and below-grade utility space. To evaluate flood risk, the amount of
percentage of land above ground was calculated. These evaluation metrics were then further
broken down into design parameters, including the location of critical infrastructure, the ra-
dius of critical infrastructure coverage, areas for cut and fill process, and sea-level rise sce-
narios (Figure 4).
Finally, in the third step, these design parameters and evaluation metrics were processed with
the Galapagos library (RUTTEN 2013), a suite of evolutionary algorithms via Rhino3D. The
algorithm iterates through permutations of defined parameters, producing recommendations
that are performed based on the defined evaluation metrics. These recommendations would
then serve as a starting point for further in-depth design ideation, or land-use zoning recon-
siderations.
For our study with Broward County, using the goals, evaluation metrics and defined param-
eters (Fig. 4), a series of conceptual urban landscape configurations were parametrically gen-
erated using simulated ‘cut and fill’ processes, in tandem with rising sea levels. By simplify-
ing a digital elevation surface model of the existing urban landscape into a grid of 3D eleva-
tion points and evaluating the gradient between each point, the availability of land above
water, and the area of a given radius around each point, we were able to identify which point
on the surface was the most optimal for cut-and-fill processes at each increment in sea level
rise. By simulating the sea level rise of 0.25, 0.5, and 0.75 metres, we were able to observe
how sea-level rise affects the generated urban landscape configurations.

3 Results and Discussion
To test the implementation of Flux.Land, review sessions were held with Broward County’s
Environmental Planning and Community Resilience Division on the 10th of July 2019 and
18th February 2020. Feedback was provided for our implementations of data visualization,
clustering, and data-driven design methodology on the Flux.Land platform.
On Flux.Land’s data visualization capabilities, reviewers found its 3D/orthographic map
view (Fig. 1) to be intuitive, especially users who had prior experiences in GIS technologies.
Reviewers also found the sectional tool (Fig. 2) to be very useful in capturing quick snapshots
of the water table in geographically sensitive locations like airports for preliminary planning
discussions. In time-sensitive situations, Flux.Land provides a more accessible method to
quickly retrieve analytical data, as compared to requiring specialized GIS software and data
science teams to access and analyze similar data. However, as the platform is not currently
equipped with a self-serve data upload capability, reviewers voiced the need for SDSS plat-
forms like Flux.Land to be equipped with data management features that allow for new geo-
spatial datasets to be uploaded, removed, and managed easily. This would allow the platform
to be updated based on the evolving needs of the users.
Using the parcel-level features and weights defined by stakeholders from Broward County,
reviewers were also presented with the results of Flux.Land’s data clustering feature. For
each combination of factors, the primary factor of interest was assigned a weight of 0.4, and
388 Journal of Digital Landscape Architecture · 6-2021

secondary factors were assigned a weight of 0.3 each in the cost layer which was used to
derive the relationships between each cluster. The reviewers’ observations of the clusters
presented are as follows:

Table 1: Observations of cluster results
No. Factors Cluster Description Reviewer’s Observations
1 Building age, The resultant clusters examine the Reviewers identified that areas
 land value, relationship between land value, base with greater land value, lower
 base flood flood elevation, and building age. base flood elevation and younger
 elevation A higher-valued cluster depicts an buildings were deeper inland,
 area with greater land value, lower whereas regions close to the
 base flood elevation and younger downtown core were most vulner-
 buildings. able to urban flooding and had
 older buildings (Figure 5).
2 Median in- The resultant clusters examine the Reviewers identified that the
 come, land relationship between median income, median income was lower in the
 value, base parcel size and base flood elevation. downtown core, where communi-
 flood eleva- A higher-valued cluster depicts an ties were more susceptible to
 tion area with lower median income, flood risk due to higher base flood
 higher base flood elevation and higher elevation (Figure 6).
 land value.
3 Median age, The resultant clusters examine the Reviewers identified that popula-
 land value, relationship between land value, base tions with higher median age and
 base flood flood elevation and median income. a higher risk of displacement due
 elevation A higher-valued cluster depicts an to flood vulnerability were more
 area with greater land value, higher likely to be located along the
 base flood elevation and higher me- coastal areas.
 dian age.
4 Percentage The resultant clusters examine the Reviewers identified that the per-
 of minorities, relationship between land value, base centage of minorities was higher
 land value, flood elevation and percentage of mi- in the downtown core, where base
 base flood norities. flood elevation was higher, result-
 elevation A higher-valued cluster depicts an ing in higher flood vulnerability.
 area with greater land value, higher
 base flood elevation and higher per-
 centage of minorities.
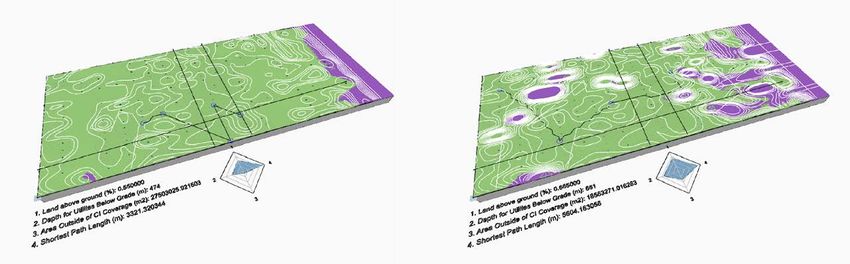
I. Seah et al.: Flux.Land: A Data-driven Toolkit for Urban Flood Adaptation 389

Fig. 5: Cluster indicating the relationship between building age, land value, base flood ele-
 vation. Darker colored clusters depict areas with greater land value, lower base flood
 elevation, and younger buildings.

Fig. 6: Cluster indicating the relationship between median income, land value, base flood
 elevation. Darker colored clusters depict areas with lower median income, higher
 base flood elevation, and higher land value.

Using the resultant clusters, the team further tested the proposed data-driven design method-
ology and produced a series of landscape configurations based on the parameters defined
(Fig. 4). The blue areas on the plotted areas in Figure 7 indicate water bodies, and the white
lines indicate the topographical contour of the site of study. The two configurations depict
how the contours of the area of study could change as more cut-and-fill operations are applied
as sea level rises. The left diagram depicts conditions before cut and fill operations and sea-
390 Journal of Digital Landscape Architecture · 6-2021

level rise, while the right diagram depicts conditions at 0.75m sea-level rise. These configu-
rations were then consequently evaluated against the expanded evaluation metrics (Figure 8).

Fig. 7: Parametrically derived landscape studies

Fig. 8: Expanded evaluation metrics illustrated as a spider chart

The resulting configurations exemplify how our data-driven design methodology can be ap-
plied to data points on SDSS like Flux.Land, and be used to parametrically generate planning
configurations, while allowing practitioners to measure the performance of the configurations
using the defined evaluation metrics.

4 Next Steps
While the processes and features highlighted above have been contextualized for Broward
County, this approach can easily be extended for other jurisdictions as well. The feedback
retrieved from reviewers of the platform will continue to shape future iterations of Flux.Land
and other similar types of SDSS. In future deployments of Flux.Land, an API first approach
will be taken when integrating data sets onto the platform, so that organizations can continue
I. Seah et al.: Flux.Land: A Data-driven Toolkit for Urban Flood Adaptation 391

to visualize updated data in a self-serve manner. We also plan to add more features to enhance
the usability of the platform – for example providing customizable topographic representa-
tional options like colours and annotation tools for greater interactivity with geospatial da-
tasets. We are also in the process of conducting a formal usability evaluation of the platform
to understand how it has impacted users, ranging from urban planning practitioners to school
students.
The current versions of the parametrically generated designs for Broward County have also
demonstrated that the platform can facilitate smarter decision making within the defined con-
straints. With these results, we intend to further refine the robustness of the clustering algo-
rithm and extend the application of the data-driven design methodology in more complex
urban scenarios through continued collaboration with different agencies that can benefit from
Flux.Land.

5 Conclusion
With increasing complexity in the problem space of climate resilience and adaptation, there
is a pressing need for more interactive and collaborative tools so that cross-disciplinary col-
laboration can happen more effectively. Through Flux.Land’s visualization, analytics, data-
driven design, and planning features, we illustrate how SDSS and visualization tools can be
extended to become participatory design tools. As computing power continues to increase,
analytical tools will become more sophisticated in describing the complex social, environ-
mental, and economic factors that determine the form and function of urban landscapes. As
such, tools like Flux.Land have the potential to become more assistive in the design and
management of climate-informed adaptation planning. As seen in the context of Broward
County, Flux.Land is a nascent example of how data-driven, collaborative, web-based
toolkits can be harnessed for data-driven planning and decision-making across scales. Here,
Flux.Land enabled human decision-makers to experiment and understand the nuanced rela-
tionship between geographical, social, and environmental context through customizable da-
tasets; advancing the efficiency and robustness of design-based decisions in the face of highly
complex planning scenarios. By enhancing access to the underlying data and presenting it in
an easily digestible manner to a wider audience, tools like Flux.Land will also help make the
resilience planning processes become more participatory and equitable. The development of
Flux.Land was carried out with an understanding that vulnerability to disasters and climate
change is underpinned by complex socio-political processes, and by providing a way to vis-
ualize some of these complexities, SDSS tools may help in mitigating the impacts of chang-
ing climate.

References
ANDRIENKO, G., ANDRIENKO, N., JANKOWSKI, P., KEIM, D., KRAAK, M.‐J., MACEACHREN,
 A. & WROBEL, S. (2007), Geovisual analytics for spatial decision support: Setting the
 research agenda. International Journal of Geographical Information Science, 21 (8), 839-
 857.
ARCINIEGAS, G. & JANSSEN, R. (2012), Spatial decision support for collaborative land use
 planning workshops. Landscape and Urban Planning, 107 (3), 332-342.
392 Journal of Digital Landscape Architecture · 6-2021

BETTENCOURT, L. & GEOFFREY, W. (2010), A unified theory of urban living. Nature, 467,
 912-913.
BROWARD COUNTY GOVERNMENT (2019), Broward County Geohub.
 https://geohub-bcgis.opendata.arcgis.com/.
DIAS, F. & SILVER, D. (2018), Visualizing demographic evolution using geographically in-
 consistent census data. UT Sociology Working Paper No. 2018-03.
 http://sociology.utoronto.ca/wp-content/uploads/2018/04/Working-Paper-2018-03.pdf.
DOOCY, S., DANIELS, A., MURRAY, S. & KIRSCH, T. D. (2013), The human impact of floods:
 a historical review of events 1980-2009 and systematic literature review. PLoS currents,
 5, ecurrents.dis.f4deb457904936b07c09daa98ee8171a.
 doi:10.1371/currents.dis.f4deb457904936b07c09daa98ee8171a.
ESRI (2020), Methodology Statement: 2020 Esri Tapestry Segmentation.
 https://downloads.esri.com/esri_content_doc/dbl/us/J9941_Tapestry_Segmentation_Met
 hodology_2020_r.pdf.
GOUDINE, A., NEWELL, R. & BONE, C. (2020), Seeing Climate Change: A Framework for
 Understanding Visualizations for Climate Adaptation. ISPRS International Journal of
 Geo-Information, 9 (11).
HALLEGATTE, S., GREEN, C., NICHOLLS, R. J. & CORFEE-MORLOT, J. (2013), Future flood
 losses in major coastal cities. Nature Climate Change, 3 (9), 802-806.
HAYNES, P., HEHL-LANGE, S. & LANGE, E. (2018), Mobile Augmented Reality for Flood Vis-
 ualisation. Environmental Modelling & Software, 109, 380-389.
HETTIARACHCHI, S., WASKO, C. & SHARMA, A. (2018), Increase in flood risk resulting from
 climate change in a developed urban watershed – the role of storm temporal patterns.
 Hydrology and Earth System Sciences, 22 (3), 2041-2056.
JABAREEN Y. (2013), Planning the resilient city: Concepts and strategies for coping with cli-
 mate change and environmental risk. riskCities, 31, 220-229.
JOHN H. M. & WICKEL, A. J. (2009), Embracing uncertainty in freshwater climate change
 adaptation: A natural history approach. Climate and Development, 1 (3), 269-279.
LIESKE, D. J. (2015), Coping with climate change: The role of spatial decision support tools
 in facilitating community adaptation. Environmental Modelling & Software, 68, 98-109.
MILLY, P. C., BETANCOURT, J., FALKENMARK, M., HIRSCH, R. M., KUNDZEWICZ, Z. W.,
 LETTENMAIER, D. P. & STOUFFER, R. J. (2008), Climate change. Stationarity is dead:
 whither water management? Science, 319 (5863), 573-574. doi:10.1126/science.1151915.
OPPENHEIMER, M., GLAVOVIC, B., HINKEL, J., WAL, R., MAGNAN, A., ABD-ELGAWAD, A.,
 CAI, R., CIFUENTES-JARA, M., DECONTO, R. & GHOSH, T. (2019), Sea level rise and im-
 plications for low lying islands, coasts and communities. The Intergovernmental Panel on
 Climate Change.
POCO, J., DASGUPTA, A., WEI, Y., HARGROVE, W., SCHWALM, C., COOK, R., BERTINI, E. &
 SILVA, C. (2014), SimilarityExplorer: A Visual Inter-Comparison Tool for Multifaceted
 Climate Data. In: Computer Graphics Forum, 341-350.
RUTTEN, D. (2013), Galapagos: On the Logic and Limitations of Generic Solvers. Architec-
 tural Design, 83, 132-135. https://doi.org/10.1002/ad.1568.
TINGSANCHALI, T. (2012), Urban flood disaster management. Procedia Engineering, 32, 25-
 37.
YOO, G., HWANG, J. H. & CHOI, C. (2011), Development and application of a methodology
 for vulnerability assessment of climate change in coastal cities. Ocean & Coastal Man-
 agement, 54 (7), 524-534.
You can also read