Development Viability Assessment and the Provision of Affordable Housing. A Game of 'Pass the Parcel'? - Discussion Paper
←
→
Page content transcription
If your browser does not render page correctly, please read the page content below
Real Estate & Planning

Discussion Paper

Development Viability Assessment
and the Provision of Affordable
Housing. A Game of ‘Pass the Parcel’?
February 2018

Neil Crosby
Henley Business School, University of Reading

Discussion Paper Number:
REP-2018-01

The aim of this discussion paper series is to
disseminate     new     research   of   academic
distinction.   Papers   are   preliminary   drafts,
circulated to stimulate discussion and critical
comment. Henley Business School is triple
accredited and home to over 100 academic
faculty who undertake research in a wide range of
fields from ethics and finance to international
business and marketing.

pgrep@reading.ac.uk

www.henley.ac.uk/rep

© Crosby, February 2018

ii                                                    © Crosby, February 2018
Henley Discussion Paper Series

Development Viability Assessment and the Provision of
Affordable Housing. A Game of ‘Pass the Parcel’?

Abstract
Development Viability Assessment is now a central plank in UK national planning policy and the
residual property valuation model is used by landowners, developers and the local authorities to
determine the level of planning obligations that can be sought from the developers/landowners
in exchange for the grant of permission to develop. The Government requires that local planning
authorities do not ask for contributions that will stifle development and that LPAs should ensure
that developers and landowners get a ‘competitive return’.

There is now a body of academic and other comment that the viability assessment regime has
acted to ensure that not only do landowners and developers get a competitive return, the system
allows them to receive more than that at the expense of the LPA. This paper briefly reviews this
literature and constructs a hypothetical case study to examine the process; specifically the impact
of Planning Practice Guidance (PPG) on two specific inputs into the development
appraisal/viability model.

The paper illustrates that the two aspects – ignoring changes in values and costs over the
development period coupled with instructions that comparable evidence is proof of policy
compliant land prices – are fundamentally flawed and a major cause of the reduction in the
delivery of planning obligations. Government needs to change the wording of its PPG to remove
the flaws.

Keywords
development viability assessment, UK government, planning practice guidance, threshold land
value

Contacts
f.n.crosby@rdg.ac.uk

© Crosby, February 2018                                                                                 1
Real Estate and Planning

Introduction
Development Viability has become a core theme within parts of the UK planning system in an
attempt to bring sites forward for development. The National Planning Policy Framework,
published in 2012, has stated that planning authorities should pay ‘careful attention to viability’.
It states that:

             ‘[T]o ensure viability, the costs of any requirements….such as requirements for
             affordable housing, standards, infrastructure provision and other requirements
             should… provide competitive returns to a willing landowner and a willing developer to
             enable development to be deliverable’

             (CLG, 2012: 41)

The vehicle by which viability is assessed is the standard development appraisal model as
practiced by developers and their agents for many, many years. That standard model is a residual
model based on the fairly obvious concept that the land value is a residual of the value of the
completed development less the costs of developing that site including a return to the developer
for taking development risk. One of the costs of the development is meeting the Local Planning
Authority requirements for planning obligations but as the policy statement above implies, where
the extent of planning obligations reduces the returns to landowner and developer below that
which is competitive, the obligations need to be reduced to ensure viability.

What is a competitive return to the developer? Development is perceived to be a very risky game.
Risk is often defined by the volatility of returns and finance theory would suggest that a certain
cash flow through a project in terms of lack of default and a known amount should produce a
nominal risk free return. As at July 2017 that nominal risk free return is around 1% (before its real
value is eroded by any inflation over the project period). But developer returns are often quoted
at internal rates of return of around 20% (as in a recent case in Battersea), an implied premium for
taking risk of 19%. The reason for this very high risk premium is that any individual development
profit can be wiped out or made negative by relatively small movements in market conditions,
development costs or time to develop. But are developers in the current system shouldering all of
this risk?

What is a competitive return to the landowner? It is defined as the price necessary to bring that
land forward for development. Is that price based on existing use value plus a small margin? Is it
based on the price that other similar sites have transacted for in the land market?

2                                                                                       © Crosby, February 2018
Henley Discussion Paper Series
This benchmark land value has become a major battleground within planning appeals over the
last few years. This paper will briefly review the literature around this battleground paying
particular attention to the valuation model and planning policy and guidance in this area. It will
identify the major issues around the assessment of benchmark land value and recommend
changes to policy, guidance and appraisal technique to enable a more rational distribution of
development value between landowners, developers and the community.
Literature review
The literature surrounding the viability has a number of threads and a wide ranging review is
provided by McAllister (2017). He identifies a range of issues and literature including policy
innovation and calculative practice issues allied to their application to development viability.
Verdung and van de Doelen (1998) identify circulars and policy guidance as instruments of
communicating policy requirements and in the case of development viability there is detailed
planning policy and planning practice guidance from the DCLG. Pawson et al (2005) suggest that
policy innovation leads to the creation of both winners and losers from the system. This paper
examines whether the communication of policy in the form of the Planning Practice Guidance
issued by Government (DCLG) has created such a situation whereby any stakeholders in the
process have been dealt the winning hand and by implication others dealt the losing hand.
There is an extensive literature on the modelling process reviewed by McAllister (2017).
Development viability assessment has to apportion development gains between the three parties
and Jakeman, et al (2006) identifies the issue of asymmetric abilities in modelling.
‘The uses of models by managers and interest groups, as well as modellers, bring
dangers. It is easy for a poorly informed non-modeller to remain unaware of limitations,
uncertainties, omissions and subjective choices in models.’
(Jakeman, et al, 2006).
McAllister, et al (2016) found that local politicians and planners had a weak understanding of
development appraisal1 and they also found that landowners and developers have major
incentives to manipulate the viability system. It is the landowners and developers who
1
There is an education issue here not developed in this paper. The development appraisal literature lies
completely outside of the mainstream planning literature while the policy framework is firmly embedded
in the planning process. Viability could be characterised as bringing the two cultures of real estate and
planning truly together for the first time and as both disciplines have tended to be educated mostly apart
from each other in the past (there are exceptions and the Universities of Reading and Sheffield are two of
them), this coming together has been quite contentious.
© Crosby, February 2018 3Real Estate and Planning
commission viability assessments at the site-specific level. Viability studies are also cloaked in
confidentiality and many are not released in full into the public domain. However, there is an
increasing pressure to reduce the opaqueness of viability appraisals via publication. Crosby and
Wyatt (2015) call for the disclosure of all viability assessments that aim to reduce the policy level
of public contributions.
‘Publically available information on these cases varies widely and needs to be made
more transparent and consistent. In some cases there is only the basic planning
information and the Inspector’s report; in others, details of the appraisals and viability
assessments are available for scrutiny. If landowners and developers wish to challenge
area-wide and site specific community contributions, they need put their reasoning and
evidence, including financial details, into the public domain.’
(Crosby and Wyatt, 2015, p26).
But until full disclosure is obtained and these governance issues decided, the conditions are in
place within the process for some stakeholders to act under the cloak of confidentiality within the
system to maximise their returns and emerge as winners. The lack of transparency and asymmetric
abilities and resources would lead to the hypothesis that the landowners and developers are in a
better position to maximise their outcome than the LPAs.
McAllister (2017), in discussing the modelling process, identifies issues of model structure
uncertainty and input uncertainty. He sets out a categorisation of these elements reproduced
below. These appraisal issues are discussed in detail elsewhere (Bryne, et al (2011), Crosby, et al
(2013), Coleman, et al (2013), Crosby and Wyatt (2015, 2016), Sayce, et al (2017)) and a
consistent conclusion is that there is one major issue to be addressed. That is the determination
of the Benchmark or Threshold Land Value (TLV) within the viability assessment model.
That application is governed by Planning Practice Guidance supported by other industry guidance
such as the RICS Financial Viability in Planning Guidance Note (RICS, 2012). The hypothesis
addressed by this paper is that PPG is flawed and has introduced two conflicting criteria that have
combined to enable landowners and developers to profit at the expense of the community in the
form of the LPA.
Allied to this is the application of a model that has an extensive range of possible outputs based
on an entirely reasonable range of inputs within the context of normal valuation variation; for
which an extensive valuation literature exists (See for example, Wyatt 2013, 349-53). But there is
also another model based question and that is whether the right model is being applied to these
inputs. The model proposed in both PPG and in professional guidance is a residual valuation model
4 © Crosby, February 2018Henley Discussion Paper Series
incorporating current values and this is the second research question for this paper; does the use
of a no-growth assumption within viability, coupled with the policy requirements and professional
guidance, lead to further distortion of the viability assessment producing further winners and
losers.
In order to address these questions the paper constructs a hypothetical case study of a viability
assessment to illustrate the application and potential outputs of these models and whether the
policy statements create a distorted picture of reality to the detriment of the community in the
form of the delivery of planning obligations.
The next section of the paper sets out the residual model to be tested.
Residual models
The model
Coleman, et al (2012) set out the theoretical underpinning of the development appraisal model
and identify it as a residual model where the land value is a product of the value of the completed
development less the cost of providing this development including a return to the developer. The
theoretical model is simple but the application can be very varied and they identify a number of
major issues with some of the inputs such as the level of profit, the use of current or forecasted
values and costs and the treatment of finance. There are a number of technical arguments that
suggest that the model is applied very simplistically across development appraisal as a whole and
in viability assessments in particular.
There are two major variations on the residual valuation theme. The basic residual approach is set
out below and normally uses current values and costs.
The basic residual valuation model is a simplified representation of the reality of the financial
inflows and outflows from a development. The basic residual approach can be expressed more
formally as:
Land Value = Value of Completed Development (net) – (Development Costs Incl. Developers
Profit); or,
1
Where:
LV0 = residual land value at time t = 0
© Crosby, February 2018 5Real Estate and Planning
i = cost of finance (annual interest rate)
t = development period
DV0= current estimate of development value
p = profit as a percentage of DV
DC0 = current estimate of development costs
I = total finance costs
However, the basic model can be transformed into a discounted cash flow approach where the
timing of the inflows and outflows can be more carefully considered.
The basic approach of a discounted cash flow is that the net present value (NPV) of the
development scheme is estimated where:
1
R DV
LV0 R0
n (1 d ) (1 d ) n
Where:
R = recurring periodic net revenue received or expenditure incurred at the end of each period
LV0 = residual land value at time t = 0
DV= estimate of development value
n = number of periods over development period
d = target rate of return
Part of the development costs in both applications are the planning obligations. Also, the residual
does not have to be land value and in viability testing it often isn’t.
Although theoretically any of the inputs into a residual, regardless of whether it is the simplistic
basic approach or the cash flow, can be the product of the valuation, usually it is either profit or
land value. It is only once the land price is fixed that the residual product becomes profit assuming
the other inputs are also fixed. However, the POs could become the residual amount if GDV, land
price and developer’s profit are fixed.
6 © Crosby, February 2018Henley Discussion Paper Series
The inputs
(a) Gross development value
Gross development value is normally constructed from a simple comparative model of
transaction evidence from the current market. Within residential this can range from a
comparison with the sale prices of owner occupied housing to a more sophisticated but
ultimately comparative process for rented accommodation using a rent/capital value multiplier
based on initial returns to similar types of property (See, for example, Wyatt, 2013). It is not the
objective of this paper to delve more deeply into the construction of these valuations but they are
based on current sales values within the DVA process even if in a real development appraisal some
forecasting would take place. This point is important for this paper and it is unrealistic to assume
that developers take no notice of possible price changes through a development period when
framing their bid for the land at the commencement of the development period.
(b) Construction costs
Construction costs are often based on comparative information and at first sight it might appear
that costs based on comparative indicators of the current costs of construction contracts also
exclude any forecasts of how those costs may change in over the life of the project. However,
construction costs could be based on current tender prices and constructors making bids for a
project may well include any prospective cost increases in their bid. So what may appear as a
current cost may in fact already have built in some element of future expectations of costs
changes.
Change in costs may not and probably will not be at the same rate as the changes in values.
However, where they are the impact on any model that assumes that price growth is higher than
cost growth, will increase the residual outcome. A model that assumes price growth and that costs
are already grown will increase the residual still further. Appendix A sets out a typical text book
residual valuation and Table 1 illustrates the sensitivity of the residual value caused by
incorporating growth into the model. The results represent the impact of an increase of 5% per
step in each of the two main inputs of rental value and basic construction costs per square metre.
If both increase at the same rate the residual value rises by about the same %2 but if the values rise
and the costs are already based on actual expected costs, above the residual land value can be
seen to increase significantly and almost double if values rise by 20% from £715,000 to £1.3
million.
2
In this case some of the inputs have been fixed so not all costs related to construction have been increased.
© Crosby, February 2018 7Real Estate and Planning
Table 1: Hypothetical residual land values with different levels of growth in values and
construction costs.
Rental Value
Construction £200 £210 £220 £230 £240
Costs
£969.0 £ 715,446 £ 863,016 £ 1,010,586 £ 1,158,156 £ 1,305,726
£1018.5 £ 617,564 £ 765,134 £ 912,704 £ 1,060,274 £ 1,207,844
£1067.0 £ 521,659 £ 669,229 £ 816,799 £ 964,369 £ 1,111,939
£1115.5 £ 425,755 £ 573,325 £ 720,894 £ 868,464 £ 1,016,034
£1164.0 £ 329,850 £ 477,420 £ 624,990 £ 772,560 £ 920,129
(c) Return to the developer
The third major component of the residual model is the developer’s profit.
Within the development process, it has been normally assumed that the developer holds the
development risk and therefore requires a major risk premium in the form of a significant profit
for holding that risk. Risk is uncertainty and the impact of any uncertainty on financial returns. The
major risks in development are that the market moves against the developer and as developers
profits are driven by extremely large values and costs, a small variation in expected outcomes has
a dramatic effect on the profits. A 20% fall in development value would wipe out a 20% of GDV
profit. But as has been seen in the previous section, a 20% rise in the development value can double
the residual land value. If the residual is the development profit once the land has been purchased,
these increases revert to the development profit. This volatility of profit justifies the very high
target rates.
There is very little literature or data on development returns. IPD data between 1984 and 2014
suggests that the median return to developments within the portfolios of the major property
investors was 6.5%, 4% pa lower than returns to the investment portfolios. But there are major
questions over that data. Crosby, Devaney and Wyatt (2017) have recently reviewed that
literature and much of it relates to either anecdotal comment or inputs into published viability
studies. There is little debate as to what those returns should be in that literature.
A major question that emerges is whether, regardless of what absolute level of profit within this
model represents a ‘competitive return to the developer’, the returns to the developer should be
modified if the planning policy and practice guidance helps developers resist falls in profit. This
could be due to markets not performing as expected when they made their land purchase, i.e.
8 © Crosby, February 2018Henley Discussion Paper Series
reduces the risk of the development. Is it the developer who holds the residual element and
therefore suffers (or gains) from these ‘unexpected’ events? This paper argues that planning
guidance has enabled the developer to pass on any reduction in profit to the LPA.
Planning policy and practice guidance
It is into this mix of questions concerning development appraisal methods that planning policy
and practice guidance has been introduced. Planning policy practice has a number of specific
instructions for those undertaking viability assessments.
First the question of future change in costs and values. PPG Viability (CLG, 2014) section Paragraph
8 refers to area wide plan making and viability assessments for that purpose should not include
any future increase in costs of values.
‘Current costs and values should be considered when assessing the viability of plan
policy. Policies should be deliverable and should not be based on an expectation of
future rises in values at least for the first 5 years of the plan period.’
When it comes to site specific guidance the guidance is contained within paragraph 17 and is
unambiguous. The only context in which value and cost change can be included is when schemes
are large enough to be phased.
‘Viability assessment in decision-taking should be based on current costs and values.
Planning applications should be considered in today’s circumstances.
However, where a scheme requires phased delivery over the medium and longer term,
changes in the value of development and changes in costs of delivery may be
considered. Forecasts, based on relevant market data, should be agreed between the
applicant and local planning authority wherever possible.’
Second the question of assessing threshold land value. The guidance on the assessment of land
value within a viability assessment is driven by a set of instructions which are similar for both area
wide and for site-specific assessments. Area wide instructions are contained in paragraph 14 and
site-specific in paragraph 23. Paragraph 14 is as follows:
‘Central to the consideration of viability is the assessment of land or site value. The most
appropriate way to assess land or site value will vary but there are common principles
which should be reflected.
In all cases, estimated land or site value should:
© Crosby, February 2018 9Real Estate and Planning
reflect emerging policy requirements and planning obligations and, where
applicable, any Community Infrastructure Levy charge;
provide a competitive return to willing developers and land owners (including
equity resulting from those building their own homes); and
be informed by comparable, market-based evidence wherever possible. Where
transacted bids are significantly above the market norm, they should not be
used as part of this exercise.’
Paragraph 23 is identical except that for one sentence added to the opening statement of the
paragraph and a slight tweak to the next sentence. In addition, the word emerging has been
omitted from the first bullet point
‘Central to the consideration of viability is the assessment of land or site value. Land or
site value will be an important input into the assessment. The most appropriate way
to assess land or site value will vary from case to case but there are common principles
which should be reflected.’
In all cases, land or site value should:
reflect policy requirements and planning obligations and, where applicable,
any Community Infrastructure Levy charge;
provide a competitive return to willing developers and land owners (including
equity resulting from those wanting to build their own homes); and
be informed by comparable, market-based evidence wherever possible. Where
transacted bids are significantly above the market norm, they should not be
used as part of this exercise.
This paper concentrates on site specific viability assessments and questions the impact of these
guidelines
Development viability assessment hypothetical case study
A simplified example of the residual valuation is used to assess the two specific research questions.
The important components of the residual model are the Gross Development Value, the costs of
development including construction, finance and fees, a profit to the developer, any section 106
and other payments to the community and the land price.
10 © Crosby, February 2018Henley Discussion Paper Series
The example:
Gross Development Value £1,000,000 net of any agency costs
Costs of Development £500,000 including fees and finance costs3
Policy compliant planning obligations £90,000 including CIL, AH, Section 106
Development profit 20% of GDV £200,000
Existing use value (EUV) of the Land £100,000
Scenario 1 – It is what is envisaged by a basic residual approach applied as per the PPG
guidelines. A residual land value for development would be calculated at £210,000.
GDV £1,000,000
Costs £500,000
Profit £200,000
Planning Obligations £90,000
Residual site value £210,000
This is a 100%+ uplift on EUV and the landowner would be incentivised to release the land for
development. The developer gets 20% on GDV and is therefore given their normal return. The POs
are delivered in full. This is therefore a policy compliant land value which satisfies the first bullet
point and is also policy compliant market value as envisaged by the RICS Guidance Note (RICS,
2012).
Scenario 2 – It assumes that a number of comparable residential development sites are selling for
£300,000 not £210,000. The developer has two choices. First they can refuse to pay the price but
it looks like others are prepared to pay that price. The alternative is to convince the landowner
3
There is a strong argument that finance has no part to play in development appraisal and these arguments
are set out in, for example, Coleman, et al (2013).
© Crosby, February 2018 11Real Estate and Planning
that these levels of price are too high and they should accept the £210,000 but you can imagine
the y advice from the landowner’s agent. Landowner stills sells to the other developers for
£300,000. The last alternative is that the developer overpays for the site at £300,000 to remain
competitive.
But is it an overpayment? The market value is obviously £300,000 and therefore there may be a
model issue here. If, for example, residential values are expected to rise by approximately 20% over
the development period and the costs are based on a fixed price tender contract over the
development period, the residual valuation would throw up a higher residual value. The increase
is deferred over the development period and finance rates may be higher but the basic model still
allows for a sale at say an equivalent £1.15 million (15% increase in current deferred value) and
costs at perhaps £550,000. After the full POs have been paid for developer’s profit increases to
£230,000.
The real scenario 2 appraisal
GDV £1,150,000
Costs £530,000
Planning Obligations £90,000
Residual site value £300,000
Profit £230,000
Does PPG now allow an even more spectacular gain to occur? Bullet point three is crucial. It
suggests that land price in the viability assessment should ‘be informed by comparable, market-
based evidence wherever possible. Where transacted bids are significantly above the market
norm, they should not be used as part of this exercise.’
This is there to stop the actual land price for a particular site being used if it is out of line with
market prices. But it implies the inverse; that the actual land price should be used if it can be
proved by other similar prices paid. If a developer can show that the market price is around
£300,000 then that can be used as proof of policy compliant land value and that price or value can
be sued as the benchmark or Threshold Land Value in the viability assessment.
12 © Crosby, February 2018Henley Discussion Paper Series
To the uninitiated it would appear that the developer has paid too much for the site and this will
eat into the profit. They have sacrificed profit to pay the landowner who receives more than their
fair share. This is shown below to reduce to £110,000 or only 11% of GDV.
Scenario 2 – The PPG scenario (policy compliant MV)
GDV £1,000,000
Costs £500,000
Planning Obligations £90,000
Site price £300,000
Profit £110,000
This is a lower than the ‘normal’ return. But if the £300,000 is not an overpayment and is a function
of the real expectations of the development, the actual returns are £230,000 or 23% of existing
GDV.
But planning guidance is now oblivious to the real situation and has created rules that identify the
above as the situation and believes that the developer, far from making higher returns is actually
making an uncompetitive return. Planning policy allows the developer to enter negotiations with
the LPA. Those discussions are based on the above current values and the need to ensure the
developer gets a fair return for their risk. If we assume this is 20% of GDV then the discussions can
proceed as follows.
Scenario 3 – The developer puts in a viability appraisal to show that they cannot afford the POs of
£90,000. The reason is that the land value is £300,000 and they first prove that by using the
comparables in accordance with PPG Para 23 bullet point 3. Para 17 then requires a current values
and costs assessment so the developer’s appraisal is basically:
© Crosby, February 2018 13Real Estate and Planning
GDV £1,000,000
Costs £500,000
Profit £200,000
Residual site value £300,000
This leaves the project only just viable without the POs so they convince the Planning Inspectors
and/or LPAs that, in accordance with PPG, in order to ensure an appropriate return to the
developer and the landowner, they regretfully won’t be able to provide any Section
106/Affordable Housing.
If they have not overpaid, the real appraisal is now:
Scenario 3 – the real situation
GDV £1,150,000
Costs £530,000
Planning Obligations £0
Residual site value £300,000
Leaving developer’s profit at £320,000 or 32% of the original GDV.
Discussion and conclusion
If this part of the development process is seen to be a game it would be likened to ‘pass the parcel’.
The parcel is the residual value which is left after all other development costs have been paid for
out of the development proceeds. Developers usually hold this residual and therein lies the risk of
development for which they get richly rewarded by a massive risk premium above the risk free
rate.
The case study has shown that the residual amount within any appraisal is originally in the hands
of the landowner. This passes to the developer when they fix the price of the land and pay it over
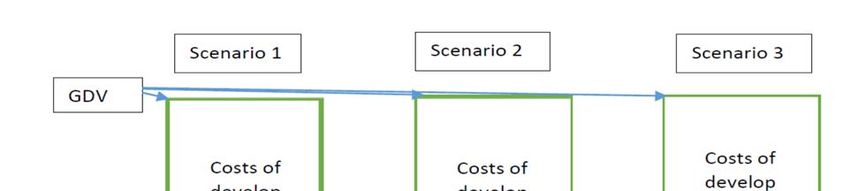
14 © Crosby, February 2018Henley Discussion Paper Series to the landowner. The viability process has now allowed that residual and therefore a significant element of the development risk to be passed onto the LPA. The 3 scenarios are represented below in Figure 1. Figure 1: Residual Valuation Scenarios The case study is hypothetical. However, there is evidence that land is being sold above the prices suggested by the viability appraisals with policy compliant planning obligations, that developers require their returns to be protected and that the model being used in viability assessments is the basic residual model. The evidence for prices above valuations is not systematic but there are instances of sites, having have gone through viability appraisals and had policy levels of affordable housing reduced, being sold with the planning permission for significantly above the benchmark land value in the viability assessment. For example, Crystal Palace Rd in East Dulwich. In July 2015 the existing use value of the property was argued to be £1.4m and the development land value only £383,000 by the appellant in a Planning Appeal. The inspector accepted the valuations and agreed that the site was not viable, and removed the affordable housing. But in February 2016 the Land Registry recorded a price of £5.1 Million for the sale of the site. Why would anybody bother to get planning permission if the development value is just over 20% of existing use value? The answer is the development value is not £383,000. It was £5 million. © Crosby, February 2018 15
Real Estate and Planning

There is also anecdotal evidence that developers are arguing that their returns should be
protected. The most recent case is a very large site in Battersea where the LPA has agreed to reduce
the affordable housing content based on the developer’s arguments that the project has fallen in
value relative to costs and they need that reduction in AH contributions to maintain their IRR of
20%.

Despite the criticisms of the basic residual in Coleman, et al (2012), viability appraisals, tend to
use the basic residual. Crosby and Wyatt (2016) investigated a number of planning appeals and
found that it was used in all but a few larger cases.

So the conditions set by the hypothetical case study are therefore typical. This situation has been
judged to lead to a situation whereby the outcome of the model is also an input into the model
and that has shifted the residual away from the landowner and onto the LPA with the developer
acting in the middle passing the residual through. This situation has been identified within much
of the literature and within some LPA supplementary planning guidance, including the Mayor of
London’s draft Supplementary Planning Guidance. It is the fundamental flaw within the PPG that
has introduced this circularity into the viability process. It is set out in both Sayce et al (2017) and
Crosby and Wyatt (2016). The land price is an outcome of the residual model. If the land price is
taken outside the model by the use of comparable transactions, and the developer’s return is held
constant, the residual of the model becomes the planning obligations. At this point, the developer
knows that they can pay more for land and increase the landowner’s return. Instead of taking this
hit within their profits they can use the PPG to argue for that reduction to be passed onto the LPA
and this approach has been upheld by the planning Inspectors in their appeals.

Crosby and Wyatt (2016) conclude:

             ‘In a policy context that requires planning obligations to be set at a level that does not
            jeopardise developers’ and landowners’ competitive returns, a developer can outbid
            others to acquire a site knowing that the price paid (or market valuations that use this
            price as evidence) can be used as evidence to reduce the level of planning obligations.’

            (Crosby and Wyatt 2016, 1731)

These discussions in previous papers have been predicated on the developers ‘overpaying’ for the
land and then clawing this overpayment back by passing it onto the LPA in reduced or even zero
planning obligations. This argument relies on developers all overpaying and creating the evidence
base to stop the actual price being unsupported by other transactions. This paper has suggested
that there may be another force at work based on inappropriate choice of model (or more
accurately inappropriate application of inputs into the model). Not using value and cost change

16                                                                                          © Crosby, February 2018
Henley Discussion Paper Series
in the modelling can lead to undervaluation in markets that are expected to grow over the
development period. There are provisos to this conclusion as it depends on the relative growth
rates in values and costs and the relationship between values and costs (high land value areas will
benefit from this effect more than low land value areas for example.
There is evidence that the Planning Inspectorate have at last begun to realise the problem and the
decision in the recent Planning Appeal concerning Parkhurst Road in London
(APP/V5570/W/16/3151698) is a step forward. The inspector accepted that the land value had to
be policy compliant and comparable land sales needed to be assessed for policy compliance. Para
39 of the decision explicitly discusses the tension between the two bullet points in PPG para 23
where comparables should be used but the land price should be policy compliant.
Both problems discussed in this paper, the use of comparables and the use of current values and
costs, have a similar source, the PPG. PPG is fundamentally flawed. Paragraphs 8, 14, 17, and 23 of
the Viability section of PPG appear to be a major cause of the reduction in affordable housing4 and
need redrafting as soon as possible to:
1) place the emphasis away from the comparables and onto the policy compliance and
2) allow the model to be applied as it is in the market place with due regard to expected
events over the development period.
4
Sayce, et al (2017) indicate that in London AH supply has fallen from nearly 40% in 2011/12 to 25% in
2014/15 and in 2014/15 the permissions granted averaged only 13% AH.
© Crosby, February 2018 17Real Estate and Planning
References
Byrne, P., McAllister, P. and Wyatt, P. (2011) Precisely wrong or roughly right? An evaluation of
development viability appraisal modelling. Journal of Financial Management of Property and
Construction, Volume 16 (3), pages 249-271.
CLG (2012) National Planning Policy Framework. DCLG: London.
https://www.gov.uk/guidance/national-planning-policy-framework
CLG (2014) Planning Practice Guidance – Viability. DCLG: London.
https://www.gov.uk/guidance/viability
Coleman, C. Crosby, N. McAllister, P. and Wyatt, P. (2013) Development appraisal in practice: some
evidence from the planning system. Journal of Property Research, Volume 30 (2), pages 144-
165.
Crosby, N. McAllister, P. and Wyatt, P. (2013) Fit for planning? An evaluation of the application of
development viability appraisal models in the UK planning system. Environment and Planning
B: Planning and Design 2013, volume 40, pages 3-22
Crosby, N. and Wyatt, P. (2015) Financial Viability Appraisal in Planning Decisions: Theory and
Practice. RICS Research Trust: London.
Crosby, N. and Wyatt, P. (2016) Financial viability appraisals for site-specific planning decisions in
England. Environment and Planning C: Government and Policy, Volume 34 (8), Pages 1716–1733.
Crosby, N. Devaney, S. and Wyatt, P. (2017) The implied internal rate of return in conventional
residual valuations of development sites. Working Papers in Real Estate & Planning, 03/17,
University of Reading, Reading, pages 14. http://www.henley.ac.uk/school/page/rep-working-
papers-2014/
Jakeman, A.J., Letcher, R.A., Norton, J.P. (2006). Ten iterative steps in development and evaluation
of environmental models. Environmental Modelling and Software. Volume 21, pages 602–614.
McAllister, P. (2017). The calculative turn in land value capture: lessons from the English planning
system. Land Use Policy, Volume 63, pages 122-129.
McAllister, P., Street, E. and Wyatt, P. (2016) An empirical investigation of stalled residential sites
in England. Planning Practice and Research, Volume 31 (2), pages 132-153.
Pawson, R. Greenhalgh, T. Harvey, G. and Walshe, K. (2005) Realist review – a new method of
systematic review designed for complex policy interventions. Journal of Health Services
Research & Policy. Volume 10, pages 21-34.
RICS (2012). Financial Viability in Planning. RICS: London.
Sayce, S. Crosby, N. Garside, P. Harris, R and Parsa, A. (2017) Viability and the Planning System: The
Relationship between Economic Viability Testing, Land Values and Affordable Housing in London.
Research Report for the London Boroughs of Barking and Dagenham, Brent, Camden,
Croydon, Enfield, Greenwich, Islington, Lambeth, Merton, Newham, Southwark, Tower
18 © Crosby, February 2018Henley Discussion Paper Series
Hamlets and Waltham Forest. Royal Agricultural University: Cirencester.
http://www.henley.ac.uk/files/pdf/schools/rep/Viability_and_the_Planning_System_Research
_January_2017.pdf
Vedung, E., van der Doelen, F. (1998). The sermon: information programs in the public policy
process – choice, effects, and evaluation. In: Bemelmans–Videc, M. Rist, R. and Vedung, E.
(Eds.), Carrots, Sticks, and Sermons: Policy Instruments and Their Evaluation. Transaction
Publishers, New Brunswick, NJ. Pages 103–128.
Wyatt, P (2013) Property Valuation (2e). Wiley-Blackwell: Chichester.
© Crosby, February 2018 19Real Estate and Planning
Annex 1 - Conventional residual valuation to calculate site value
(Source: Wyatt, 2013)
Development value:
Gross Internal Area (GIA) (m2) 2,000
Net Internal Area (NIA) (m2) 1,700
Estimated rent / sqm (ERV) £200
£340,000
Capitalised into perpetuity @ 7.00% 14.2857
Gross development value (GDV) £4,857,143
less purchaser's / disposal costs (@ % NDV) 5.75% £264,100
Net development value (NDV) £4,593,043
Construction costs and fees:
Site Preparation £25,000
Building costs (£/m2 GIA) £969 £1,938,000
External works £120,000
Professional fees (% construction costs and external works) 13.00% £267,540
Misc costs £80,000
Contingency @ % above costs (but not site prep costs) 3.00% £72,166
£2,502,706
Regulatory costs and fees:
Planning £5,000
Building Regs £20,000
Planning obligations £0
Other fees (e.g. legal, loan, valuation, etc.) £95,238
£120,238
Total Costs and Fees: £2,622,944
Interest:
on total costs and fees for half building period @ 10.00% £160,993
on total costs & finance for void period @ 10.00% £67,131
Total Interest Payable (£'s): £228,124
20 © Crosby, February 2018Henley Discussion Paper Series
Letting & Sale Costs:
Letting agent's fee (% ERV) 10.00% £34,000
Letting Legal fee (% ERV) 5.00% £17,000
Marketing (£'s) £10,000
Sale agent's fee (% NDV) 0.00% £0
Sale legal fee 0.00% £0
Total Letting & Sales Fees (£'s): £61,000
Total Development Costs: £2,912,068
plus Developer's profit on Total Development Costs (%): 20.00% £582,414
£3,494,482
Future residual balance (Inc. profit on land) £1,098,561
less Developer's profit on Land Costs (%): 20.00% £183,093
Future balance (Inc.interest on land & acquisition costs) £915,467
less interest on land and acquisition costs for total
development period 10.00% 2.00 0.8264
Present residual balance for land and acquisition costs: £756,585
less Acquisition Costs (% land acquisition bid price) 5.75% £41,138
Residual valuation for site £715,446
Sensitivity Table of Rental Value and Construction Costs 200 210 220 230 240
969 £ 715,446 £ 863,016 £ 1,010,586 £ 1,158,156 £ 1,305,726
1018.5 £ 617,564 £ 765,13 £ 912,704 £ 1,060,274 £ 1,207,844
1067 £ 521,659 £ 669,22 £ 816,799 £ 964,369 £ 1,111,939
1115.5 £ 425,755 £ 573,32 £ 720,894 £ 868,464 £ 1,016,034
1164 £ 329,850 £ 477,42 £ 624,990 £ 772,560 £ 920,129
© Crosby, February 2018 21You can also read