Norwegian Energy Company ASA First Quarter 2021 - Noreco
←
→
Page content transcription
If your browser does not render page correctly, please read the page content below

Norwegian Energy Company ASA
    First Quarter 2021

0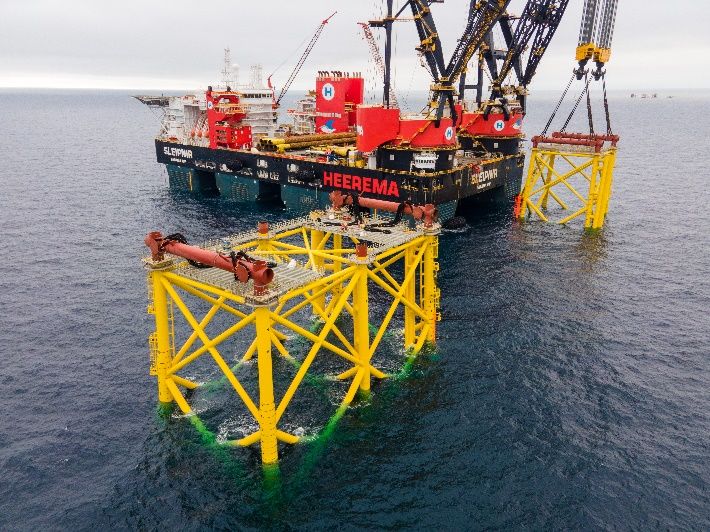
Noreco First Quarter 2021
Content

2         Highlights
3         Financial Review
7         Operational Review

10        Condensed Consolidated Statement of Comprehensive Income
11        Condensed Consolidated Statement of Financial Position
12        Condensed Consolidated Statement of Changes in Equity
13        Condensed Consolidated Statement of Cash Flows

14        Notes
15        Note 1: Accounting Principles
16        Note 2: Revenue
17        Note 3: Production Expenses
18        Note 4: Financial Income and Expenses
19        Note 5: Tax
21        Note 6: Intangible assets
22        Note 7: Acquisition of subsidiary – Final purchase price allocation
25        Note 8: Property, Plant and Equipment
25        Note 9: Non-Current Receivables, Trade Receivables and Other Current Assets
26        Note 10: Inventories
26        Note 11: Restricted Cash, Bank Deposits, Cash and Cash Equivalents
27        Note 12: Borrowings
28        Note 13: Trade Payables and Other Current Liabilities
29        Note 14: Financial Instruments
34        Note 15: Asset Retirement Obligations
34        Note 16: Subsequent Events

35        Alternative Performance Measures

37        Information About Noreco

                                                                                                        1
Noreco First Quarter 2021
Report for the First Quarter 2021
Norwegian Energy Company ASA
Highlights
First Quarter 2021 summary
Operational: Financial:
• Net hydrocarbon production of 25.8 mboepd in the first • Announcement of RBL increase to USD 1.1 billion with
quarter, in line with 2021 guidance of 25.5 to 27.5 revised seven-year term in Q1 2021, subsequently
mboepd completed in May 2021
• Effective oil price for the period of 55.9 USD per bbl, • Available liquidity following completion of the RBL
incorporating the impact of the price hedging increase of c. USD 320 million, with cash on balance
sheet of USD 70 million and undrawn RBL capacity of c.
• Tyra project continues according to revised schedule, USD 250 million(1)
with first production expected by Q2 2023
• Noreco continues to benefit from a strong capital
structure and is fully-funded to deliver the Tyra
redevelopment project based on our available liquidity
position
(1)
Additional RBL cash drawing capacity available from 5th May 2021, when the enlarged facility became effective
Q1 2020
Financial and operational summary Unit Q1 2021 2020
restated2)
Total revenue USDm 105 124 566
EBITDA 1)
USDm 29 57 250
Adj. EBITDA1) USDm 31 81 358
Result before tax USDm (28) (9) (18)
Net result for the period USDm (9) (24) 17
Net cash flow from operating activities USDm (122) 62 348
Investments in oil and gas assets USDm 56 66 236
Abandonment spent 1)
USDm 2 19 74
Reserve based lending facility - currently drawn USDm 751 746 751
Net interest-bearing debt1) USDm 1,059 837 863
Oil production mboepd 19.2 23.8 25.5
Gas production mboepd 6.6 8.0 10.2
Total production mboepd 25.8 31.8 35.7
Over/underlift mboepd (1.5) (3.1) 0.5
Realised Oil price USD/boe 60.4 47.4 40.0
+/- Effect of hedges USD/boe (4.5) 11.6 26.8
Effective Oil price USD/boe 55.9 59.0 66.8
1) See the description of “Alternative performance measures” at the end of this report for definitions.
2) The restatement is a result of the revised purchase price allocation in relation to the acquisition of SOGU within the measurement
period in IFRS, please see note 1 and note 9 for further explanations.
2Noreco First Quarter 2021
Report for the First Quarter 2021
Norwegian Energy Company ASA
Financial review
Selected data from consolidated statement of comprehensive income
Q1 2020
All figures in USD million Q1 2021 2020
restated
Total revenue 105 124 566
EBITDA 29 57 250
EBIT 4 (2) 57
Result before tax (28) (9) (18)
Net result for the period (9) (24) 17
Earnings per share (0.4) (1.0) 0.7
The Company had revenues of USD 105 million in the first Other operating expenses were USD 2 million for the first
quarter of 2021 mainly related to oil and gas sales from the quarter of 2021 compared to USD 2 million in the first
DUC fields; this compares to USD 124 million in the first quarter of 2020.
quarter of 2020 and USD 146 million in the fourth quarter
2020. The decrease compared to first quarter last year were Operating result (EBITDA) in the first quarter of 2021 was a
related to lower volumes of oil lifted and lower realised profit of USD 29 million, mainly from the DUC fields
prices. compared to USD 57 million in first quarter of 2020.
Production expenses amounted to USD 71 million in the first Net Financial items amounted to an expense of USD 32
quarter of 2021 compared to USD 62 million in the first million for the first quarter of 2021, compared to an expense
quarter of 2020 and USD 99 million in the fourth quarter of USD 6 million in the first quarter of 2020. The financial
2020. USD 6 million in increase compared to first quarter items were lower in first quarter 2020 due to the positive fair
last year were related to DKK/EUR to USD exchange rate value adjustments on the hedging contacts and the
being lower in first quarter of 2021 compared to first quarter embedded derivatives, partly offset by the negative fair
of 2020, the increase is partly offset by lower activity due to value adjustment on the volume protection agreement.
the delayed rig arrival caused by COVID-19 restrictions. In
addition, changes related to crude oil inventory and overlift Income tax amounted to positive USD 20 million for the first
position. quarter of 2021 compared to negative USD 15 million for the
first quarter of 2020. For the current quarter this relates to
Personnel expenses in first quarter of 2021 were USD 3 the recognition of tax losses for the period and investment
million compared to USD 2 million in the first quarter of uplift.
2020. The increase reflects staff changes and increased
cost related to new options that were announced in Q2 Net result for the first quarter of 2021 is a loss of USD 9 million,
2020. compared to USD 24 million for the first quarter of 2020.
3Noreco First Quarter 2021
Report for the First Quarter 2021
Norwegian Energy Company ASA
Selected data from the consolidated statement of financial position
All figures in USD million YTD 2021 2020
Total non-current assets 2,640 2,533
Total current assets 161 429
Total assets 2,801 2,962
Total equity 581 630
Interest bearing debt 1,055 1,043
Asset retirement obligations 954 950
Total non-current assets amounted to USD 2.6 billion at the NOR13 had a book value of USD 137 million at the end of the
end of first quarter of 2021, of which USD 1.7 billion related first quarter of 2021. This is valued at amortised cost and the
to property, plant and equipment, in addition to intangible embedded derivatives are accounted for as a derivative
assets of USD 172 million, deferred tax asset of USD 523 liability at fair value through profit and loss. Noreco’s USD
million and USD 208 million in restricted cash, this relates to 900 million RBL facility was drawn USD 751 million and had a
cash pledged as security for cash call obligations to Total, book value of USD 720 million at the end of the first quarter.
abandonment for Nini/Cecilie and withheld taxes. The senior unsecured bond loan NOR14 had a book value of
USD 173 million at the end of the period. The RBL facility and
Total current assets amounted to USD 161 million at the end the unsecured bond loan are valued at amortized cost. In
of first quarter of 2021, USD 40 million in trade- and other addition, the interest-bearing debt includes deferred
receivables, mainly related to oil and gas revenue, USD 18 consideration with a book value of USD 25 million at the end
million in prepayments mainly related to the offshore of the first quarter.
insurance premium that has been paid in advance, USD 70
million of cash and USD 34 million related to inventory. Asset retirement obligations amounted to USD 954 million
at the end of first quarter of 2021, compared to USD 950
Total equity amounted to USD 581 million at the end of the million at the end of 2020. USD 882 million is related to the
first quarter of 2021, compared to USD 630 million at the DUC assets, USD 68 million to Nini/Cecilie, USD 2 million to
end of 2020. The decrease in equity is related to the fair Lulita and USD 2.4 million to the Tyra F-3 pipeline. Part of the
value adjustment of derivative instruments and a loss for the asset retirement obligation is secured through an escrow
period. account of USD 68 million.
Interest-bearing debt amounted to USD 1,055 million at the
end of first quarter of 2021. The convertible bond loan
4Noreco First Quarter 2021
Report for the First Quarter 2021
Norwegian Energy Company ASA
Selected data from the consolidated statement of cash flows
Q1 2020
All figures in USD million Q1 2021 2020
restated
Cash flow from operating activities (122) 62 348
Cash flow used in investing activities (58) (53) (359)
Cash flow from financing activities (9) (22) (16)
Net change in cash and cash equivalents (189) (13) (26)
Cash and cash equivalents 70 273 259
Cash flow from operating activities amounted to negative expenditure were paid which were mainly related to Tyra
USD 122 million at the end of first quarter of 2021, compared Redevelopment.
to USD 62 million for the same period in 2020. Cash flow
from operating activities excluding changes in working Cash flow from financing activities amounted to negative
capital amounted to USD 30 million at the end of first USD 9 million at the end of the first quarter of 2021,
quarter of 2021, compared to USD 57 million for the same compared to negative USD 22 million for the same period in
period in 2020. In Q1 2021 the VAT liability related to 2020 of 2020. The cash flow used in financing activities were mainly
USD 156 million was paid, the payment date was delayed to related to USD 11 million in paid interest on the RBL Facility
Q1 2021 by the Danish government as a response to the and bond loan.
impact of COVID-19 on the economy.
Net change in cash and cash equivalents amounted to
Cash flow used in investing activities amounted to negative USD 189 million in the quarter compared to positive
negative USD 58 million at the end of the quarter, compared USD 13 million in first quarter of 2020. Cash and cash
to negative USD 53 million for the same period in 2020. The equivalents were in total USD 70 million at the end of first
cash flow used in investing activities were related to quarter 2021.
investments on the DUC asset of USD 56 million, of which
USD 51 million is linked to the Tyra Redevelopment, USD 15
million deposit into a cash call security account, benefit
received from the volume guarantee of USD 15 million and
USD 2 million in abandonment
5Noreco First Quarter 2021
Report for the First Quarter 2021
Norwegian Energy Company ASA
Risk Mitigation
The Company actively seeks to reduce exposure to the risk with financial institutions in the market to reduce the
of fluctuating commodity prices through the establishment Company’s exposure to commodity price volatility. These
of hedging arrangements. To achieve this, Noreco has protect the minimum oil price Noreco will receive during
executed a hedging policy in the market and entered into a 2021 to 2023 and are financially settled monthly.
combination of forward contracts and options.
In addition and complementary to the Company’s hedging
As a result of the agreement to acquire SOGU, Noreco had a policy, Noreco has a rolling hedge requirement as part of
liquid volume protection agreement with Shell that, from the RBL Facility that is based on the RBL banking case
signing of the Sale and Purchase Agreement (SPA) until the production forecast. This requires that price hedging be in
end of 2020 (the “Protection Period”), provided a monthly place (at no less than 90% of the corresponding RBL banking
liquid production guarantee at levels above the Company’s case price forecast) for a minimum of 50% of oil equivalent
internal forecasts. For the period 2021 to 2023 (the volumes for the following 12 months, 40% in the period from
“Recovery Period”), a payment to Shell may be required if 12 to 24 months and 30% in the period from 24 to 36
actual production exceeds a pre-agreed level. The months, subject to a maximum level in each of these periods
production level at which any recovery payment would be of 70%. Due to the volatile oil market conditions in 2020,
made to Shell is currently above the Company’s internal Noreco received waivers from its RBL bank syndicate in
forecasts, and therefore the Company does not expect any June and December 2020 relating to the hedging
payments to be required during the remaining term of this requirements in the 24 to 36 month forward period; based
agreement. In any event, the amount refunded to Shell on this, the company is not required to meet the minimum
during the Recovery Period cannot exceed the value of hedging level for this period until the end of June 2021. At
Noreco’s claims during the Protection Period. the end of Q1 2021, Noreco is in full compliance with these
temporarily revised RBL hedging requirements.
As required by Noreco’s hedging policy, the Company has
entered into a combination of forward contracts and options
Volume hedged Average hedged
(mmboe)* price ($/boe)*
2021 5.1 54.2
2022 4.3 55.7
2023 3.8 51.8
*Includeds both liquids and Gas hedges
6Noreco First Quarter 2021
Report for the First Quarter 2021
Norwegian Energy Company ASA
Operational review
Production
Key figures Unit Q1 2021 Q1 2020 YTD 2021 2020
Dan hub mboepd 8.5 8.5 8.5 7.8
Gorm hub mboepd 3.2 4.8 3.2 4.8
Halfdan hub mboepd 14.0 18.5 14.0 15.9
Tyra hub* mboepd 0.0 0.0 0.0 0.0
Total production mboepd 25.8 31.8 25.8 28.5
Over/-underlift mboepd (1.5) (3.1) (1.5) (0.3)
Net sales mboepd 24.3 28.8 24.3 28.2
Oil sales mboepd 17.7 20.8 17.7 21.6
Gas sales mboepd 6.6 8.0 6.6 6.6
Operating efficiency % 77.0 % 89.0 % 77.0 % 87.0 %
Precautions for COVID-19 continued throughout the period. Performance in Q1 was partly impacted by the continuation of
3rd party NOGAT pipeline shut down, which was resolved in the beginning of January. Compressor issues at the Gorm hub
during January and February also had an impact on production performance, with operating efficiency of 77% for Q1 2021
compared to 89% for Q1 2020. Mobilisation of the Nobel Rig Sam Turner was delayed by one month due to COVID
restrictions, which impacted planned work over and well maintenance program.
Dan hub
Key figures Unit Q1 2021 Q1 2020 YTD 2021 2020
Dan mboepd 7.5 7.7 7.5 7.0
Kraka mboepd 1.0 0.8 1.0 0.8
Operating efficiency 84.0% 78.0 % 84.0% 75.0%
First quarter average production was 8.5 kboepd from the Dan hub. Operating efficiency for the quarter was 84%, compared
to 78% for the previous quarter. The uptime during the period was mainly impacted by water injection plant availability and
continued export pipeline shut down from mid-December until 4 January 2021 due to an integrity issue on F3FB
Gorm hub
Key figures Unit Q1 2021 Q1 2020 YTD 2021 2020
Gorm mboepd 1.3 2.0 1.3 2.1
Rolf mboepd 0.2 0.2 0.2 0.3
Skjold mboepd 1.7 2.6 1.7 2.4
Operating efficiency 50.0% 79.0 % 50.0% 77.0%
First quarter average production was 3.2 kboepd from the Gorm hub. The operating efficiency for the quarter was 50%
compared to 79% in Q1 2020. The low uptime in Q1 was due to an aging compression system which was under repair in
February and a short-term production stop due to a crack in the flare header which was replaced.
7Noreco First Quarter 2021
Report for the First Quarter 2021
Norwegian Energy Company ASA
Halfdan hub
Key figures Unit Q1 2021 Q1 2020 YTD 2021 2020
Halfdan mboepd 14.0 18.5 14.0 15.9
Operating efficiency 81.0% 97.0 % 81.0% 87.0%
First quarter average production was 14.0 kboepd. Operating efficiency was 81% compared to 97% during the same quarter
in 2020. The continuation of 3rd party NOGAT pipeline shut down resulted in lower production, and events during the period
which impacted operating efficiency were the replacement of the crane boom on Halfdan and the production stop on Gorm,
as final stabilization of Halfdan crude takes place on Gorm.
Tyra hub
Key figures Unit Q1 2021 Q1 2020 YTD 2021 2020
Tyra mboepd - - - -
Harald mboepd - - - -
Lulita* mboepd - - - -
Roar mboepd - - - -
Svend mboepd - - - -
Valdemar mboepd - - - -
Operating efficiency % - - - -
The Tyra Redevelopment project is, to date, the largest place on three yards: Sembcorp Marine in Singapore is
project carried out on the Danish Continental Shelf, and is currently fabricating the wellhead- and riser platforms for
expecting to increase net production by 90 percent and Tyra East and Tyra West, the accommodation module is
unlock gross reserves in excess of 200 mmboe. being fabricated by Rosetti Marine in Ravenna, Italy, and the
Redeveloped Tyra will decrease opex significantly and lower process module by McDermott in Batam, Indonesia. Both
emissions at the field by 30 percent. In addition, the project the accommodation module and the Tyra East wellhead and
will extend field life by 25 years and produce enough gas to riser platforms are expected to be delivered from the yards
power what equals to 1.5 million homes in Denmark. and sail away during 2H followed by offshore installation and
initiation of hook-up. The remaining yard fabrication left for
The execution of the project is both a global and local effort. the project will be completed in 2022, and the process
In addition to fabricating installations in both Europe and module and Tyra West wellhead and riser platforms will
Asia, project efforts are being complete offshore installation and hook-up during that
executed locally in Esbjerg and offshore in the Danish North same year. First gas from the redeveloped Tyra is expected
Sea. The scope of the project includes removing old in Q2, 2023.
facilities, modifying existing ones, and installing new
features. The two existing process and accommodation
platforms will be replaced by one new process platform and
one new accommodation platform. The four wellhead
platforms and two riser platforms will have their jackets
extended by 13 meters, and the current topsides will be
replaced.
High activity levels at both the fabrication yards and
offshore is expected during 2021 and several key milestones
will move the project significantly towards first gas.
Fabrication of the two platforms and two modules take
8Noreco First Quarter 2021
Report for the First Quarter 2021
Norwegian Energy Company ASA
Health, Safety and the Environment financial condition depend on the level of oil and gas prices
and market expectations of these. Further, Noreco is
Noreco will conduct its business operation in full
dependent on successfully developing and producing oil
compliance with all applicable national legislation in the
and gas reserves that are economically recoverable. Unless
countries where it is operating. The Company is committed
the Company replaces its oil and gas reserves, its reserves
to carry out its activities in a responsible manner to protect
and production will decline, which over time could adversely
people and the environment. Our fundamentals of HSEQ
affect its business, financial condition and results of
and safe business practice are an integral part of Noreco’s
operations. Noreco announced 2P reserves of 201 mmboe,
operations and business performance.
at the end of 2020, further described in the Company’s
The outbreak of the coronavirus (COVID-19) and the global
Annual Statement of Reserves 2021. Noreco is also exposed
pandemic continues to severely impact the daily lives of
to risks such as, but not limited to, changes in exchange
people, as well as companies and markets globally. In
rates, interest rates, tax, regulations and access to capital.
response, governments and other authorities have
implemented necessary restrictions which limit the
prerequisites for continuing normal business operations. Outlook
This includes movements of people and their ability to get to
Noreco has built a stable business that is underpinned by
their normal place of work. Noreco’s business continuity
the Company’s position in the DUC. Noreco is well
actions provide us with infrastructure and systems that
positioned going forward to navigate the impact of COVID-
allow all staff to work remotely and, as such, we are able to
19 and any future oil price volatility as a result of price
fully continue operating the Company while safeguarding
hedging arrangements the Company has in place and pro-
our employees.
active steps taken by the operator of the DUC. The Tyra
Redevelopment is progressing and will significantly enhance
Governance and organization the Noreco’s base production after start-up. The Company
also expects field operating expenditure to
The number of employees was 28 at the end of the first
decrease significantly after Tyra is back on production. The
quarter.
Company expects the following production for 2021:
Risks and uncertainties
2021 Guidance
Unit 2020*
An investment in Noreco involves risks and uncertainties as
Production mboepd 25.5-27.5 28.5
described in the Company´s annual report for 2020.
* Figures do not take into account the volume guarantee.
Noreco’s business, results from operations, cash flow and
9Condensed Consolidated Statement of Comprehensive Income Noreco First Quarter 2021
Q1 2020
2020
All figures in USD million Note Q1 2021 restated
Revenue 2 105 124 566
Total revenues 105 124 566
Production expenses 3 (71) (62) (295)
Exploration and evaluation expenses (0) (1) (2)
Personnel expenses (3) (2) (12)
Other operating expenses (2) (2) (8)
Total operating expenses (76) (67) (316)
Operating result (EBITDA) 29 57 250
Depreciation 8, 7 (25) (60) (193)
Net operating result (EBIT) 4 (2) 57
Financial income 4, 7 12 81 103
Financial expenses 4, 7 (44) (88) (177)
Net financial items (32) (6) (75)
Result before tax (EBT) (28) (9) (18)
Income tax benefit / (expense) 5, 7 20 (15) 35
Net result for the period (9) (24) 17
Other comprehensive income (net of tax):
Items that may be subsequently reclassified to profit or loss:
Realized cash flow hedge 2 1 (29)
Related tax - realized cash flow hedge (1) (1) 18
Changes in fair value derivative instruments price hedge (111) 213 108
Related tax - changes in fair value 71 (136) (69)
Currency translation adjustment (2) (1) 3
Total other comprehensive income for the period (net of tax) (40) 76 32
Total comprehensive income for the period (net of tax) (49) 53 49
Earnings per share (USD 1)
Basic (0.4) (1.0) 0.7
Diluted (0.4) (1.0) 0.4
10Condensed Consolidated Statement of Financial Position Noreco First Quarter
2021
All figures in USD million Note 31.03.2021 31.12.2020
Non-current assets
Licence and capitalised exploration expenditures 6, 7 172 175
Deferred tax assets 5, 7 523 432
Property, plant and equipment 8 1,736 1,704
Right of Use asset 0 1
Restricted cash 11, 14 208 196
Derivative instruments 14 - 26
Total non-current assets 2,640 2,533
Current assets
Derivative instruments 14, 7 - 34
Contingent consideration - volume protection 9 - 15
Trade receivables and other current assets 9 57 81
Inventories 10 34 40
Bank deposits, cash and cash equivalents 11 70 259
Total current assets 161 429
Total assets 2,801 2,962
Equity
Share capital 30 30
Other equity 551 600
Total equity 581 630
Non-current liabilities
Asset retirement obligations 15 929 927
Convertible bond loan 12, 14 137 131
Bond loan 12, 14 173 169
Reserve based lending facility 12, 14 720 719
Derivative instruments 14 42 20
Other non-current liabilities 12 25 26
Total non-current liabilities 2,027 1,991
Current liabilities
Asset retirement obligations 15 25 24
Tax payable 5 30 27
Derivative instruments 14 36 5
Trade payables and other current liabilities 13 103 286
Total current liabilities 194 341
Total liabilities 2,220 2,332
Total equity and liabilities 2,801 2,962
11Condensed Consolidated Statement of Changes in Equity Noreco First Quarter
2021
Share Treasury Currency Cash flow
Share premium share translation hedge Other Total
All figures in USD million capital fund reserve fund reserve equity equity
2020
Equity as of 01.01.2020 restated 30 707 - (2) (14) (131) 589
Adjustments prior year 4 (4) -
Net result for the period - restated (24) (24)
Other comprehensive income
Realized cash flow hedge - restated - - - 1 - 1
Related tax - realized cash flow hedge -restated - - - (1) - (1)
Changes in fair value - restated - - - - 213 - 213
Related tax - changes in fair value - restated - - - - (136) - (136)
Currency translation adjustments - - - (1) 0 - (1)
Total other comprehensive income - - - (1) 77 - 76
Share-based incentive program - - - - - 0 0
Share buyback - - (0) - - (9) (9)
Total transactions with owners for the period - - (0) - - (8) (8)
Equity as of 31.03.2020 - restated 30 707 (0) 2 63 (168) 633
2021
Equity as of 01.01.2021 30 707 (0) 6 14 (126) 630
Net result for the period (9) (9)
Other comprehensive income
Realized cash flow hedge - - - - 2 - 2
Related tax - realized cash flow hedge - - - - (1) - (1)
Changes in fair value - - - - (111) - (111)
Related tax - changes in fair value - - - - 71 - 71
Currency translation adjustments - - - (2) - - (2)
Total other comprehensive income - - - (2) (39) - (41)
Share-based incentive program - - - - - 0 0
Total transactions with owners for the period - - - - - 0 0
Equity as of 31.03.2021 30 707 (0) 4 (25) (134) 581
12Condensed Consolidated Statement of Cash Flows Noreco First Quarter
2021
Q1 2020
All figures in USD million Note Q1 2021 restated 2020
Cash flows from operating activities
Net result for the period (9) (24) 17
Adjustments for:
Income tax benefit 5 (20) 15 (35)
Depreciation 8 25 60 193
Share-based payments expenses 0 0 2
Net financial item 4 32 6 75
Changes in:
Trade receivable 9 19 28 3
Trade payables1) 13 (169) (17) 79
Inventories and spare parts 9 6 (4) 5
Prepayments 9 5 6 8
Over-/underlift 9 (13) (8) 0
Other current balance sheet items - - 0
Net cash flow from operating activities (122) 62 348
Cash flows from investing activities
Volume guarantee 9 15 33 102
Tax Paid2) - - (72)
Investment in oil and gas assets 8 (56) (66) (236)
Investment in exploration licenses 0 (1) (2)
Abandonment spent3) (2) (19) (74)
Changes in restricted cash accounts 11 (15) - (75)
Net cash flow from investing activities (58) (53) (359)
Cash flows from financing activities
Drawdown long-term loans 12 - - 6
Lease payments (0) (0) (1)
Share buyback - (9) (10)
Transaction costs related to financing - - (1)
Transaction costs related to equity issue - - (0)
Interest paid (11) (12) (56)
Settled hedges (1) - 52
Other financial items 3 (0) (6)
Net cash flow from financing activities (9) (22) (16)
Net change in cash and cash equivalents (189) (13) (26)
Cash and cash equivalents at the beginning of the period 259 286 286
Cash and cash equivalents at end of the quarter 70 273 259
1) In Q1 2021 the VAT liability related to 2020 of USD 156 million was paid, the payment date was delayed to Q1 2021 by the Danish
government as a response to the impact of COVID-19 on the economy.
2)Tax paid which were attributable to the period before the acquisition is classified as investing activities.
3) Abandonment spent reclassified from financing activities to investing activities.
13Noreco First Quarter
Notes
2021
Notes
14Noreco First Quarter
Notes
2021
1 Accounting Principles
Norwegian Energy Company ASA (“Noreco”, “the Company” under the contract to deliver either cash or a nonfinancial
or “the Group”) is a public limited liability company asset.
registered in Norway, with headquarters in Oslo (Nedre
Vollgate 1, 0158 Oslo). The Company has subsidiaries in Reference to summary of significant accounting policies
Norway, Denmark, Netherlands and the United Kingdom. These interim financial statements are prepared using the
The Company is listed on the Oslo Stock Exchange. same accounting principles as the annual financial
statements for 2020, except for a change in presentation of
Basis for preparation abandonment spent in the condensed consolidated
The interim condensed consolidated financial statements statement of cash flows. From Q1 2021, the group is
(the interim financial statements) for the first quarter of 2021 presenting these cash flows as investing activities, while
comprise Norwegian Energy Company ASA (Noreco) and its they prior to 2021 have been presented as financing
subsidiaries. These interim financial statements have been activities. The reason for the change is that in our view the
prepared in accordance with IAS 34 Interim Financial abandonment spend is more closely linked to investing
Reporting as adopted by the EU. The interim financial activities than financing and thus deemed more relevant to
statements do not include all the information and include under investing activities. The abandonment spent
disclosures required to represent a complete set of financial reclassified from financing to investing activities amounts to
statements, and these interim financial statements should USD 19 million and USD 74 million in Q1 2020 and full year
be read in conjunction with the annual financial statements. 2020 respectively.
The interim financial statements are unaudited. The
subtotals and totals in some of the tables may not equal the The commodity contracts discussed above which are now
sum of the amounts shown due to rounding. The interim subject to the ‘normal purchase or sale exemption’ and the
financial statements for the first quarter of 2021 were related intangible assets and their amortisation. Prior to Q3
approved by the Board of Directors on 10 May 2021. 2020 these contracts were accounted for as financial assets
with subsequent fair value changes recognised in profit or
Going concern loss.
The Board of Directors confirms that the interim financial
statements have been prepared under the presumption of Comparative in the notes has been updated to reflect the
going concern, and that this is the basis for the preparation revised PPA however it is not marked as restated. For further
of these interim financial statements. The financial solidity details see note 9 Acquisition of subsidiary – Final purchase
and the Company's cash and working capital position are price allocation.
considered satisfactory in regards of the planned activity
level until Q2 2023. For the full summary of significant accounting policies,
reference is made to the annual financial statements for
Derivative financial instruments and hedging activities 2020.
Commodity contracts that were entered into and continue
to be held for the purpose of the delivery of a non-financial Critical accounting estimates and judgements
item in accordance with the Group’s expected sale Estimates and judgements are continually evaluated and are
requirements fall within the exception from IFRS 9, which is based on historical experience and other factors, including
known as the ’normal purchase or sale exemption’ or the expectations of future events that are believed to be
‘own use’ scope exception. For these contracts and the host reasonable under the circumstances. The significant
part of the contracts containing embedded derivatives, they judgements made in applying the Group’s accounting
are accounted for as executory contracts. The Group policies and the key sources of estimation uncertainty were
recognises such contracts in its statement of financial the same as those described in the last annual financial
position only when one of the parties meets its obligation statements.
15Noreco First Quarter
Notes
2021
2 Revenue
USD million Q1 2021 Q1 2020
Sale of oil 84 112
Sale of gas and NGL 20 10
Other income 2 2
Total Revenue 105 124
Oil - lifted volumes (mmbbl) 1.50 1.89
Realised oil price USD/bbl 55.9 59.0
In the first quarter, Noreco’s sale of oil amounted to USD 84 million and realised price was USD 55.9 per bbl of oil lifted
during the period, adjusted for settlement of price hedges in place with financial institutions.
During the first quarter, Noreco recognised the settlement of price hedges that were put in place with financial institutions in
the market as revenue, when these price hedges matches the physical sale of oil. Price hedges in excess of actual lifting are
treated as financial income or financial expenses based on the required accounting treatment for these instruments during
the period.
16Noreco First Quarter
Notes
2021
3 Production Expenses
USD million Q1 2021 Q1 2020
Direct field opex (46) (40)
Tariff and transportation expenses (14) (11)
Production G&A (10) (14)
Field operating cost (71) (66)
Total produced volumes (mmboe) 2.3 2.9
In USD per boe (30.5) (22.7)
Adjustments for:
Change in inventory position (4) 4
Over/underlift of oil and NGL 13 8
Insurance & Other* (6) (6)
Stock Scrap (3) (2)
Production expenses (71) (62)
*Insurance cost in 2020 moved from G&A to production expense.
Production expenses for the first quarter directly attributable to the lifting and transportation to market of Noreco’s oil and
gas production are in total USD 71 million, which equates to USD 30.5 per boe produced during the period compared to
USD 22.7 per boe in Q1 2020. We continue to work with the operator to identify opportunities to reduce operational costs,
recognising there is a balance between expenditure and operational performance. The increase in cost per boe is mainly due
to lower production than expected during the quarter and the DKK/EUR to USD exchange rate being lower in Q1 2021
compared to Q1 2020. Using a like for like exchange rate, field operating costs are slightly lower in Q1 2021 vs Q1 2020 by
USD 1 million. This cost decrease was primarily related to a delay in the arrival of the Sam Turner rig due to COVID-19
restrictions (arrival in mid-March rather than January).
In the current period Noreco recognised a cost reduction of USD 13 million related to a decrease in the overlift position
compared to the end of last quarter (measured at production cost). The Company also recognised a cost of USD 4 million
related to a decrease in the Crude Oil inventory compared to the end of last quarter.
17Noreco First Quarter
Notes
2021
4 Financial Income and Expenses
Financial Income
Q1 2020
USD million Q1 2021
restated
Value adjustment derivatives and hedging contracts unrealized 1) - 40
Value adjustment of embedded derivatives 2)
- 22
Hedge income realised - 6
Interest income - 1
Net foreign exchange gains 12 12
Total financial income 12 81
Financial Expenses
Q1 2020
USD million Q1 2021
restated
Utilisation of derivatives (2) -
Unrealized loss derivatives (1) -
Value adjustment of embedded derivatives 2)
(2) -
Value adjustment - volume protection 3) - (38)
Value adjustment - FX Contract (1) -
Interest expense from bond loans (10) (9)
Interest expense from bank debt (12) (13)
Interest expenses current liabilities (0) (0)
Accretion expense related to asset retirement obligations (9) (9)
Net foreign exchange losses (7) (17)
Other financial expenses (1) (1)
Total financial expenses (44) (88)
Net financial items (32) (6)
1) Fair value adjustment based on the value of bank hedging contracts deemed inefficient (i.e. above physical liftings that mature in
the future).
2) Fair value adjustment of the embedded derivatives of the convertible bond.
3) Fair value adjustment of the volume protection – contingent consideration based on the change in future market pricing
expectations during the remaining period of the volume hedging agreement with Shell.
18Noreco First Quarter
Notes
2021
5 Tax
TAX RATES
Producers of oil and gas on the Danish Continental Shelf are subject to the hydrocarbon tax regime under which, income derived from the
sale of oil and gas is taxed at an elevated 64 %. Any income deriving from other activities than first-time sales of hydrocarbons is taxed at the
ordinary corporate income rate of currently 22 %. The 64 % is calculated as the sum of the “Chapter 2” tax of 25% plus a specific
hydrocarbon tax (chapter 3A) of 52%, in which the 25% tax payable is deductible.
Income generated in Norway and United Kingdom is subject to regular corporate tax at 22 %.
TAX EXPENSE
USD million
Income tax in profit/loss (Danish corporate income tax and hydrocarbon tax) 2021
Income tax current year (3)
Income tax for prior years -
Current income tax (3)
Deferred tax 23
Prior year adjustment, deferred tax -
Deferred tax expense 23
Tax (expense)/ income 20
Income tax in profit/loss is solely derived from the group's activities on the Danish continental shelf, of which the major part is subject to the
elevated 64% hydrocarbon tax.
Tax (expense)/income related to other comprehensive income
Cash flow hedges 69
Tax (expense)/income related to other comprehensive income 69
Income tax on OCI is related to the unrealised fair value changes in derivatives designated in cash flow hedges. To the extent derivates are
associated with the sale of oil and gas, result from cash flow hedges are subject to 64 % hydrocarbon tax.
Hydrocarbon tax
Corporate tax 22%
64%
Reconciliation of nominal to actual tax rate: YTD 2021 YTD 2021 In total
Income (loss) before tax (14) (14) (28)
Expected tax on profit before tax (9) 64% (3) 22% (12)
Tax effect of:
Prior year adjustment - 0% - 0% -
Transfer of loss to 22 % tax - 0% - 0% -
FX adjustment of net operating losses carried forward in DKK - 0% - 0% -
Investment uplift on CAPEX projects1) (13) 93% - 0% (13)
Permanent differences - 0% - 0% -
No recognition of tax assets in Norway and UK - 0% 6 42% 6
Tax expense (income) in profit/loss (23) 157% 3 20% (20)
1)
The tax cost in the hydrocarbon is significantly positively impacted by the 39 % investment uplift on the Tyra Redevelopment project.
19Noreco First Quarter
Notes
2021
Reconciliation of nominal to actual tax rate continues:
Other comprehensive income before tax 80 2 82
Expected tax on other comprehensive income before tax (51) 64% (0) 22% (52)
Tax effect of:
Non taxable currency translation adjustment - 1 1
Tax in other comprehensive income (51) 64% 1 22% (51)
Current income tax payable
Tax payable relates to the Group's entities in Denmark. The amounts payable as of 31.03.20 were:
Hydrocarbon tax pertaining to pre-acquisition period 2019 not indemnified (16)
Corporate tax for 2019 (Denmark) -
Corporate tax for 2020 (Denmark) (15)
Tax payables (30)
Current income taxes for current and prior periods are measured at the amount that is expected to be paid to or be refunded from the tax
authorities, as at the balance sheet date. Due to the complexity in the legislative framework and the limited amount of guidance from
relevant case law, the measurement of taxable profits within the oil and gas industry is associated with a some degree of uncertainty.
Uncertain tax liabilities are recognised with the probable value if their probability is more likely than not.
DEFERRED TAX
Deferred tax assets are measured at the amount that is expected to result in taxes due to temporary differences and the value of tax losses.
The recognized deferred tax asset is allocable to the following balance sheet items, all pertaining to the Group’s activities on the Danish
Continental Shelf:
Effect
recognized Effect
USD million in recognized
Deferred tax and deferred tax asset 1-Jan-21 profit/loss in OCI 31-Mar-21
Property, plant and equipment 582 (7) - 576
Intangible assets, licenses 23 (7) - 16
Inventories and receivables 22 - - 22
ARO provision (561) (2) - (563)
Other assets and liabilities - - - -
Tax loss carryforward, chapter 2 tax (25%) (1) - (27) (27)
Tax loss carryforward, chapter 3a tax (52%) (498) (7) (42) (547)
Deferred tax asset, net (432) (23) (69) (524)
20Noreco First Quarter
Notes
2021
6 Intangible assets and goodwill
Capitalised
exploration Contract -
USD million expenditures own use Licence Goodwill Total
Acquisition costs as of 01.01.2021 2 128 186 266 582
Additions (0) - - - (0)
Acquisition costs as of 31.03.2021 2 128 186 266 581
Accumulated depreciation, amortization and write-downs as of 01.01.2021 - (128) (13) (266) (407)
Depreciation / amortization - - (2) - (2)
Accumulated depreciation, amortization and write-downs as of 31.03.2021 - (128) (15) (266) (409)
Book value as of 31.03.2021 2 - 171 - 172
21Noreco First Quarter
Notes
2021
7 Acquisition of subsidiary – Final purchase price allocation
On 31 July 2019 the Company’s acquisition of Shell Olie- og Gasudvinding Danmark B.V. was completed. Following the
acquisition Noreco has a 36,8% interest in the Danish Underground Consortium (DUC) with 11 producing fields and related
infrastructure. The transaction was considered to be a business combination and has been accounted for using the
acquisition method of accounting as required by IFRS 3.
A provisional purchase price allocation (PPA) was performed in the third quarter of 2019 and a final PPA was completed in the
third quarter of 2020. No adjustments was made to the estimated fair values of the identified assets and liabilities which
were measured at the acquisition date. However, one commodity contract which was provisionally identified as financial
assets, measured at USD 128 million in the provisional PPA, and for which subsequent value changes was recognized in profit
or loss, was reassessed and determined to constitute intangible assets measured at a fair value of USD 128 million.
The basis for the revised determination is the fact that the commodity contract to which the fair values relate have now been
determined to constitute ‘normal purchase or sale’ or so called ‘own use contracts’ which are exempted from IFRS 9, rather
than financial assets as provisionally assumed. Subsequent to initial recognition these intangible assets are, in these restated
financial statements, being amortized over the period of lifting of the underlying commodity volumes. The adjustment in total
revenue is related to the timing difference between when the value of each hedge is set and when they are ultimately
utilized. Total revenue, in these restated financial statements, reflects only the physical volumes delivered. See below table
for a reconciliation of the reported and restated financial statement line items.
Comparative consolidated statement of comprehensive income
Q1 Q1 2020 Q2 Q2 2020 YTD YTD 2020
All figures in USD million 2020 Adj restated 2020 Adj restated 2020 Adj restated
Total revenues 148 (25) 124 135 5 140 283 (20) 264
Total operating expenses (67) (67) (65) (65) (132) (132)
Operating result (EBITDA) 82 (25) 57 69 5 75 151 (20) 132
Depreciation (34) (25) (60) (24) (27) (51) (58) (52) (110)
Net operating result (EBIT) 48 (50) (2) 45 (22) 24 93 (72) 21
Financial income 87 (6) 81 (2) 4 2 86 (2) 84
Financial expenses (115) 27 (88) (55) 41 (14) (170) 68 (102)
Net financial items (27) 21 (6) (57) 46 (12) (85) 66 (18)
Result before tax (EBT) 20 (29) (9) (12) 24 12 9 (5) 3
Change in deferred tax / - asset (34) 19 (15) 32 (16) 16 (3) 4 1
Net result for the period (14) (10) (24) 20 8 28 6 (2) 4
22Noreco First Quarter
Notes
2021
Comparative Consolidated Statement of Financial positions
31.03.2020 30.06.2020
All figures in USD million 31.03.2020 Adj restated 30.06.2020 Adj restated
Non-current assets
Licence and capitalised exploration expenditures 179 61 240 177 34 211
Deferred tax assets 187 100 287 305 38 343
Property, plant and equipment 1,585 1,585 1,618 1,618
Right of Use asset 1 1 1 1
Restricted cash 114 114 115 115
Other non-current financial investments - - - -
Contingent consideration - volume protection - - - -
Derivative instruments 135 - 135 82 - 82
Total non-current assets 2,201 161 2,362 2,298 72 2,371
Current assets
Derivative instruments 284 (181) 104 160 (65) 96
Contingent consideration - volume protection 49 49 55 55
Trade receivables and other current assets 134 (31) 103 143 (23) 120
Restricted cash - - - -
Bank deposits, cash and cash equivalents 273 273 227 227
Total current assets 741 (211) 530 586 (88) 498
Total assets 2,942 (50) 2,892 2,884 (16) 2,869
31.03.2020 30.06.2020
All figures in USD million 31.03.2020 Adj restated 30.06.2020 Adj restated
Equity
Share capital 30 30 30 30
Other equity 653 (50) 603 633 (16) 618
Total equity 683 (50) 633 663 (16) 647
Total non-current liabilities 1,958 1,958 1,944 1,944
Total current liabilities 301 - 301 277 277
Total liabilities 2,259 - 2,259 2,222 2,222
Total equity and liabilities 2,942 (50) 2,892 2,884 (16) 2,869
23Noreco First Quarter
Notes
2021
A. Consideration transferred
The following table summarizes the acquisition-date fair value of the total purchase price.
USD million
Initial Cash payment 40
Cash payment 31.12.2018 40
Cash at Completion 1,104
Volume guarantee refund until June 2019 (33)
Total Consideration at completion 2019 1,071
Settlement of prepaid cost – reimbursed to seller 5
Volume guarantee for July 2019 (10)
Locked Box Interest 63
Total Cash payment 31.12.19 1,170
Adjustments:
Deferred payment 25
Volume guarantee market value (81)
Total Purchase price 1,114
B. Identifiable assets acquired and liabilities assumed
A purchase price allocation (PPA) has been performed and all identified assets and liabilities have been measured at the
acquisition date at their fair values in accordance with the requirements of IFRS 3. The fair values of the identifiable assets
and liabilities in the transaction have been estimated as follows:
Provisional Adj Final
USD million SOGU SOGUP
PPA SOGU PPA
Assets
Tangible and intangible fixed assets 1,712 2 1,714 128 1,842
Deferred tax assets 2 1 3 - 3
Financial assets at fair value 128 - 128 (128) (0)
Inventories 61 - 31 - 61
Net working capital 99 24 123 - 123
Total Assets 2,002 27 2,029 - 2,029
Liabilities
Asset retirement obligation (918) (1) (919) - (919)
Trade and other payables (118) (0) (118) - (118)
Tax payables (144) - (144) - (144)
Total Liabilities (1,180) (1) (1,181) - (1,181)
- -
Total identifiable net assets at fair value 848 - 848
Fair value is based on an NPV calculation on a debt / cash free basis.
24Noreco First Quarter
Notes
2021
D. Goodwill
USD million
Total consideration 1,114
Total identifiable net assets at fair value 848
Goodwill 266
Impairment (266)
Goodwill -
8 Property, Plant and Equipment
Asset under Production Machinery &
USD million construction facilities Pipelines equipment Total
Acquisition costs as of 01.01.2021 608 1,259 2 2 1,870
Additions 55 1 - 0 56
Currency translation adjustment - (0) (0) 0 (0)
Acquisition costs as of 31.03.2021 663 1,259 2 2 1,925
Accumulated depreciation and write-downs
Accumulated depreciation and write-downs as of 01.01.2021 - (165) (0) (1) (166)
Depreciation - (23) (0) (0) (23)
Currency translation adjustment - 0 0 (0) 0
Accumulated depreciation and write-downs as of 31.03.2021 - (188) (0) (1) (189)
Book value as of 31.03.2021 663 1,071 1 1 1,736
An impairment review for the holding value of Noreco’s oil and gas assets was performed following the announcement of a
delay in first gas from the Tyra Redevelopment project in Q4 2020. The outcome of the impairment test was that no
impairment deemed necessary. The company continues to monitor all relevant local and global economic markets for
indicators of impairment. Noreco does not consider there are any indicators of impairment at the current time, consequently
the assessment carried out in Q4 2020 remains valid.
9 Non-Current Receivables, Trade Receivables and Other Current Assets
USD million 31.03.2021 31.12.2020
Current assets
Contingent consideration – volume protection - 15
Trade receivables 6 51
Prepayments 18 23
Other receivables 34 8
Total trade receivables and other current receivables 57 96
25Noreco First Quarter
Notes
2021
10 Inventories
USD million 31.03.2021 31.12.2020
Product inventory, oil 14 18
Other stock (spares & consumables) 20 21
Total inventories 34 40
11 Restricted Cash, Bank Deposits, Cash and Cash Equivalents
USD million 31.03.2021 31.12.2020
Non-current assets
Restricted cash pledged as security for abandonment obligation related to Nini/Cecilie 68 71
Restricted cash pledged as security for cash call obligations towards Total 1)
140 125
Total non-current restricted cash 208 196
Current assets
Unrestricted cash, bank deposits, cash equivalents 70 259
Total bank deposits 278 456
1) Noreco has made a USD 140 million deposit into a cash call security account in accordance with a cash call security agreement with
Total E&P Denmark A/S as operator of the DUC. From August 2020 until January 2021 the escrow increased by USD 15 million monthly,
up to a total of USD 140 million. There will be no further increase.
26Noreco First Quarter
Notes
2021
12 Borrowings
31.03.2021 31.12.2020
Principal Book Principal Book
USD million amount value amount value
NOR 13 Convertible Bond 1) 178 137 171 131
NOR 14 Senior Unsecured Bond 2) 175 173 175 169
Total non-current bonds 353 310 346 299
Reserve based lending facility 3) 751 720 751 719
Deferred Consideration 4) 25 25 25 25
Total non-current debt 776 745 776 744
Total borrowings 1,129 1,055 1,122 1,043
Note: book values reported on the basis of amortised cost for NOR14, the reserve-based lending facility and the convertible bond loan
element of NOR13.
1) The Company issued a convertible bond loan of USD 158 million in 2019 where the lender was granted a right to convert the loan
into new shares in the Company by way of set-off against the claim on the Company. The loan carries an interest of 8% p.a. on a PIK
basis, with an alternative option to pay cash interest at 6% p.a., payable semi-annually.
2) The Company issued a senior unsecured bond of USD 175 million in 2019. The bond carries an interest of 9% p.a., payable semi-
annually.
3) The Company entered into a seven-year USD 900 million Reserve Based Lending Facility in 2019 as part of the acquisition. Interest
is accrued on the repayment amount with an interest comprising the aggregate of 3-month LIBOR and 4% p.a., payable quarterly.
4) In accordance with the SPA with Shell USD 25 million of the consideration is due the earliest of March 2023 and finalising Tyra
Redevelopment.
Interest payments (USD million)
Reserve Based Deferred
Year NOR13* NOR14 Lending Facility consideration Total
Interest rate 9,0% LIBOR + 4% 4,0%
2021 - 16 36 1 53
2022 - 16 35 1 52
2023 - 16 29 1 46
2024 - 16 19 - 35
2025 - 16 8 - 24
2026 - 8 - - 8
Total - 87 127 3 217
* NOR13 carries a variable interest charge of: (i) 6% per annum in cash, payable semi-annually, or; (ii) 8% per annum payment in kind (“PIK”)
cumulative interest, rolled up semi-annually, to add to NOR13 capital on conversion at expiry of the bond. Currently the company has elected
the PIK interest of 8% and is therefore forecasting no cash interest payments on NOR13 in the above table.
27Noreco First Quarter
Notes
2021
13 Trade Payables and Other Current Liabilities
USD million 31.03.2021 31.12.2020
Trade payable 1 1
Liabilities to operators relating to joint venture licences 82 97
Overlift of oil/NGL 0 13
Accrued interest 2 3
Salary accruals 2 1
Public duties payable 1) 6 159
Other current liabilities 10 13
Total trade payables and other current liabilities 103 286
1)
Public duties payable at the end of 2020 of USD 159 million relate to Noreco’s VAT liability covering sales during 2020. This amount was
paid in the first quarter of 2021, with the payment date having been delayed by the Danish government as a response to the impact of COVID-
19 on the economy.
28Noreco First Quarter
Notes
2021
14 Financial Instruments
14.1 Fair Value Hierarchy
The table below analyses financial instruments carried at fair value, by valuation method.
The different levels have been defined as follows:
Level 1 Quoted prices (unadjusted) in active markets for identical assets or liabilities.
Level 2 Inputs other than quoted prices included within level 1 that are observable for the asset or liability, either directly or
indirectly.
Level 3 Inputs for the asset or liability that are not based on observable market data.
On 31.03.2021
USD million Level 1 Level 2 Level 3 Total
Assets
Financial assets at fair value through profit or loss
– Contingent considerations - - - -
– Derivative instruments price hedge - - - -
Financial assets at fair value hedging instruments
– Derivative instruments price hedge - - - -
Total assets - - - -
Liabilities
Financial liabilities at fair value through profit or loss
– Derivative instruments price hedge - - - -
– Embedded derivatives convertible bond - - 20 20
Financial liabilities at fair value hedging instruments
– Derivative instruments price hedge - 59 - 59
Total liabilities - 59 20 79
On 31.12.2020
USD million Level 1 Level 2 Level 3 Total
Assets
Financial assets at fair value through profit or loss
– Contingent considerations - - 15 15
– Derivative instruments price hedge - 3 - 3
Financial assets at fair value hedging instruments
– Derivative instruments price hedge - 57 - 57
Total assets - 60 15 75
Liabilities
Financial liabilities at fair value through profit or loss
– Derivative instruments price hedge - - - -
– Embedded derivatives convertible bond - - 18 18
Financial liabilities at fair value hedging instruments
– Derivative instruments price hedge - 7 - 7
Total liabilities - 7 18 25
29Noreco First Quarter
Notes
2021
14.2 Financial Instruments by Category
Financial Assets at fair Fair value -
On 31.03.2021 assets at value through hedging
USD million amortised cost profit or loss instruments Total
Assets
Contingent considerations - - - -
Derivative instruments price hedge - - - -
Trade receivables and other current assets 57 - - 57
Restricted cash 208 - - 208
Bank deposits, cash and cash equivalents 70 - - 70
Total 336 - - 336
Financial Liabilities at fair Fair value -
liabilities at value through hedging
USD million amortised cost profit or loss instruments Total
Liabilities
Derivative instruments price hedge - - 59 59
Embedded derivative convertible bond - 20 - 20
Convertible bond loans 137 - - 137
Senior unsecured bond loan 173 - - 173
Reserve based lending facility 720 - - 720
Deferred consideration 25 - - 25
Lease liability 1 - - 1
Trade payables and other current liabilities 36 - - 36
Total 1,091 20 59 1,170
Financial Assets at fair Fair value -
On 31.12.2020 assets at value through hedging
USD million amortised cost profit or loss instruments Total
Assets
Contingent considerations - 15 - 15
Derivative instruments price hedge - 3 57 60
Trade receivables and other current assets 81 - - 81
Restricted cash 196 - - 196
Bank deposits, cash and cash equivalents 259 - - 259
Total 537 18 57 612
30Noreco First Quarter
Notes
2021
Financial Liabilities at fair Fair value -
liabilities at value through hedging
USD million amortised cost profit or loss instruments Total
Liabilities
Derivative instruments price hedge - - 7 7
Embedded derivatives convertible bond - 18 - 18
Convertible bond loans 131 - - 131
Senior unsecured bond loan 169 - - 169
Reserve based lending facility 719 - - 719
Deferred consideration 25 - - 25
Lease liability 1 - - 1
Trade payables and other current liabilities 286 - - 286
Total 1,330 18 7 1,355
14.3 Financial Instruments — Fair Values
Set out below is a comparison of the carrying amounts and fair value of financial instruments as on 31 March 2021:
Total amount Carrying Fair
USD million outstanding* Amount Value
Financial assets
Trade receivables and other current assets 57 57
Restricted cash 208 208
Bank deposits, cash, cash equivalents and quoted shares 70 70
Total 336 336
Financial liabilities
Derivative instruments price hedge 59 59
Embedded derivative convertible bond 20 20
Convertible bond loans 178 137 158
Senior unsecured bond loan 175 173 175
Reserve based lending facility 751 720 751
Deferred consideration 25 25
Lease liability 1 1
Trade payables and other current liabilities 103 103
Total 1,104 1,236 1,291
* Total amount outstanding on the bonds and under the RBL facility
The convertible bond loan has been determined to contain embedded derivatives which are accounted for separately as
derivatives at fair value through profit or loss, while the loan element subsequent to initial recognition is measured at
amortized cost, a total of USD 4,5 million in transaction cost is included in the amortized cost. The embedded derivative is
valued on an option valuation basis, the carrying value is USD 20 million (initial value USD 54 million). As a result of the
buyback of 299,925 shares at a price of NOK 242 per share on 23 January 2020, the conversion price for the NOR13
subordinated convertible bond issue was adjusted in accordance with the bond terms, from USD 29.3398 to USD 28.9734,
effective from the trade date of the purchase of shares. The fair value calculation for the option portion of the NOR13 bond
includes this update to the conversion price.
31Noreco First Quarter
Notes
2021
The following table lists the inputs to the model used to calculate the fair value of the embedded derivatives:
2021
Valuation date (date) 31 Mar 21
Agreement execution date (date) 24 Jul 19
Par value of bonds (USD) 171,042,171
Reference share price at time of agreement (NOK) 232
Fair value at grant date (USD) 53,942,754
PIK interest rate (%) 8.00%
Expected life (years) 2.6
Number of options (#) 6,139,558
Conversion price (NOK) 238
Fixed FX rate of agreement (USD:NOK) 8.180
Risk-free rate (based on government bonds) (%) 1.20%
Expected volatility (%) 48.36%
Model used Black - Scholes - Merton
The RBL facility is measured at amortized cost, in addition a total of USD 42 million in transaction cost. Transaction costs are
deducted from the amount initially recognised and are expensed over the period during which the debt is outstanding under
the effective interest method.
The senior unsecured bond loan is measured at amortized cost, in addition a total of USD 7.6 million in transaction cost are
deducted from the amount initially recognised.
14.4 Hedging
The Group actively seeks to reduce the risk it is exposed to regarding fluctuating commodity prices through the
establishment of hedging arrangements. To the extent more than 100% of the projected production is hedged any value
adjustments to the instruments covering in excess of 100% are considered ineffective and the value adjustment is treated as
a financial item in the Income Statement. The ineffective amount in Q1 2021 charged to financial items in the Income
Statement were a loss of USD 1.8 million. Time Value related to hedging arrangements is considered insignificant and
generally the valuation of the instruments do not take into consideration the time value.
Noreco has to date executed this policy in the market through a combination of forward contracts and options.
Under its RBL facility, Noreco has a rolling hedge requirement based on a minimum level of production corresponding to the
RBL banking case forecast. Due to the volatile oil market conditions in 2020, Noreco requested and received a waiver from
its RBL bank syndicate relating to the hedging requirements in the 24 to 36 months forward period. In Q1 2021 Noreco has
entered into additional forward contracts covering some of the 2021 production and 2023 production, with this, Noreco is
again in compliances with the hedge requirement under the RBL facility.
32You can also read