Guiding a bank's energy portfolio to Paris - Strategy & Sustainability Benchmarking the financial transition to a Paris-proof economy - Long Finance
←
→
Page content transcription
If your browser does not render page correctly, please read the page content below
Strategy & Sustainability

Guiding a bank’s
energy portfolio
to Paris
Benchmarking the financial transition to a Paris-proof economy

                                                                 Next page u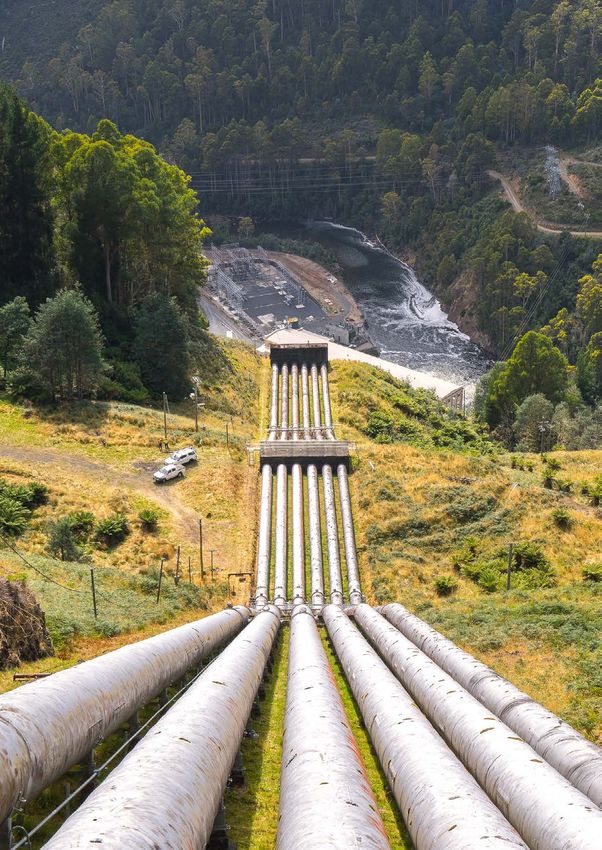
2

 Benchmarking the financial transition to a Paris-proof economy

       Table of contents
         Preface									Page 2
         From the Author								Page 3
         Executive Summary							Page 4
         Section 1: Why								Page 6
         Section 2: How								Page 8
         Section 3: What								Page 14
         Section 4: Recommendation						Page 20
         Section 5: Useful Resources						Page 22
         Section 6: Right to Copy & Acknowledgements				                                       Page 24

                                                                  2015 created momentum for such a systemic shift.
                                  Preface by Climate              Governments agreed to limit global warming, adapt to
                                  Envoy of the Kingdom            the already changing climate and bring financial flows
                                  of the Netherlands              in line with these objectives. Since then governments
                                                                  have continued to work on details of the agreement.
                                  Marcel Beukeboom                Their diplomats are working on the distribution of
                                                                  individual countries’ contributions. One could argue
                                                                  that a diplomat’s profession is similar in some ways to
                                                                  that of the archetypical banker: things are not moving
   I grew up with the archetypical image of a banker. My          fast enough.
   uncle was a director of a local bank in a rural town
   in the Netherlands. Solid and reliable, one of the             Although much work remains to be done on the
   dignitaries of the town. You could trust him with your         technical aspects of the Paris Agreement, it is
   money, and be sure that investment advice would be             already having a deep impact in the real economy.
   on the conservative side. Keeping risks manageable             Customer demands across the globe are changing
   meant that he usually kept things as they were.                due to a growing awareness of the urgency of the
                                                                  climate crisis and businesses are responding to
   “Keeping things as they are” is no longer the name of          these changing customer demands. And despite the
   the game. Doing the things we have always done will            conservative DNA of bankers, the Dutch financial
   irrevocably lead us to be hit by the limits to growth that     sector is now showing leadership, realising that it is in
   the Club of Rome outlined as long as 50 years ago.             their customers’ best interest to be proactive in this
   Changing our behaviour proves to be the most difficult         systemic shift.
   part of the required transition. This is especially true
   for bankers, for whom more change equals more risk.            As a climate diplomat I see the difficult geopolitical
   From whom we, their customers, demand that they                realities, slowing the pace of implementation of the
   avoid situations that can lead to losses.                      Paris Agreement. At the same time I see many people
                                                                  acting on its promise. I take the example of financial
   What is different from the time of my uncle, is that we        institutions like ABN AMRO, and partnerships among
   are now aware that we are facing global warming. The           financial institutions such as PCAF, with me into this
   resulting climate change also puts us at risk of losing        world of tough negotiations. These examples put
   ecosystems, biodiversity, air and soil quality and nature      pressure on those unwilling to act, and inspire those
   at an unprecedented rate. This situation demands               who do not yet know how to act.
   more than incremental change – we are looking for
   systemic shifts. The Paris Climate Agreement of                Together we can make it happen.

t Previous page                                                                                                     Next page u
3

 Benchmarking the financial transition to a Paris-proof economy

                                                                  Cool, calm and collected
                                From the author,                  We also acknowledge that climate change at times has
                                Global Sustainability             become a media circus with many alarming distractions.
                                Advisor                           Professionals at the bank have to remain cool, calm
                                                                  and collected. It is this mindset that drove ABN AMRO
                                Jan Raes                          to collaborate with the international think tank called
                                                                  2 Degrees Investing Initiative (2DII). Together with financial
                                                                  players around the world, 2DII operates at the crossroads
                                                                  of climate science, finance and data science. ABN AMRO
                                                                  and 2DII were already in contact in the run-up to the Paris
                                                                  Agreement. In 2012 2DII polled ABN AMRO about the
A better understanding of climate change in relation              preparation of France’s groundbreaking article 173. This
to banking                                                        article of law contains the French regulation on obligatory
The IPCC has been researching the complex relationship            climate reporting by financial institutions. This was also
between climate change, global warming, human activity            the year that ABN AMRO made public that sustainable
and economic loss for years. The scientific community of          banking was an integral part of the bank’s long-term
the IPCC by now offers statistical proof for the increase         priorities. Continued collaboration with 2DII is part and
of economic loss due to extreme weather events.                   parcel of ABN AMRO’s structured and integrated way
Uncertainties remain about the relationship between               of making sustainable ambitions and targets concrete
cause and effect, because weather events are variable             and actionable for ABN AMRO’s business lines and
over time and have an unequal geographical distribution           employees.
across the globe. Despite these uncertainties and the lack
of perfect correlations, this IPCC research has been going        Paris Agreement is a game changer
on for decades and by now it is showing a clear trend,            Since the signing in 2015, ABN AMRO has considered
based on a high level of confidence and a high level of           the Paris Agreement to be a game changer. The Paris
agreement. It is this growing body of scientific evidence         agreement offers guidance for making ABN AMRO’s
that has put the economic effects of climate change on            energy portfolio Paris-Proof. Financial institutions will
ABN AMRO’s agenda. The estimates of annual economic               increasingly focus on those areas where the production
losses in consumption range widely from a few billion             profile of clients does not align with the Paris Agreement’s
euros to 200 or even 500 billion euros per year.                  goal: “Holding the increase in the global average
                                                                  temperature to well below 2°C above pre-industrial levels
Beyond the precautionary principle                                and pursuing efforts to limit the temperature increase
While the scientific community continues gathering                to 1.5°C above pre-industrial levels.” We are only five
evidence and data, the precautionary principle alone is           years down the road now with the Paris Agreement.
enough for ABN AMRO to prepare and to act. At ABN                 Achievement of these goals is a match that will be played
AMRO we also dare to go beyond this precautionary                 over the course of the next decade, the next twenty to
principle, since we believe that the economic effects             thirty years. The longer we wait, the more expensive the
could even be greater than currently projected by the             solutions will be .
IPCC. After all, the loss of human life and damage to
precious ecosystems is hard to monetise and not yet               Advice to the reader
fully reflected in the IPCC’s estimates. These insights           Although the executive summary can save the average
call for adjustments to our current activities. Economic          reader precious time, we advise those professionals that
sectors in which the bank’s clients are active will undergo       are involved in the combination of energy, finance and
transformation or fundamental change over the coming              the role it plays in preventing uncontrolled climate change
years. Therefore the bank has taken on the challenge to           to read the full report. Despite the information density
better understand and better manage the risks of climate          of the report that follows and despite the fact that it can
change to improve and maintain relationships with all its         also be interpreted as an instruction manual, we wish you
stakeholders. Acceptance of this challenge is needed to           pleasant reading.
deliver on ABN AMRO’s purpose “Banking for better, for
generations to come”.

t Previous page                                                                                                      Next page u
4
Benchmarking the financial transition to a Paris-proof economy
Executive Summary
Committed to Paris Agreement No quick fix
ABN AMRO commits to the achievement of a Paris-proof Most readers will think that the above alignment can be
economy by 2030. Paris-proof means that climate-critical easily achieved by ending the relationship with some
sectors need to lower the amount of greenhouse gas clients (exclusion) or by letting loans expire without
emissions and ABN AMRO should align its financial renewal. Although exclusion of economic activities by
exposure to climate-critical sectors in line with the goals of banks can have a great impact, this is not ABN AMRO’s
the Paris Agreement. To enable this transition, ABN AMRO goal. The study of how to align with Paris should not
needs to set concrete and validated reduction targets to be used as a quick fix. ABN AMRO could also keep its
manage financial allocations in its loan and investment exposure amounts to the energy sector in line with the
portfolios. Alignment with the Paris Agreement will not current exposure amounts. For alignment with the Paris
happen automatically. Agreement, the addition of clean production capacity and/
or future decommissioning of less clean capacity is what
ABN AMRO is well on track, but not fully aligned yet matters most. Engagement with existing clients on energy
On the one hand, ABN AMRO is well underway with its transition is an essential part of the recommendations of
energy clients: already 60% of the loans in its energy this report.
portfolio is allocated to renewable (solar and wind) power
generation capacity. On the other hand, this is not yet Next steps
enough for ABN AMRO and its clients to be aligned in the 1. Based on the outcomes of this analysis, ABN AMRO
future with the Paris Agreement. The future expansion of is working towards setting targets aligned with the
cleaner production capacity among clients is the issue that Paris Agreement. ABN AMRO recognises that such
matters most, not where ABN AMRO is today. Continued targets will only be achieved if they lead to emissions
investment in ever cleaner technologies and active reduction.
engagement with energy clients are required towards
2030. 2. ABN AMRO will further develop carbon accounting
skills as a partner of PCAF. This will enable the bank
In the next 10 years, ABN AMRO’s loan exposure to power to move from measuring portfolio alignment with the
generation should change as follows: Paris Agreement towards steering on GHG emission
Financial allocation to renewable power should increase reductions measured in the real world. This means that
from 60% to 65%; ABN AMRO has to measure, report and steer on the
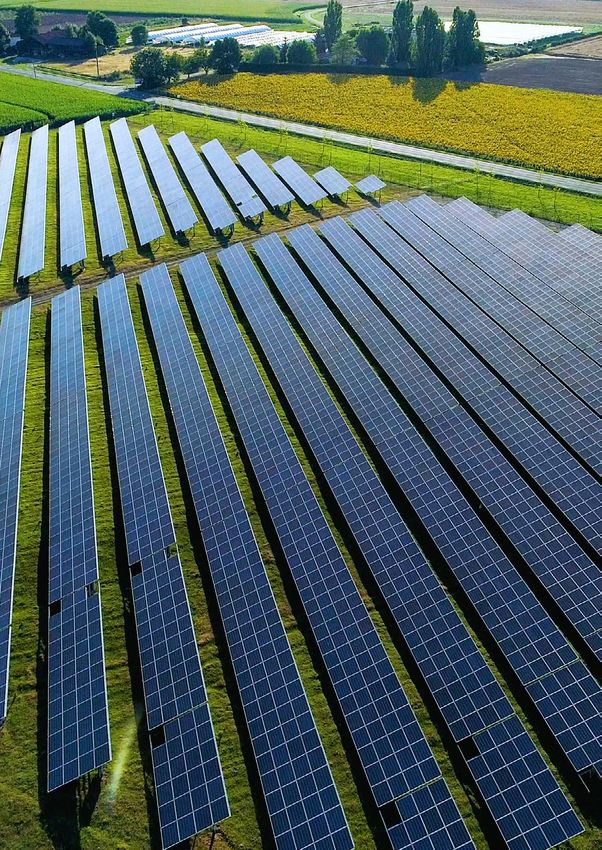
Hydro and nuclear power can remain unchanged at impacts of the bank and its clients.
10% of the financial allocation;
Financial allocation to coal power should drop from 9% 3. ABN AMRO will continue to work with initiatives such
to 6%; as 2DII, energy clients and sector experts to build the
Allocation to gas power should drop from 20% to 17%; real-world evidence that the bank is making a positive
Allocation of the financial exposure to power generated impact. ABN AMRO should use those future findings
from oil should drop below 1%. to increase the efficacy of its actions and to stimulate
growth of Paris-proof economic activities.
We did the same exercise for the bank’s upstream clients.
This report has been produced with the right to copy.
In the next 10 years, ABN AMRO’s loan exposure to
upstream clients should change as follows:
Financial allocation to coal should further drop from 5%
to 2%;
Financial allocation to oil should drop from 53% to
50%;
Allocation to gas can increase from 42% to 47%.
t Previous page Next page u
5

 Benchmarking the financial transition to a Paris-proof economy

            Section 1
            Why

t Previous page                                                   Next page u
6

 Benchmarking the financial transition to a Paris-proof economy

What is the Paris Agreement?                                                      Purpose of collaboration between ABN AMRO and
The Paris Agreement is considered a milestone in                                  2DII
international climate diplomacy. In 2015, at the COP21                            The purpose of the collaboration between ABN AMRO
international climate summit in Paris, the Paris Agreement                        and 2 Degrees Investing Initiative (2DII) on the preparation
was signed by 195 countries to prevent and combat the                             of science-based targets for various parts of ABN AMRO
worst effects of global warming. The parties signing the                          is twofold:
Paris Agreement pledged to take efforts to limit global                           1. Measuring the exposure of ABN AMRO’s corporate
warming to well below 2°C. The Netherlands also signed                                  loan booko to different high and low carbon
and ratified this goal.                                                                 technologies accross several climate relevant sectors
                                                                                  2. Assessing the alignment of the production plans of
Commitment to the Paris Agreement                                                       ABN AMRO’s clients with a scenario in line with the
There are three important steps that connect ABN AMRO                                   Paris Agreement
as a private company to the Paris Agreement:
                                                                                  Footnote: Science-based targets are targets adopted by companies to reduce greenhouse
                                                                                  gas (GHG) emissions. These targets are considered science-based if they are in line with
                                                                                  the level of reduction of GHG emissions required to keep global temperature increase below
   Article 2.1c of the Paris Agreement                                            2°C compared to pre-industrial temperatures, as described in the Assessment Report 5 of
   This is relevant to private companies and banks in                             the Intergovernmental Panel on Climate Change (IPCC).

   particular. Through this article the United Nations
   Framework Convention on Climate Change (UNFCCC)                                Who is 2DII
   process has set a collective goal to adapt finance such                        2 Degrees Investing Initiative (2DII) is an organisation
   that it can successfully address climate change. The                           based in Paris, London, Berlin and New York City. It is
   article sends a strong signal to the finance sector to                         the leading research centre on climate-related metrics
   align portfolios with the Paris Agreement.                                     for financial markets globally, and notably leads most
                                                                                  EU-funded research projects on the topic. It regularly
   Paris climate conference and PCAF                                              produces analysis and policy recommendations on the
   A second important step is that at the 2015 Paris                              topic of financial institutions’ climate disclosures.
   climate conference, ABN AMRO became the
   co-founder of the Partnership for Carbon Accounting                            Taking the Paris alignment of our lending portfolio
   Financials (PCAF). ABN AMRO, together with many                                to a higher level
   other Dutch financial institutions, committed to climate                       The PCAF method is used for reporting on ABN AMRO’s
   improvement by taking the Dutch Carbon Pledge. New                             GHG emissions at portfolio level. As a first step ABN
   participants subscribe to this pledge upon joining the                         AMRO started to report the GHG emissions of its
   PCAF.                                                                          commercial lending exposure (loan book) in 2017. This
   Footnote https://www.abnamro.com/en/newsroom/ press-releases/2018/financial-   corresponds to ABN AMRO’s scope 3 emissions and
   institutions-demonstrateco2- impact.html
                                                                                  is based on the PCAF method. PCAF is a great starting
                                                                                  point for financial institutions worldwide. This study with
   Dutch Climate Agreement                                                        2DII allows ABN AMRO to measure and express how
   The third step took place in 2019 when ABN AMRO                                well the ABN AMRO portfolio and clients align (or do not
   signed up to supporting the Dutch government’s                                 align) with the Paris Agreement. In the next section, you
   climate goals. The Dutch climate goals are aligned with                        can read how this methodology works.
   the Paris Agreement.

   Footnote: https://www.abnamro.com/en/newsroom/newsarticles/2019/abn-amro-
   signs-up-to-dutchgovernments-climate-goals.html

t Previous page                                                                                                                                            Next page u
7

 Benchmarking the financial transition to a Paris-proof economy

            Section 2
            How

t Previous page                                                   Next page u
8

 Benchmarking the financial transition to a Paris-proof economy

Which sectors in this banking pilot were analysed                            What part of the sector value chain was analysed
and why?                                                                     and why?
The results published in this report reflect the alignment                   The reason we chose these specific parts of the value
with the Paris Agreement of ABN AMRO’s exposure to                           chain is that upstream and power generation simply
clients in the power generation and upstream fossil fuel                     impact carbon emissions the most. Another factor is
extraction sector. The analysis is based on the financial                    the excellent availability of asset level data for power
exposure at year-end 2018.                                                   generation and upstream fossil fuel production (see
                                                                             diagram 2 below). In the power sector we avoid double
The results show to what extent total future production of                   counting of GHG emissions by excluding the distribution
the companies in the loan book align with the trajectory to                  and electricity offtakers. In the fossil fuel extraction sector
reach the Paris Agreement’s goals.                                           the same logic applies. Trading, midstream, storage and
                                                                             downstream transport and treatment of fuels all follow the
                                                                             volumes produced in the upstream stage.

Diagram 2. Part of sector value chain in scope of analysis: the green checkmark indicates which part of the value chain is in scope.

    Sector          Climate impact driver                                                                                  Metric
      Oil & Gas      Upstream                 Trading           Midstream              Storage           Downstream          Energy Mix

      Power          Power Generation                        Distribution                  Electricity offtakers              Energy Mix

What is the matching percentage and the amount of                            of the client loan data to the production asset data for
loan book exposure in this 2DII banking pilot?                               a total of 5.7 billion euros in loans. Only if this matching
Data matching is a key activity in the 2DII methodology.                     percentage exceeds 80% can analysis of alignment with
For 87% of ABN AMRO’s exposure to clients in the power                       the Paris Agreement start.
generation sector 2DII was able to match the client and
loan data to the production asset data. This amounts to
a loan exposure of 2.2 billion euros for power generation
clients that was analysed. For ABN AMRO’s exposure to
upstream fossil fuel clients, 2DII was able to match 85%

Diagram 2 bis. Matching percentage of the loan book exposure in scope of analysis

      Sector value chain                    Loan book exposure                   Match percentage by 2DII tooling
                                            (in billions of euros)

      Upstream fossil fuels                 5.7                                  85%

      Power generation                      2.2                                  87%

t Previous page                                                                                                                        Next page u
9

 Benchmarking the financial transition to a Paris-proof economy

The core of the 2DII methodology is the                                         below. The loan allows the client to own and operate
connection between physical assets and financial                                production assets.
instruments                                                               3. Algorithms and manual matching connect loan data
In order to link data to the exposure of ABN AMRO’s                             for every client to the production database. This link
corporate loanbook, 2DII has developed the methodology                          between production capacity and the financial loan
described below. Diagram 1 outlines the data used in the                        also contains forward-looking data on the expansion
analysis:                                                                       of production capacity by our clients. The source
                                                                                for this market data is the Economic Intelligence
1. The first step in preparation of the analysis is gathering                   database provided by Global Data.
     client data of the ABN AMRO loan portfolio for                       4. The last and important step is comparing production
     climate relevant sectors. These sectors where chosen                     capacity associated with each client to a particular
     based on their impact on climate change and their                          emission trajectory and the corresponding warming
     importance for the global transition towards a Paris-                      potential of a scenario trajectory published by the
     proof economy. In the case of this report, our scope                       International Energy Agency (IEA).
     is the loan portfolio for the energy sector.                         5. Once the link between the loan data, production data
2. The loan amount (the money) is disbursed by ABN                              and scenario data is established, the analysis can
     AMRO to the client. The client who uses the money                          start.
     is called the “owning company” in the diagram

Diagram 1. Connecting energy related assets to financial instruments via a Market Intelligence Database

  Linking production capacity to financial loans

                                          LOAN
                                        PORTFOLIO

                                         BANK

                                                                                               FORWARD-LOOKING DATA
                                                                                               ON PRODUCTION CAPACITY
                                         LOAN
                                                                                                 + 100.000 power plants,
                                                                                                 ~ 22.000 oil and gas fields,
                                OWNING COMPANY                                                   ~ 2.000 coal mines

    IEA                  DATA ON PRODUCTION ASSETS
 SCENARIO
                                                                                              Sources: Economic Intelligence Databases from Global Data

t Previous page                                                                                                                              Next page u
10

 Benchmarking the financial transition to a Paris-proof economy

How do ABN AMRO and 2DII measure portfolio                        Measuring financial allocation
alignment with the Paris Agreement?                               In order to accurately study financial allocation of a
To measure alignment with the goals of the Paris                  financial institution’s loan book, the production capacity
Agreement we need a frame of reference for the energy             is weighted according to the size of the loan to the
sector. The International Energy Agency (IEA) has                 client in the loan book. With this weighting technique,
developed such a frame of reference: the Sustainable              a loan of 100,000 euros has less impact than a loan of
Development Scenario (SDS).                                       1 billion euros. The financial allocation data allow banks to
                                                                  measure the alignment of their financial exposure with the
The IEA’s Sustainable Development Scenario offers a               scenarios of the IEA and the Paris Agreement.
pathway for the energy sector where global energy-related
GHG emissions enter a sustained decline to net zero               Explanation of the IEA scenarios used
emissions by 2070. The scenario charts a path for the             For the analysis we used the technology mix scenarios of
energy sector to be aligned with the Paris Agreement by           the International Energy Agency (IEA). These are related to
holding the rise in global temperatures to well below 2°C.        the following temperature ranges of global warming:
It is complemented with a corresponding technology mix
for the energy sector.                                            Above 3.2°C -> CPS = Current Policies Scenario. The
                                                                  Current Policies Scenario is a baseline picture of how
Using market intellegence data to forecast future                 global energy markets would evolve if governments make
installed capacity                                                no changes to their existing policies and measures.
The connection between ABN AMRO’s financial
exposure and the IEA scenarios is made on the basis               2.7°C to 3.2°C -> NPS = New Policies Scenario, now
of 2DII’s allocation method. This method translates               replaced by the Stated Policies Scenario, or STEPS, which
the SDS scenario into targets specific to ABN AMRO’s              is identical in design to the previous NPS. The Stated
loan book. The allocation rule is that all clients provide        Policies Scenario reflects the impact of existing policy
the same proportion of effort relative to their size. The         frameworks and today’s announced policy intentions.
2DII production database includes forward-looking
data for each client in the energy sector. Therefore,             1.75°C to 2°C -> SDS = Sustainable Development
the forecasted production plans of ABN AMRO’s client              Scenario. This IEA scenario charts a path fully aligned
base can be compared to the targets derived from the              with the Paris Agreement by holding the rise in global
SDS sceanrio. This forecast is based on industry expert           temperatures to “well below 2°C and pursuing efforts to
knowledge, market intelligence databases and investor             limit [it] to 1.5°C”
communications, researched and aggregated by Global
Data. In our case for the period 2019 to 2024.                    The Paris Agreement and the probability of outcomes
                                                                  The Paris Agreement calls for an early peak and rapid
                                                                  subsequent reductions in GHG emissions. The SDS policy
                                                                  trajectory is consistent with this. If the scenario plays out,
                                                                  the general economy will decrease its GHG emissions
                                                                  from 33bn tonnes in 2018 to less than 10bn tonnes by
                                                                  2050 and reach net-zero in 2070. The SDS comes with a
                                                                  probability and an uncertainty of outcomes. There is no
                                                                  single party in the world that can achieve the SDS alone.
                                                                  If decision-makers follow the policy trajectory of the SDS,
                                                                  then the temperature rise will be limited to below 1.8
                                                                  °C with a probability of 66%. In the SDS scenario, the
                                                                  probability that the temperature will be limited to below
                                                                  1.65 °C is 50%. For some time the IEA has been working
                                                                  on developing scenarios towards and below 1.5°C. Long
                                                                  awaited by the environmental and energy community.
More and more professions measure, analyse and                    It is good to realize that any IEA scenario is subject to
forecast non-financial data for decision-making                   probabilities of outcomes that are below 100%.

t Previous page                                                                                                      Next page u
11
Benchmarking the financial transition to a Paris-proof economy
2DII compares client data to the IEA scenario Diversity plays a crucial role in energy supply security, the
For each client 2DII calculates the technology mix, based efficiency of energy use and production, and the ability
on the production capacity data in the 2DII production of our energy system to transition to new technologies.
database. Below are two sample data sets that originate The client level technology mix gives a good overview of
from the analysis. These illustrations show that the the distribution of production capactity across low and
percentages for each technology in the technology mix of high carbon technologies. This also gives a first indication
most clients differ. It is the technology mix of an individual to ABN AMRO of which companies it needs to engage
client that steers the degree of alignment to the IEA with first. The next step is to compare the forward-looking
scenario of the client exposure. The IEA scenarios allow production plans to the trends of the IEA’s scenarios.
a diversity of installed technologies. This possibility to
diversify the technology mixes is important to our clients.
Illustration 1. An anonymised sample of technology mixes of power generation projects and companies
Company A
Company B
Company C
Company D
Company E
Company F
Company G
Coal Gas Hydro Nuclear Oil Renewables (Solar, Wind)
Illustration 2. An anonymised sample of technology mixes of upstream projects and companies
Company AA
Company BB
Company CC
Company DD
Company EE
Company FF
Company GG
Coal Gas Oil
t Previous page Next page u12
Benchmarking the financial transition to a Paris-proof economy
Further considerations when working with the 2DII results. This is because, among these three analysed
methodology technologies for upstream clients (oil, gas and coal), there
are no renewable alternatives available within this 2DII
Sectoral in-depth knowledge of all energy related analysis.
technologies remains a key asset.
Both renewables and fossil fuels will remain relevant for Power generation is a regional market and this is
years to come. Therefore broad energy sector knowledge reflected in the methodology
remains essential while working on the decarbonisation As the power generation market is a regional market,
of our economies. To achieve truly sustainable energy the IEA scenario data for power generation is used at a
portfolios, in-depth sector knowledge across all existing regional rather than at a global level. A global target is
technologies and the focus on innovation remains then constructed from regional targets by aggregating
essential. them using the same regional distribution as the loan
portfolio clients. The location/geography of the power plant
Carbon capture and storage not in this analysis. determines which regional scenario is used. An example
The IEA uses carbon capture and storage in its scenarios. of regional difference in targets is whether a power plant
Carbon capture and storage are not mature technologies. is in an OECD or a non-OECD country. This difference
Due to the experimental phase of testing these solutions, determines the required change to meet the SDS scenario
carbon capture and storage do not yet play a role in this for these countries. These required changes at power
analysis. plant level are aggregated to the company and then to
the loan portfolio to determine the overall change in
Role of gas in 2DII analysis and IEA scenarios. production capacity that is required. The reason is that the
Gas is considered a transition fuel in the IEA energy power sector is regionally distinct.
scenarios used by the 2DII analysis. This is reflected in
the outcomes presented in the analysis. In the short run Upstream fossil fuels are part of a global market
the 2DII analysis outcomes for power generation clients For the upstream fossil fuel sector, global IEA targets are
focus on reduction of coal power and the increase of used to determine the target production for each
power from renewables by 2024. Electricity generated technology.
from gas contributes to GHG emissions and is considered
a transition solution in all IEA scenarios. For an analysis Proportion of effort for companies
with a time horizon longer than 5 years, gas definitely For high-carbon technologies (oil, gas and coal) companies
comes into the picture as a contributor to GHG emissions. are expected to provide the same proportion of effort
In the short run the analysis outcomes for upstream fossil relative to their own size in the sector. For low-carbon
fuel clients focus primarily on reduction of coal and oil in technologies (hydro, renewables and nuclear) the required
favour of gas. Gas is used as a substitution for oil and coal effort is expressed as a function of the initial total capacity
in the SDS target for the upstream portfolio. However, to in the sector. To align with Paris, a company’s low-carbon
limit the contribution of fossil fuels to global warming, our capacity build-out target is relative to the size of its
economies need to reduce the GHG emissions of all the total capacity and not just to the size of its low-carbon
fossil fuels that we use. This includes the GHG emissions capacity. This prevents that an historical laggard, with a
from gas. In the medium to long term cleaner alternatives marginal current amount of low-carbon capacity, could be
to the use of gas will become more available and more Paris aligned with a limited absolute low-carbon capacity
affordable. The role that gas plays can be replaced by increase.
biogas, geothermal solutions, electrification, renewable
energy storage, green or blue hydrogen, biofuels, 2DII methodology publication expected soon
synthetic fuels and other innovative technologies. More details on 2DII’s methodology can be found on the
2DII website. This document is expected to be issued
Analysis of power generation and upstream is in Q2 2020.
different
The analysis for upstream fossil fuel extraction is
fundamentally different from the power generation sector
t Previous page Next page u13
Benchmarking the financial transition to a Paris-proof economy
Section 3
What | the result
t Previous page Next page u14
Benchmarking the financial transition to a Paris-proof economy
Results section for power generation clients
Graph 1. Technologies weighted for size of ABN AMRO‘s loan book exposure per power generation client.
SDS Portfolio Target 2029 1%
2029 6% 17% 5% 6% 65%
SDS Portfolio Target 2024 1%
2024 8% 19% 4% 6% 73% 62%
Portfolio starting point 3% 1%
2019 9% 20% 7% 60%
Coal Gas Hydro Nuclear Oil Renewables (Solar, Wind)
ABN AMRO’s financial allocation accross technologies in Analysis Outcomes
the power sector is mostly allocated to renewable power The analysis outcomes are forward-looking from our
generation technologies (see Graph 1). In simple terms, starting point of 2019 towards 2024 and 2029. The analysis
this means that ABN AMRO allocates more exposure to outcomes show how ABN AMRO’s financial exposure
those companies and projects that have already developed should evolve in order to be aligned with the SDS over the
renewable energy generation capacity. Graph 1 is a next 10 years, by the end of 2029. There is also the SDS
snapshot, and whether the companies currently present in target by 2024 as an intermediate step.
the loan portfolio will further develop renewable capacity
is shown in Graph 2 on the next page. Alignment with the By 2029:
Paris Agreement can only work if the expansion plans and Financial allocation to renewables power generation
targets of ABN AMRO’s energy clients become cleaner should increase by an additional 5% in the loan
and are aligned with the rate of change required by the portfolio, from 60% to 65%.
Paris Agreement. Financial allocation to oil power should decrease to
below 1%, the end result is too minimal to be easily
How to read the graph observed in the graph.
The 2019 bar at the bottom shows how ABN AMRO’s The fact that nuclear capacity decreases in the financial
financial exposure is distributed across the different allocation from 7% to 6%, does not mean that there
technologies, weighted for the size of ABN AMRO‘s are no capacity additions planned for this technology.
credit exposure per power generation client. The Since the capacity build out of nuclear capacity
shown energy mix represents the energy mix of ABN takes more time, it increases at a slower rate than
AMRO’s clients in the power sector, weighted by the renewables do, for example. Hence nuclear’s share
outstanding loan exposure. in the financial allocation decreases by 1 percentage
The 2024 and 2029 bars at the top show the financial point.
allocation targets for ABN AMRO’s loan exposure in Hydro capacity build out should be sufficient to
2024 and 2029, in accordance with the Sustainable increase the share of hydro power by 1% in the
Development Scenario (SDS) of the IEA. More weightings of the loan portfolio.
specifically, it shows ABN AMRO’s exposure to these Financial allocation to coal and gas power should drop
technologies as they are set on a SDS pathway. in the weighting of the loan portfolio by 3% each by
2029.
t Previous page Next page u15
Benchmarking the financial transition to a Paris-proof economy
Rate of change for installed power generation Rate of change for installed coal power generation
capacity capacity
In the below graphs we look at the rate of change for Although Graph 2 shows that ABN AMRO clients will
renewable power capacity and coal power capacity of not open new coal-fired plants, it also shows that the
ABN AMRO clients. rate of change for coal power capacity is not on the SDS
trajectory, since this would require decommissioning
Rate of change for installed renewable power of coal plants by 2024. In the coming five years ABN
generation capacity AMRO will continue engagement with mainstream
Graph 2 shows that the rate of change for installed power generation clients, particularly on coal-fired power
renewable power generation capacity is not on the SDS generation. This engagement aligns with the IEA’s call for
trajectory. Even more so, the planned capacity increase accelerated global decommissioning of coal-fired plants.
seems to stagnate from 2021 onwards. For alignment
with the SDS trajectory, current market intelligence shows
a lack of announcements for renewable projects by ABN
AMRO power clients beyond 2021.
Graph 2. Rate of change for renewables and coal for power generation clients compared with IEA scenarios.
Coal Power Generation Renewables Power Generation
120%
20%
Per cent Change in Total Volume (%)
Per cent Change in Total Volume (%)
15% 80%
10%
5% 40%
0%
0%
2019 2024 2019 2024
Year Year
1.75°C - 2°C 2°C – 2.7°C 2.7°C – 3.2°C ≥ 3.2°C ABN AMRO Power Clients
General Economy
t Previous page Next page u16 Science-based targets for Energy Loans - Benchmarking the financial transition to a Paris-proof economy t Previous page Next page u
17
Benchmarking the financial transition to a Paris-proof economy
Results section for upstream clients
Graph 3. Technologies weighted for size of ABN AMRO‘s loan book exposure for upstream
SDS Portfolio Target 2029
2029 50% 47% 3%
SDS Portfolio Target 2024
2024 52% 42% 5%
Portfolio of ABN AMRO
2019 53% 42% 5%
Oil Gas Coal
How to read the graph Analysis Outcomes
The YE 2018 starting point bar shows the financial The analysis outcomes are forward-looking from our
allocation weighted for the size of ABN AMRO‘s credit starting point in 2019 towards 2024 and 2029. How should
exposure per client active in upstream fossil fuel ABN AMRO’s financial exposure evolve to be aligned with
extraction. the SDS over the next 10 years, by end of 2029? There is
The 2024 and 2029 SDS target bars show the targets also the SDS target by 2024 as an intermediate step.
for ABN AMRO’s loan exposure in 2024 and 2029, By 2029:
in accordance with the Sustainable Development Oil should drop in the weighting of the loan portfolio by
Scenario (SDS) of the IEA. 3%.
Coal should drop in the weighting of the loan portfolio
by 2%.
Gas can increase by 5% in the financial allocation. Gas
is the transition fuel in this scenario, because of its
lower GHG emission factor.
t Previous page Next page u18
Benchmarking the financial transition to a Paris-proof economy
Rate of change for installed oil extraction capacity the Sustainable Development Scenario trajectory. This
For oil production ABN AMRO oil clients grow their decrease accelerates from 2021 onwards.This accelerated
production capacity at a faster rate than the general reduction of coal mining activity is important for global
economy. This is not in alignment with SDS. Only in 2024 warming scenarios. Coal as a combustion fuel scores
does their rate of change start to align with the NPS. The highest as a contributor to the increase in the earth’s
global economy’s oil production is also expected to grow surface temperature. In 2018, the IEA assessed that
over the next 5 years. the impact of CO2 emitted from coal combustion was
responsible for over 0.3°C of the 1°C increase in global
Rate of change for installed coal mining capacity average annual surface temperatures above pre-industrial
Graph 4 shows that the production capacity of ABN levels. This makes coal the single largest source of global
AMRO coal mining clients decreases and moves towards temperature increase.
Graph 4. Rate of Change for Upstream Oil and Coal clients
Oil Coal
5%
Per cent Change in Total Volume (%)
Per cent Change in Total Volume (%)
5%
0%
2.5%
-5%
0%
-10%
2019 2024 2019 2024
Year Year
1.75°C – 2°C 2.7°C – 3.2°C ≥ 3.2°C ABN AMRO Upstream Clients
General Economy
Discussion of results for upstream This means that for financial institutions there are
The 2DII analysis measures the volumes of fossil fuels three main ways to achieve alignment with the SDS for
in barrels of oil, cubic metres of gas and metric tonnes upstream fossil fuels:
of coal. To make the charts, these annual production 1. Reduce financial exposure to upstream fossil fuel
volumes are converted to a common measure of energy: extraction.
gigajoules. To better limit global warming, the total amount 2. Find new clients and increase financial exposure to
of fossil fuels should be monitored and go down over companies transitioning their business models from
time. Decision makers should ensure that the transition to fossil fuel extraction towards renewable energy
a cleaner technology mix of new and existing clients is not storage, green or blue hydrogen, biofuels, synthetic
outdone by growing volumes of fossil fuels. fuels and electrification.
3. Engage with existing clients to transition to a cleaner
technology mix.
In the conclusion and recommendations, we outline this
further in the decision tree for decision makers.
t Previous page Next page u19
Benchmarking the financial transition to a Paris-proof economy
Section 4
Recommendations
Conclusion and Recommendations:
Decision tree for decision makers Do the financial analysis to benchmark
the loan book with a Paris Agreement
aligned scenario (e.g. SDS)
Action to take if the client’s
production capacity is aligned Do analysis
with the SDS Action to take if the client portfolio
is not aligned with the SDS
Aligned with SDS NOT Aligned with SDS
Monitor clients Find new Reduce Engage with
clients exposure existing clients
Monitor clients and track Find new clients with
capacity build of clients Reduce exposure to Engage with existing
a technology mix and clients to discuss
to ensure technology clients that have a
production capacity timelines on the transition
and production capacity technology mix not
that align with the SDS to cleaner technologies
alignment with SDS aligned with SDS
t Previous page Next page u20
Benchmarking the financial transition to a Paris-proof economy
Conclusion and decision tree A further recommendation is that the outcomes of
To be able to make this report, 2DII analysed the installed the 2DII analysis are not a one-way street towards the
capacity and technology mix for ABN AMRO clients in the exclusion of clients. The outcomes are meant to nudge,
power generation and upstream fossil fuels sector. The push or accelerate the energy transition, not to shift
result is twofold: the financial burden to other parties. The outcome of
The role of the bank is analysed by comparing the this analysis forms an important step towards a better
financial allocation with the SDS scenario (Graphs 1 understanding by the financial industry of how to set
and 3). science-based targets for energy-related loans. Although
The role of individual clients is analysed by comparing exclusion of economic activities by banks can have a
the capacity build out of clients over a period of 5 years great impact, it is not the goal of this analysis. The study
with the various IEA scenarios (Graphs 2 and 4). of alignment with the Paris Agreement should not be
used to polish portfolios without any form of engagement
In both cases the analysis outcomes that are made with existing clients. This analysis is not a quick fix.
available allow decision makers to align their financial Therefore, engagement with existing clients on energy
allocation with the Sustainable Development Scenario transition is an essential part of the decision tree in the
(SDS) and the Paris Agreement. recommendation section. Decision makers will always
need to assess and measure the real world impacts of
The outcomes of the analysis show how the selection of their decisions.
individual clients and projects in power generation and
FOOTNOTE: Science-based targets are targets adopted by companies to reduce greenhouse
upstream fossil fuels make a difference in the degree of gas (GHG) emissions. These targets are considered science-based if they are in line with
the level of reduction of GHG emissions required to keep global temperature increase below
alignment with the Paris Agreement. After all, the installed 2°C compared with pre-industrial temperatures, as described in Assessment Report 5 of the
production capacity of individual clients is cleaner or less Intergovernmental Panel on Climate Change (IPCC).
clean.
The client data generated through the 2DII analysis
A recommendation for decision makers is to take the contributes to the growing body of knowledge on
steps in the decision tree above. It gives simple and non-financial data. For the energy transition to succeed,
effective guidance to decision makers on how to take this type of analysis can steer decision making in financial
action to steer the portfolio in line with the SDS. For institutions across the globe to reduce GHG emissions
companies like ABN AMRO this 2DII analysis is also a linked to their financial portfolios.
great step towards the formulation of science-based
targets. Active management of financial portfolios in line with
the Paris Agreement can help avoid the most negative
outcomes of climate change.
t Previous page Next page u21
Benchmarking the financial transition to a Paris-proof economy
Section 5
Useful Resources
t Previous page Next page u22 Benchmarking the financial transition to a Paris-proof economy Useful resources The 2° Investing Initiative (2DII) has helped more than 200 financial institutions worldwide on energy-related analysis in relation to climate outcomes. This makes 2DII the leading research centre on climate-related metrics and the preparation of Paris Agreement alignment. https://2degrees-investing.org/ our-research/ The International Energy Agency (IEA) works with countries around the world to shape energy policies for a secure and sustainable future. Please consult the available “2°C scenarios” developed by IEA. These scenarios are in line with the level of CO2 reduction required to keep global warming well below two degrees. https://www.iea.org/topics/world-energy-outlook Global Data warrants the availability of excellent market intelligence on the global energy sector. The databases supplied by Global Data contain non-financial data such as the installed capacity, production volumes and the technology mix of energy-related companies. https://www.globaldata.com/industries-we-cover/power/ https://www.globaldata.com/industries-we-cover/mining/ https://www.globaldata.com/industries-we-cover/oil-gas/ The Partnership for Carbon Accounting Financials, which measures and discloses the GHG emissions associated with the lending and investment activities of financial institutions is a foundation designed to create transparency and accountability, and to enable financial institutions to align their portfolios with the Paris Climate Agreement. The PCAF paper launched at COP25 in Madrid can be downloaded here: https://carbonaccountingfinancials.com/newsitem/ dutch-pcaf-group-presents-2019- report-in-cop25-madrid#newsitemtext The Science Based Targets initiative is a partnership between CDP, UN Global Compact, WRI and WWF. ABN AMRO is one of the financial institutions taking action in order to set science- based targets for various parts of its business. https://sciencebasedtargets.org/ t Previous page Next page u
23

 Benchmarking the financial transition to a Paris-proof economy

            Section 6
            Right to Copy &
            Acknowledgements

t Previous page                                                   Next page u
24
Benchmarking the financial transition to a Paris-proof economy
The right to copy This document has been generated and produced by a
ABN AMRO and 2DII are encouraging financial players sustainability advisor from Strategy & Sustainability in
across the world to follow suit (‘right to copy’) – by cooperation with a data scientist from the 2DII and a
publishing this report, we stimulate transparency of number of contributors as mentioned below. Strategy
reporting to prepare for target setting in line with the Paris & Sustainability prepares documents that contribute
Agreement to a clearer understanding of banking for all the bank’s
stakeholders: clients, employees, investors and society at
Crucially, 2DII delivers open-source tools and frameworks. large.
All codes developed by 2DII are publicly available on
GitHub. The data used to develop this report has been obtained
from ABN AMRO and was enriched and analysed with
As policymakers and the private sector seek to build 2DII tooling. All data used a projection to the year 2019
standards and common approaches for climate scenario based on Q4 2018 asset-level data. AA and 2DII have
alignment, a non-commercial business model is aimed to use reliable data sources, and have taken care to
imperative to avoid commercial biases. The grant-funded present results with accuracy and completeness, based
business model of the 2DII allows financial institutions and on the highest matching levels achievable. Nevertheless,
other users to minimise their costs of measurement and future analysis will be subject to further data quality
to focus their resources on taking the required portfolio improvements.
management actions.
Neither AA nor other persons shall be liable for any
ABN AMRO Bank N.V., with registered office at Gustav direct, indirect, special, incidental, consequential,
Mahlerlaan 10, 1082 PP Amsterdam, Netherlands (AA), punitive or exemplary damages, including lost profits
is responsible for the production and dissemination of arising in any way from the information contained in
this document, which has been prepared by individuals this communication. This document is not intended for
working for AA and the 2DII whose identity is mentioned distribution to, or use by any person or entity in any
in this document. jurisdiction where such distribution or use would be
contrary to local law or regulation.
Authors
Jan Raes – Global Sustainability Advisor – ABN AMRO Strategy & Sustainability
Daan Koopman - Data scientist - 2° Investing Initiative
Contributors
Klaus Hagedorn - Senior Analyst - 2° Investing Initiative
Karianne Tieleman, Carolien Peeters, Petra Gibcus, Victor Amankwah, Siert van Kemenade, Robert Hoekstra – ABN AMRO
Thanks to
Arnold Mulder, Hans van Cleef, Sandra Phlippen, Marieke Abcouwer, Tjeerd Krumpelman , Catalina Hemmink, Eve Zoma – ABN AMRO
Marcel Beukeboom - Climate Envoy of the Kingdom of the Netherlands - Preface
Liam Rozing - Liam Rozing Fotografie - photo of Jan Raes
Dedicated to all climate and energy nerds: always remember that the people who are crazy enough to think they
can change the world, are the ones who actually do.
t Previous pageYou can also read