The Contagion Effect from U.S. Stock Market to the Vietnamese and the Philippine Stock Markets: The Evidence of DCC - GARCH Model
←
→
Page content transcription
If your browser does not render page correctly, please read the page content below
Thao Phan Thi Dieu LE, Hieu Luong Minh TRAN /
                                          Journal of Asian Finance, Economics and Business Vol 8 No 2 (2021) 0759–0770                                     759

Print ISSN: 2288-4637 / Online ISSN 2288-4645
doi:10.13106/jafeb.2021.vol8.no2.0759

     The Contagion Effect from U.S. Stock Market to the Vietnamese and the
       Philippine Stock Markets: The Evidence of DCC – GARCH Model

                                                      Thao Phan Thi Dieu LE1, Hieu Luong Minh TRAN2

                              Received: November 05, 2020                    Revised: December 30, 2020 Accepted: January 15, 2021

                                                                                        Abstract
Using a DCC – GARCH model analysis, this paper examines the existence of financial contagion from the U.S. stock market to the
Vietnamese and the Philippine stock markets during the global financial crisis and the COVID-19 pandemic crisis. We use daily data from
the S&P 500 (U.S.), VN-Index (Vietnam), and the PSEi (the Philippines). As a result, there is no evidence of contagion from the U.S stock
market to the Philippine stock market that can be found during global financial crisis, while the Vietnamese market is influenced by this
effect. Besides, both these developing stock markets (the Vietnamese and Philippine stock markets) are influenced by the contagion effect
in COVID-19 pandemic crisis. Another finding is that the contagion effect during the coronavirus pandemic crisis in Vietnam is smaller
than that during the global financial crisis, however, the opposite is the case for the Philippines. It is noticed that the Philippines seems to
be more affected by the contagion effect from the COVID-19 pandemic than Vietnam at the time of this study. Because financial contagion
is important for monetary policy, asset pricing, risk measurement, and portfolio allocation, the findings in this paper may give some useful
information for policymakers and investors.

Keywords: Contagion, COVID-19, Financial Crisis, DCC – GARCH, Stock Market

JEL Classification Code: C58, G01, G15

1. Introduction                                                                                  on other markets around the world. These co-movements
                                                                                                 of different nations in financial markets may arise from
    Over a decade ago, financial markets suffered from the                                       contagion or interdependence between financial markets
global financial crisis triggered by a downturn of the U.S.                                      (Celik, 2012).
subprime mortgage market. The global financial crisis                                                In the beginning of 2020, the coronavirus has appeared,
exposed weaknesses that existed in financial industry                                            and caused a worldwide pandemic. Since the COVID-19
regulations and the financial systems all over the world                                         pandemic has been declared as global health emergency
(Mighri & Mansouri, 2013). Not only the value of U.S stock                                       by the World Health Organization, the world economy
price decreased, but also the stock price of other countries                                     has suffered heavy losses. Due to COVID-19 pandemic,
went down during crisis period. These cases imply that                                           customers have changed their consumption behavior,
movements in one stock market may have a powerful impact                                         which has led to a decline in sales and production; hence,
                                                                                                 companies have fallen into severe financial burdens, and the
                                                                                                 unemployment rates rose worldwide. Such serious changes
                                                                                                 in business and economy around the world are expected to
 First Author. Associate Professor, Faculty of Finance, Banking
1                                                                                               affect stocks. From an investment perspective, it is necessary
 University of Ho Chi Minh City, Vietnam. Email: thaolptd@buh.edu.vn                             to assess the impact of the COVID-19 pandemic on the
 Corresponding Author. Banking University of Ho Chi Minh City,
2
                                                                                                 stock market. The purpose in doing this is to determine
 Vietnam [Postal Address: 36 Ton That Dam Street, Nguyen Thai
 Binh Ward, District 1, Ho Chi Minh City 700000, Vietnam]                                        complexity traits of the stock market before and during the
 Email: tranluongminhhieu@gmail.com                                                              COVID-19 Pandemic.
                                                                                                     Financial volatility has been impacted by many different
© Copyright: The Author(s)
This is an Open Access article distributed under the terms of the Creative Commons Attribution   reasons. According to Becketti and Sellon (1989), there are
Non-Commercial License (https://creativecommons.org/licenses/by-nc/4.0/) which permits
unrestricted non-commercial use, distribution, and reproduction in any medium, provided the
                                                                                                 many factors that cause changes in financial volatilities
original work is properly cited.                                                                 such as increasing in inflationary expectations, restricting
Thao Phan Thi Dieu LE, Hieu Luong Minh TRAN /
760 Journal of Asian Finance, Economics and Business Vol 8 No 2 (2021) 0759–0770
monetary policy, and the elimination of interest rate ceilings market to the Vietnamese and the Philippine stock markets
which led to the volatility of interest rates. The collapse of during the period of COVID-19 pandemic, compared with
stock prices in the year 1997 also contributed to an increase during the global financial crisis.
in volatility of interest rates and exchange rates (Ezzati,
2013). This is a phenomenon that had received attention of 2. Literature Review
many investors and financial market analysts.
Contagion is one of the definitions debated most in Worthington and Higgs (2004) explore the causes
literature. In this paper, contagion is defined based on and extent of contagion of volatility in three developed
the definition of Forbes and Rigobon (2002), which is a Asian stock markets in Hong Kong, Japan, and Singapore
significant rise in the cross-market correlation during the and six emerging markets in Indonesia, Korea, Malaysia,
crisis period. Hence, it is essential that the correlation between the Philippines, Taiwan, and Thailand using MGARCH
two financial markets should be compared in relatively model. The results of the study demonstrate the existence
stable period (pre-crisis) and turmoil period (crisis period). of contagion effects and show the volatility of all markets,
If two markets are moderately correlated during stable especially for developing markets. However, the volatility
periods and the appearance of a shock to one market leads of these markets is largely determined by the historical data
to a dramatic increase in market co-movement, this would itself rather than by the influence of external shocks.
create contagion. Nevertheless, if the correlation between Chiang et al. (2007) apply the DCC – GARCH model
two markets is traditionally high, even if its correlation to analyze the contagion effects of volatility across
continues to soar after one market experiences an economic nine stock markets in Asia from 1990 to 2003 using the
shock, this may not generate contagion (Celik, 2012). In historic stock prices of these markets along with daily.
other words, contagion only appears if the cross-market Research results demonstrate that there are the contagion
correlation goes up significantly in the period of crisis. If there effects between observing markets. Chiang et al. (2007)
is not a significant increase in correlation, this co-movement examine a series of correlation coefficients in order to
between financial markets is called interdependence that find out two periods of the Asian crisis: the first period
refers to strong real linkages between two economies shows an increase in the correlation (contagion) and the
(Forbes & Rigobon, 2002). Although the contagion effects second period shows that the correlation continues to rise.
among developed markets or to developing markets have In addition, the results also indicate that variance values
been confirmed in several papers (Calvo & Mendoza, 2000; have changed during the crisis period, leading to doubts
Bekaert et al., 2005; Chiang et al., 2007; Cho & Parhizgari, as to whether diversifying international portfolios is truly
2008; Bouaziz et al., 2012; Celik, 2012; Alam et al., 2020; beneficial or not.
Khan et al., 2020; Alshammari et al., 2020), to the best of Horta et al. (2008) examine contagion effects of American
authors’ knowledge, the previous study has not explored subprime mortgage crisis on Italian, UK, French, German,
the contagion effects of volatility return from a developed Canadian, Japanese, and Portuguese stock exchange markets
market like U.S. stock market to the Vietnamese stock by using copula models. As a result, while Canada, Japan,
market and the Philippine stock market in both the global Italy, France and UK get remarkable contagion impact, this
financial crisis, and the COVID-19 pandemic, and then, has impact for Germany is not significant as other countries.
compared the results between these two crises. The most contagion influence is found out in Canadian
Vietnam and the Philippines are developing countries stock market.
which are assessed as having remarkable economies in Mulyadi (2009) tests the contagion effects of volatility in
Southeast Asia. According to World Intellectual Property U.S, Indonesian and Japanese capital markets for five years
Organization (2019), both Vietnam and the Philippines (2004–2008). By using and exploiting the GARCH model
ranked as lower-middle income countries which have the (1, 1), the results show that the contagion effect between
innovation performance of economy above expectations for Indonesia and Japan is bidirectional, while that between
their level of development. Moreover, thanks to participating Indonesia and the U.S. has a one-way spread effect, namely
in the Association of Southeast Asian (ASEAN), the from the U.S. to Indonesia.
Asia-Pacific Economic Cooperation (APEC), and the World Naoui et al. (2010) examine the existence of contagious
Trade Organization (WTO), Vietnam and the Philippines phenomenon following the U.S. financial crisis for six
have become more integrated with the world economy. It developed stock markets and ten emerging stock markets
also means that their stock markets are more closely related by using Dynamic Conditional Correlation model
to the global financial markets. Because of the reasons (DCC – GARCH). They prove that the contagion effect is
stated above, this paper uses the DCC – GARCH model in very strong between the United States and the developed and
order to examine the contagion effect from the U.S. stock developing countries over the subprime crisis.Thao Phan Thi Dieu LE, Hieu Luong Minh TRAN /
Journal of Asian Finance, Economics and Business Vol 8 No 2 (2021) 0759–0770 761
Figure 1: Stock market price series
Sok-Gee et al. (2010) measure the contagion effects correlations between these markets have dramatically rose
of volatility from the U.S. and Japanese stock markets to during the U.S. financial crisis period. Bouaziz et al. (2012)
the stock markets of Southeast Asian countries including conclude that this crisis has spread across different stock
Indonesia, Malaysia, the Philippines, Singapore, and markets, which is also a reliable evidence of contagion.
Thailand during the post-crisis period of the Asian financial Celik (2012) examine the existence of the contagion
crisis in 1997. They use the historic returns data of the effect between the U.S. foreign exchange market and
observed markets from March 1, 1999, to December 31, the foreign exchange markets of nine developed and ten
2007, and apply the EGARCH model for this article. The emerging countries during the 2007-2008 global financial
result shows that in terms of returns volatility, the contagion crisis. According to the analysis of the DCC – GARCH
effects from Japan to the stock markets of Southeast Asian model, Celik (2012) demonstrates that there is a spread of
countries is proven to be weaker than that effects from the returns volatility from the U.S. market to most the developed
U.S. market. and emerging markets. In addition, emerging markets
Hwang et al. (2010) analyze the contagion effects of the in Malaysia, China, and Brazil are affected the most by
U.S. financial crisis on 38 international stock markets using this effect.
a DCC – GARCH model. In summarize, they prove that Jones and Olson (2013) examine the time-varying
financial contagion appears not only in emerging markets correlation between macroeconomic uncertainty, inflation,
but also in developed markets over the U.S. subprime crisis. and output. As a result of DCC – GARCH analysis, there
Bouaziz et al. (2012) examine the contagion effect of was a change from negative to positive in terms of the sign
the U.S. stock market on the stock markets of developed of the correlation between inflation and macroeconomic
countries in the 2007-2008 financial crisis by applying uncertainty over the late 1990s, whereas the correlation
DCC – GARCH model. As a result, they observe that between uncertainty and output has consistently negative.Thao Phan Thi Dieu LE, Hieu Luong Minh TRAN /
762 Journal of Asian Finance, Economics and Business Vol 8 No 2 (2021) 0759–0770
Balli et al. (2015) evaluate the contagion effects from In the literature, it is very difficult to determine the crisis
developed stock markets to 20 emerging stock markets, period (Kaminsky & Schmukler., 1999). With regard to the
which are in the Middle East, Asia and North Africa determination of crisis period for the global financial crisis,
(MENA) during the period from 2000 to 2013. The financial Dominguez et al. (2012) prove that this crisis started on
markets of the United States, Europe and Japan were seen October, 1st 2007, so the authors also choose that date as a
as developed markets. The GARCH (1, 1) model is used starting date of crisis. It means that for the 2007–2008 global
in order to measure the spread of this economic shock to financial crisis, pre-crisis period covers data from 03/01/2005
the emerging markets. The result of the study show that to 30/09/2007, and crisis period covers between 01/10/2007
there is the existence of contagion effects from developed to 31/12/2009. As far as the identification of crisis period for
stock markets, especially the U.S. market, to emerging the COVID-19 pandemic crisis, the authors refer to consider
stock markets. news-based data for determining that period. It is reported that
Nguyen and Le (2018) examine return spillover from the the global stock markets dropped significantly on February,
U.S. and Japanese stock markets to the Vietnamese stock 24th 2020 owing to a dramatic increase in the number of
market from January 1, 2012, to December 31, 2015 by using COVID-19 cases outside China (McLean et al., 2020; Carrick,
a frequency-domain analysis. A Granger-causality test is 2020); thus, in the existing literature, the authors observe
applied in order to examine the return spillover, and the test for that the COVID-19 pandemic crisis givers the first signal on
causality in the frequency domain by Breitung and Candelon 24 February 2020, and this date is also used as starting point of
(2006) is used to evaluate the return spillover at various crisis period. While the period from 03/09/2019 to 23/02/2020
frequencies. The results reveal that there is a significant is considered as the pre-crisis period, the period between
return spillover appearing from the U.S. to the Vietnamese 24/02/2020 and 30/06/2020 is considered as the crisis period.
stock market at all frequencies and from the Japanese to the However, at the time of this study, the COVID-19 translation
Vietnamese stock market at higher frequencies. In addition, is not over. Therefore, the results of this study are only relative.
Nguyen and Le (2018) also prove that return spillover effects
are not the same at different frequencies. 4. Methodology
The literature on contagion effects of financial crisis
seems to be studied in the stock market mainly. This paper 4.1. DCC – GARCH Model
aims to test the existence of financial contagion between
for stock markets of the U.S and two developing stock In this paper, DCC – GARCH model of Engle (2002) is
markets in ASEAN (Vietnam and the Philippines) during applied to examine the existence of contagion effects during
the COVID-19 pandemic crisis, compared with during the the COVID-19 pandemic crisis and the global financial crisis.
2007-2008 financial crisis. It also makes several essential A great benefit of using this model is to find out possible
contributions to the recent literature on financial contagion. changes in conditional correlation over time, allowing us to
detect dynamic investor behavior in response to news and
3. Data innovation (Celik, 2012). Furthermore, the measurement
method of dynamic conditional correlations is suitable in
The authors use daily data from the Standard & Poor’s order to explore possible contagion effects because of herding
500 Composite Index (S&P 500), Vietnam Stock Index behavior in developing financial markets during the period of
(VN-Index) and Philippine Stock Exchange Composite crisis (Chiang et al., 2007; Syllignakis & Kouretas, 2011). In
Index (PSEi) representing the U.S., Vietnamese and the addition, using DCC – GARCH model can be advantageous
Philippine stock markets, respectively. The data is collected to measure correlation coefficients of the standardized
at Thomson Reuters DataStream from 03/01/2005 to residuals and so account for heteroscedasticity in a direct way
31/12/2009 and from 03/09/2019 to 30/06/2020. These are (Chiang et al., 2007). Owing to the procedural adjustment
two periods in which two crises occur, the global financial of volatility, the time-varying conditional correlation (DCC)
crisis and the COVID-19 pandemic crisis. If database is does not have any bias from volatility. Being not similar
unavailable because of public holidays or any other reason, to the volatility-adjusted cross-market correlations that are
the value of stock prices will be assumed based on data of the employed in Forbes and Rigobon (2002), the correlation
for the time-varying volatility is continuously adjusted by
previous trading days by Stata statistical software.
DCC – GARCH model. Therefore, DCC provides a super
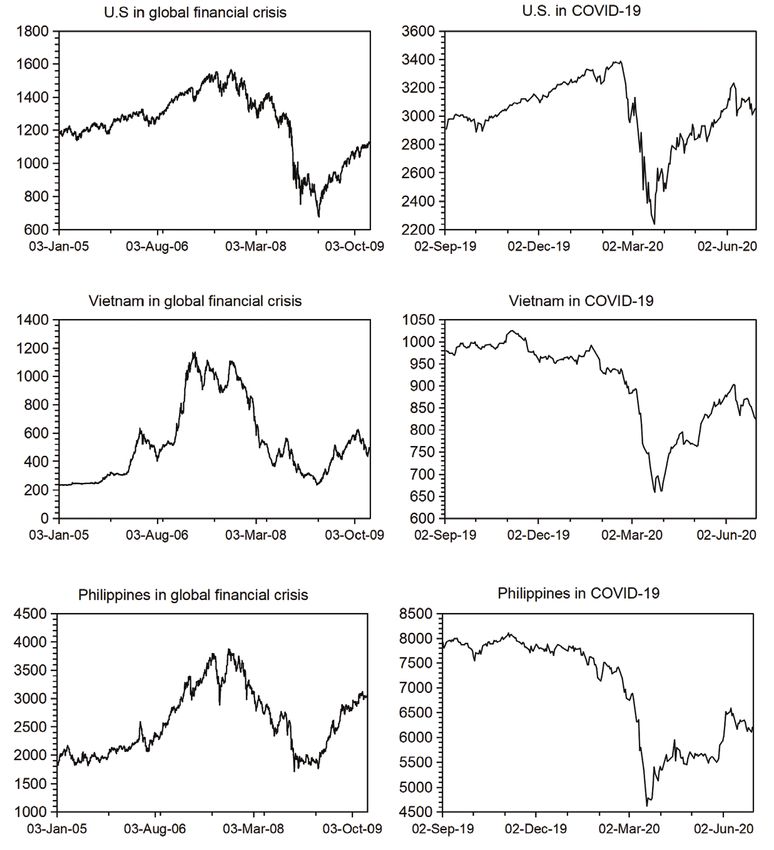
Stock exchange rate returns are calculated as
correlation measure (Cho & Parhizgari, 2008).
Pt The analysis of Engle’s DCC – GARCH model involves
ln × 100 where Pt is the price level of for the stock
Pt −1 two steps: the first is to estimate the univariate GARCH
exchange market at time t. This is also the return measurement model, and the second is to measure the conditional correla-
method that is introduced by Campbell et al. (1997). tions varying over time.Thao Phan Thi Dieu LE, Hieu Luong Minh TRAN /
Journal of Asian Finance, Economics and Business Vol 8 No 2 (2021) 0759–0770 763
Figure 2: Stock market return series
The multivariate DCC–GARCH model that is proposed Qt = (1 - l1 - l2 ) Q + l1d i ,t -1d j ,t -1 + l2 Qt -1
by Engle (2002) is defined as follows; (3)
Rt = Qt*-1Qt Qt*-1
(1)
Yt = mt + H t e t
1/ 2
where Qt = qij ,t is a ( N × N ) time varying covariance
H = D R D ε
matrix of standardized residuals δ it = it , Q is the
t t t t
hit
(
Rt = diag (Qt ) ) (
Qt diag (Qt ) )
−1/ 2 −1/ 2
(2) unconditional correlations of δ i ,t δ j ,t , l1 and l2 are
(
Dt = diag h11,t , h22,t ,...... hNN ,t ) nonnegative scalar parameters which satisfies l1 + l2 < 1, and
Qt* = qii* ,t = qii ,t is a diagonal matrix with the square root
where Yt = (Y1t, Y2t, Y3t, ……, YNt) is the vector of the of the ith diagonal element of Qt on its ith diagonal position.
past observations, mt = (m1t, m2t, m3t, ……, mNt) is the vector Hence, the conditional correlation of a pair of markets i
and j at time t can be defined as:
of conditional returns, Ht is the multivariate conditional
variance, et = (e1t, e2t, e3t, ……, eNt) is the vector of the (1 - l1 - l 2)qij + l1d i ,t -1d j ,t -1 + l 2qij ,t -1
rij ,t =
standardized residuals, Rt is a N × N symmetric dynamic é 1
ù
ê[(1 - l1 - l 2)qii + l1d i ,t -1 + l 2qii ,t -1 ] ú
2 2
correlations matrix, and Dt is a diagonal matrix of (4)
conditional standard deviations for return series, which is got ê 1ú
ê´[(1 - l1 - l 2)q + l1d 2 + l 2q ] 2ú
from analyzing a GARCH model with hii ,t on the diagonal ë jj j , t -1
jj , t -1 û
i ( i = 1, 2,3, …, N ) . where qij is the element which locates on the i and jth
th
The DCC specification is defined as follows; column in the matrix Qt.Thao Phan Thi Dieu LE, Hieu Luong Minh TRAN /
764 Journal of Asian Finance, Economics and Business Vol 8 No 2 (2021) 0759–0770
The parameters are measured by applying quasi- crisis. Besides, the kurtosis values in these markets are larger
maximum likelihood method (QMLE) which is proposed than 3, which implies a peaked distribution comparing with
by Bollerslev et al. (1988). With regard to Celik (2012), the the normal distribution. In other words, for all three markets,
log-likelihood is defined as: big shocks of either sign are more likely to occur and that rate
of return series in markets may not be distributed normally
1 T (Chiang et al., 2007). Furthermore, Jarque-Bera test results
L (v ) = − ∑ [(nlog ( 2p ) + log Dt + e t' Dt−1 Dt−1e t )
2
for all markets in both pre-crisis periods also show that stock
2 t =1 (5)
−1
exchange daily returns do not have normal distribution.
+ (log Rt + d R d − d d )] t
'
t t
'
t t Table 1 also gives information about the descriptive
statistics in the period of crisis. During this period, the mean
where T is observation number, n is equation number, and v
of stock exchange market returns are negative for all countries
is the vector of parameters which is measured.
in both crisis periods. Another noteworthy statistic in this table
is that the values of kurtosis in crisis period are as high as
4.2. Contagion Effect Test With Dynamic pre-crisis period. In addition, the null hypothesis of series
Conditional Correlation Coefficient having normal distribution is rejected for three markets during
two crisis period. For all countries, the mean of stock exchange
In this paper, t-statistics is applied for a purpose which
daily returns in the pre-crisis period are higher than those in
is to examine consistency of dynamic correlation coefficient
crisis period. The standard deviation of stock exchange market
between stock markets in the pre-crisis period and crisis period
returns in pre-crisis period are lower than those in the period
in order to evaluate the contagion effect. The authors define
of crisis. It is an existence of leptokurtic distribution in all the
both null and alternative hypotheses as that of Celik (2012).
stock exchange market returns, which can be considered as a
common characteristics of financial variables.
H 0 : m`pre − crisis = m`crisis and H1 : m`pre − crisis ≠ m`crisis (6)
5.2. The Contagion Effects
where µ ρ and µ ρ
pre − crisis crisis
are the conditional correlation
coefficient means of population in the period of pre-crisis Table 3 presents the analysis results of DCC coefficients
and the period of crisis. If sample sizes are npre–crisis, and ncrisis, in the period of pre-crisis and the period of crisis in global
the population variances to be denoted by σ2pre − crisis and σcrisis 2
financial crisis and COVID-19 pandemic crisis. According
will unknown and different (Celik, 2012). If the means of to the statistics during the 2007–2008 financial crisis, the
dynamic correlation coefficients to be calculated by DCC – DCC coefficients between the U.S. and Vietnamese markets
GARCH model are ρij and ρij
pre − crisis crisis
and the variances in the pre-crisis period and crisis period are significant at
2
are denoted by spre − crisis , and scrisis , the value of t-statistic can
2
10% level and 5% level, respectively, however, that value
be measured based on the formula of Celik (2012), which is: from the U.S. to the Philippine markets is only significant at
10% level in the pre-crisis period, and is not significant at all
t=
(r ij
crisis
) (
− rij pre − crisis − m rcrisis − m rpre − crisis ) the levels in the crisis period, implying that the correlation
(7) between two markets is very weak, and almost none. It can
s 2
s 2
pre − crisis be clearly seen that DCC correlation between the U.S. and
crisis
+ pre − crisis
n crisis
n the Vietnamese stock markets increases in crisis period,
while this correlation between the U.S. and the rest of
If the absolute value of t-statistic is significantly greater
than the critical value, the hypothesis H0 can be rejected, and market falls, which also shows the difference based on the
it also means that contagion effect exists. change in the DCC mean values in percentage term between
these markets are 91.78% for Vietnam, and –34.23% for
5. Empirical Findings the Philippines. As far as the DCC results for COVID-19
pandemic crisis is concerned, the coefficients from the U.S.
5.1. Descriptive Statistics to both developing markets in the pre-crisis period and crisis
period are significant at 1% level and 5% level. The relative
Tables 1 and 2 illustrate the descriptive statistics of daily percentage difference of the DCC mean values between the
returns on the U.S., Vietnamese, and Philippines indices in U.S. and Vietnamese markets; and between the U.S. and the
the period of pre-crisis, the period of crisis, and entire period. Philippine markets are 22.38% and 52.58%, respectively.
In Table 1, it can be clearly seen that the mean of all This is also an indication that the contagion effect exists.
stock exchange rate returns are positive during period before The findings in Table 3 partly reflect the existence of the
the global financial crisis, while only that value for the U.S. contagion effects, and this will help strengthen the analysis
market is positive in period before COVID-19 pandemic results in Table 4.Thao Phan Thi Dieu LE, Hieu Luong Minh TRAN /
Journal of Asian Finance, Economics and Business Vol 8 No 2 (2021) 0759–0770 765
Table 1: Descriptive statistics of stock exchange daily returns in pre-crisis period and crisis period
U.S. Vietnam Philippines
(S&P 500) (VN–Index) (PSEi)
Mean 0.0004 0.0027 0.0012
Minimum –3.5343 –4.9714 –8.2513
Maximum 2.8790 4.7348 9.3653
Pre-crisis period Global Standard deviation 0.0065 0.0155 0.0127
(03/01/2005 – 30/09/2007) Financial crisis Skewness –0.3138 0.0801 –0.0309
Kurtosis 5.6336 4.0712 9.4507
Jarque-Bera 308.988*** 49.0249*** 1734.891***
LB (10) 9749.8*** 9740.3*** 9741.3***
Mean 0.0728 –0.0412 –0.0508
Minimum –1.8065 –2.4218 –2.6300
Maximum 1.4870 1.6650 2.0860
COVID-19 Standard deviation 0.500 0.4760 0.6914
Pre-crisis period
pandemic
(03/09/2019 – 23/02/2020) Skewness –0.551 –0.1892 0.2258
crisis
Kurtosis 5.764 7.4233 5.0154
Jarque-Bera 64.1927*** 30.9648*** 142.860***
LB (10) 1501.8*** 1451*** 1478.2***
Mean –0.0007 –0.0009 –0.0004
Minimum –9.4695 –4.8019 –13.0887
Maximum 10.9572 4.6468 7.0560
Crisis period Global Standard deviation 1.9721 2.0970 1.6629
(01/10/2007–31/12/2009) Financial crisis Skewness –0.0518 0.0485 –1.0183
Kurtosis –0.0518 7.8330 10.4138
Jarque-Bera 795.400*** 4.6346* 2010.22***
LB (10) 7908.4*** 7725.7*** 7826.5***
Mean –0.0400 –0.0793 –0.1211
Minimum –9.9945 –5.3284 –10.2159
Maximum 8.9683 4.6012 7.1717
COVID-19 Standard deviation 2.5270 1.3241 2.1246
Crisis period
pandemic
(24/02/2020–30/06/2020) Skewness 0.0158 –0.5324 –0.6456
crisis
Kurtosis 6.3176 5.6388 8.1185
Jarque-Bera 58.3338*** 148.613*** 43.1882***
LB (10) 1010*** 976.45*** 966.75***
Note: Table shows the descriptive statistics for pre-crisis period and crisis period. LB (10) is Ljung-Box Q test statistics for 10 lags. ***, ** and
* indicate the significance level at 1%, 5%, 10% respectively.
In Table 4, the null hypothesis of the mean of DCC the statistics for COVID-19 pandemic, the null hypothesis
correlations for the Philippines in the global financial crisis of the mean of DCC correlations for both Vietnam and
which are same in pre-crisis and crisis periods can not be the Philippines that are same in crisis and crisis periods
rejected. However, the authors reject the null hypothesis of no can be rejected, which also means that it is a appearance
contagion effect between the U.S. and the Vietnamese stock of contagion effects between the U.S. and two developing
markets during the subprime mortgage crisis. Regarding to (the Vietnamese and the Philippine) stock markets.Thao Phan Thi Dieu LE, Hieu Luong Minh TRAN /
766 Journal of Asian Finance, Economics and Business Vol 8 No 2 (2021) 0759–0770
Table 2: Descriptive of stock exchange daily returns in entire period (03/01/2005–31/12/2009 and 03/09/2019–30/06/2020)
U.S. Vietnam Philippines
(S&P 500) (VN–Index) (PSEi)
Mean –0.0001 0.0011 0.0004
Minimum –9.4695 –4.9714 –13.0887
Maximum 10.9572 4.7348 9.3653
Standard deviation 1.4107 1.8247 1.4630
Global Financial crisis
Skewness –0.1815 –0.0298 –0.7283
Kurtosis 13.6312 3.2952 10.9681
Jarque-Bera 8589.34*** 6.4313*** 4973.89***
LB (10) 17968*** 17906*** 17964***
Mean 0.0250 –0.0573 –0.0806
Minimum –9.9945 –5.3284 –10.2159
Maximum 8.9683 4.6012 7.1717
COVID-19 pandemic Standard deviation 1.856 0.9330 1.4767
crisis Skewness –0.0914 –0.7076 –0.8605
Kurtosis 13.432 9.9626 14.845
Jarque-Bera 1370.02*** 634.447*** 1801.4***
LB (10) 2768.6*** 2768.5*** 2767.1***
Note: Table shows the descriptive statistics for entire period (03/01/2005–31/12/2009 and 03/09/2019–30/06/2020). LB (10) is Ljung-Box
Q test statistics for 10 lags. ***, ** and * indicate the significance level at 1%, 5%, 10% respectively.
Table 3: Analysis of DCC – GARCH model
Dynamic conditional correlation
Pre-crisis Crisis % difference
0.0596* 0.1143**
US _Vietnam 91.7785
(0.077) (0.012)
Global Financial crisis
0.0631* 0.0415
US_Philippines –34.2314
(0.097) (0.399)
0.3431*** 0.4199***
US _Vietnam 22.3841
COVID-19 pandemic (0.001) (0.000)
crisis 0.2128** 0.3247***
US_Philippines 52.5846
(0.036) (0.000)
Note: pre-crisis period is from 03/01/2005 to 31/09/2007 and from 03/09/2019 to 23/02/2020. Crisis period is from 01/10/2007 to 31/12/2009
and from 24/02/2020 to 30/06/2020. ***, ** and * indicate the significance level at 1%, 5%, 10% respectively.
Table 4: Dynamic conditional correlation coefficient and contagion effect test
t-statistic
Mean Variance
H0 : m rpre − crisis = m rcrisis
Pre-crisis 0.06 0.06
DCC US_Vietnam –19.32***
Global Crisis 0.11 0.02
Financial crisis Pre-crisis 0.06 0.00
DCC US_Philippines –0.33
Crisis 0.04 0.00
Pre-crisis 0.24 0.00
DCC US_Vietnam –18.39***
COVID-19 Crisis 0.42 0.01
pandemic crisis Pre-crisis 0.18 0.01
DCC US_Philippines –12.96***
Crisis 0.42 0.00
Note: pre-crisis period is from 03/01/2005 to 31/09/2007 and from 03/09/2019 to 23/02/2020. Crisis period is from 01/10/2007 to 31/12/2009
and from 24/02/2020 to 30/06/2020. ***, ** and * indicate the significance level at 1%, 5%, 10% respectively.Thao Phan Thi Dieu LE, Hieu Luong Minh TRAN /
Journal of Asian Finance, Economics and Business Vol 8 No 2 (2021) 0759–0770 767
The reasons why the contagion effects exist in the are also very large. This has contributed to an increase in the
Vietnamese market in the global financial crisis, and occur in current account balance of the Philippines and the surplus of
both the Vietnamese and the Philippine stock markets during this account is considered an additional source of funding
the COVID-19 pandemic crisis is that investors around the in case the Philippine capital flow suddenly stops due to the
world in general, and in Vietnam and the Philippines in impact of the crisis. Moreover, the increase in remittance from
particular are sensitive to news and the volatility of stock abroad to the Philippines via Business process outsourcing
prices from foreign markets. Besides, the U.S. is one of industry and Overseas Filipino workers has contributed to
the largest economy which can impact other countries supporting the Philippines’ consumer economy. The above
such as Vietnam and the Philippines. Another reason worth reasons have inadvertently made the Philippine economy
considering is the integration of Vietnam and the Philippines become inward and not dependent on exports. Hence, during
into the global economy which also explains the contagion the crisis, the Philippines economy and stock market did not
effects from the U.S. to the Vietnamese and the Philippine suffer as much losses as other countries.
stock markets. Thanks to being members of ASEAN,
the APEC, and the WTO forum, the Vietnamese and the 5.3. Comparison
Philippine economies receive more investment from foreign
investors, involving those in the U.S. It also explains the The analysis of the contagion effects in two crises stated
contagion effects from the U.S. to two developing markets, above shows that the Vietnamese stock market during the
the Vietnamese and the Philippine markets. In addition, COVID-19 pandemic crisis is less affected by the U.S.
when those crises appear, import and export activities as market than in the global financial crisis, with a percentage
well as production activities are almost suspended due to change in the conditional correlation coefficients of 22.38%
credit scarcity in the U.S. subprime crisis, and the spread for the crisis in 2020 and 91.78% for the crisis in 2008,
of coronavirus disease in COVID-19 pandemic crisis. This while the Philippines is more influenced by the COVID-19
phenomenon will negatively affect to not only the economic pandemic crisis rather than by the U.S. subprime crisis, with
growth, but also the stock market indices. In fact, the global the relative percentage difference of the DCC mean values
financial crisis was originally from the U.S. Furthermore, of 52.58% for the crisis in 2020 and -34.23% for the crisis
during COVID-19 pandemic, the United States has the in 2008. The key factors that can explain these phenomena
highest number of COVID-19 cases in the world, with more are the background of each crisis, and how Vietnam and the
than 2.5 million cases and approximately 126,000 deaths, Philippines cope with them.
confirmed on June 30, 2020 by World Health Organization With regard to the 2007–2008 financial crisis, it began
(2020). Therefore, the authors can deny that America is the with a downturn in the subprime mortgage market in the
country that suffered the most from these two crises. This also United States, and developed into a full-blown international
will create the contagion effects between the U.S. and other banking crisis with the bankruptcy of Lehman Brothers on
countries markets, including Vietnam and the Philippines. September 15th, 2008; excessive risk-taking by banks in
However, the authors do not find evidence of a contagious America such as Lehman Brothers enlarged this crisis to
impact from the U.S. stock market to the Philippine stock a global scale (Williams, 2010). Even though the global
market during the global financial crisis. This result is financial crisis exposed weaknesses that were existing
consistent with reality and can be explained by the following in many financial industry regulations and the financial
reasons. Firstly, in this period, the Philippine government systems all over the world (Mighri & Mansouri, 2013),
has a quasi-capital control. Although the country has including Vietnam, the economy and financial markets of
been liberalizing its capital account since the 1990s, the the Philippines were not significantly affected by this crisis.
Philippines’ constitution still has some specific prohibitions Thanks to tight control of capital markets and the banking
related to the banking industry and a few sectors that are industry as well as efforts to turn the economy inward, the
listed on Foreign Investment Negative List. Besides, the Philippines has successfully isolated its economy from the
central bank of the Philippines has set up appropriate policy global financial crisis.
guidelines among banks through macroprudential policy to Nevertheless, the COVID-19 pandemic crisis is
limit the risks taken by domestic banks when conducting completely different from the 2007–2008 global financial
both domestic and foreign transactions (Zoleta, 2018). This crisis in terms of its background, characteristics and the way
has not only made the Filipino banks less connected with it affects economic, political and social aspects. In fact, the
major U.S. banks than in the previous period, but also made coronavirus pandemic is a global health crisis that has broken
the two economies less connected. Secondly, according to out in 2020, and become the biggest challenge that humans
Zoleta (2018), before and during the global financial crisis, have faced since World War II. Since its appearance in Asia in
the debt to equity ratio of companies in the Philippines drops late 2019, the COVID-19 virus has spread to many continents
sharply, and their foreign exchange reserves in this period except Antarctica. This pandemic is not only a healthThao Phan Thi Dieu LE, Hieu Luong Minh TRAN /
768 Journal of Asian Finance, Economics and Business Vol 8 No 2 (2021) 0759–0770
crisis, it is also considered as an unprecedented socio- 6. Conclusions
economic crisis. According to World Health Organization
(2020), until the end of June 2020, approximately In this paper, daily returns on the S&P 500, VN-Index and
10.2 million COVID-19 infection cases around the world PSEi from 03/01/2005 to 31/12/2009 and from 01/11/2019
have been confirmed and the total number of confirmed to 30/06/2020 are used to test the existence of financial
COVID-19 deaths are more than 500 thousands people. This contagion from the U.S. stock market to the Vietnamese
has negatively affected the production activities which are and the Philippine stock markets during the U.S. subprime
essential for economic growth. In other words, the shortage crisis and the COVID-19 pandemic crisis by applying
of human resources in manufacturing and business activities DCC – GARCH model that has some advantages over other
will cause the economy as well as the financial markets to methodologies.
go down. Therefore, to overcome economic recession in As a result of analysis, the authors cannot find evidence
the COVID-19 pandemic, governments in every countries of contagion during global financial crisis from the U.S. stock
need to get effective and timely practices in order to limit the market to the Philippine stock market, while the Vietnamese
spread of the potentially deadly virus, coronavirus. It also market is influenced by this effect. Besides, both these
means that countries that have well controlled the increase in developing stock markets are influenced by the contagion
the number of cases and deaths in the COVID-19 will be less effect in COVID-19 pandemic crisis. This result is expected
affected by this crisis. It can be clearly seen that Vietnam’s since developing markets are more unstable than developed
relative difference of the conditional correlation coefficients markets (Celik, 2012), which means that contagion can have
in the COVID-19 is only approximately a quarter of that wide spread harmful consequences in the developing markets.
rate in the global financial crisis, which means Vietnam is Another finding is that the contagion effect in the coronavirus
less influenced by the contagion effect from the COVID-19 pandemic crisis less affects to Vietnam than that in the global
pandemic crisis than the remaining crisis. financial crisis, whereas the Philippines has opposite result
This result is in line with reality because Vietnam has with Vietnam. It is also noticeable that the Philippines seems
been cited by the global media as one of the countries to be more influenced by this effect from the COVID-19
with the best-organized epidemic prevention and control pandemic than Vietnam at the time of this study. These
programs in the world (Walden, 2020; Winn, 2020), and this phenomena appear due to differences in crisis management
is an undeniable fact that the total number of COVID-19 strategies of both Vietnam and the Philippines in the global
infections in Vietnam are only 355 cases and zero deaths are financial crisis and the COVID-19 pandemic crisis.
confirmed as of 30th June 2020 (World Health Organization, The findings of this article are necessary for policymakers
2020). However, the results for the contagion effect of in the Vietnamese, the Philippine markets and other
the Philippines are in stark contrast to that of Vietnam. developing markets because financial contagion instability
It is noticed that the Philippines’s relative change of the affects their development. Hence, policy makers in Vietnam
DCC mean values in the COVID-19 pandemic crisis is and the Philippines should find ways to close the channels
greater than that rate in the global financial crisis by a of contagion to reduce the instability in their countries.
difference of 86.81%, which means the contagion effect In addition, policy makers in these countries also should
from the coronavirus pandemic affects the Philippines understand clearly the characteristics of each crisis in order
more than from the global financial crisis. This finding is to propose policies that are suitable for their own country,
consistent with reality in the study area that the Philippines and should pay close attention to information about the U.S.
is in danger of losing the battle against COVID-19 due to economy. Moreover, investors should follow information on
poor detection, isolation, and contact tracing (Fonbuena, the U.S. stock market when investing or diversifying their
2020), making this country has become the second largest portfolio by investing in the Vietnamese or the Philippine
outbreak of COVID-19 in Southeast Asia with the total of stock market.
36,438 confirmed cases and 1,255 deaths till 30th June 2020 Examining the presence of financial contagion on other
(World Health Organization, 2020). Moreover, the authors asset markets such as foreign exchange markets or sovereign
also observe that the Vietnam’s percentage change of DCC bond markets and on other developing countries such as
mean values in the COVD-19 pandemic crisis (22.38%) Malaysia, Thailand, Indonesia, China and so on. Besides,
is lower than that rate of the Philippines (52.58%), which employing high frequency datasets will provide broader
means that at the time of this study, the Philippines seems evidence of financial contagion.
to be more influenced by the contagion effect from the
COVID-19 pandemic than Vietnam. This is obvious because, References
regarding to those facts that are stated above, it can be
denied that Vietnam is coping so well with the coronavirus, Alam, M. N., Alam, M. S., & Chavali, K. (2020). Stock market
and they are doing this better than the Philippines. response during COVID-19 lockdown period in India:Thao Phan Thi Dieu LE, Hieu Luong Minh TRAN /
Journal of Asian Finance, Economics and Business Vol 8 No 2 (2021) 0759–0770 769
An event study. Journal of Asian Finance, Economics, and Journal of International Money and Finance, 1026-1228.
Business, 7(7), 131–137. https://doi.org/10.13106/jafeb.2020. https://doi.org/10.1016/j.jimonfin.2007.06.005
vol7.no7.131 Cho, J. H., & Parhizgari, A. M. (2008). East Asian financial contagion
Alshammari, T. S., Ismail, M. T., Al-wadi, S., Saleh, M. H., & under DCC-GARCH. International Journal of Banking and
Jaber, J. J. (2020). Modeling and Forecasting Saudi Stock Finance, 6(1). https://doi.org/10.32890/ijbf2009.6.1.8380
Market Volatility Using Wavelet Methods. Journal of Asian Dominguez, K. M. E., Hashimoto, Y., & Ito, T. (2012). International
Finance, Economics, and Business, 7(11), 83–93. https://doi. reserves and the global financial crisis. Journal of International
org/10.13106/jafeb.2020.vol7.no11.083 Economics, 88(2), 388–406. https://doi.org/10.1016/j.
Balli, F., Hajhoj, H. R., Basher, S. A., & Ghassan, H. B. (2015). jinteco.2012.03.003
An analysis of returns and volatility spillovers and their Engle, R. (2002). Dynamic conditional correlation: A simple
determinants in emerging Asian and Middle Eastern countries. class of multivariate generalized autoregressive conditional
International Review of Economics & Finance, 39, 311–325. heteroskedasticity models. Journal of Business & Economic
https://doi.org/10.1016/j.iref.2015.04.013 Statistics, 20(3), 339–350. https://doi.org/10.1198/073500102
Becketti, S., & Sellon, G. H. (1989). Has financial market volatility 288618487
increased? Economic Review from Federal Reserve Bank of Ezzati, P. (2013). Analysis of Financial Markets Integration of
Kansas City, 74(June), 17–30. https://www.kansascityfed.org/ Iran within the Middle East and with the Rest of the World.
PUBLICAT/ECONREV/EconRevArchive/1989/2q89beck.pdf American Journal of Applied Sciences, 10(12), 1492–1508.
Bekaert, G., Harvey, C. R., & Ng, A. (2005). Market integration https://doi.org/10.3844/ajassp.2013.1492.1508
and contagion. Journal of Business, 78(1), 39–69. http://dx.doi. Fonbuena, C. (2020, August 1). Global report: Philippines
org/10.1086/426519 ‘losing battle’ as WHO records biggest jump in Covid-19
Bollerslev, T., Engle, R. F., & Wooldridge, M. (1988). A capital cases. The Guardian. Retrieved July 7, 2020 from https://
asset pricing model with time-varying covariance. Journal www.theguardian.com/world/2020/aug/01/global-report-
of Political Economy, 96(1), 116–131. http://dx.doi.org/ philippines-losing-battle-as-who-records-biggest-jump-in-
10.1086/261527 covid-19-cases
Bouaziz, M. C., Selmi, N., & Boujelbene, Y. (2012). Contagion effect Forbes, K., & Rigobon, R. (2002). No contagion, only
of the subprime financial crisis: evidence of DCC multivariate interdependence: measuring stock market co-movements.
GARCH models. European Journal of Economics, Finance Journal of Finance, 57(5), 2223–2261. https://doi.org/10.
and Administrative Sciences, 44, 66–76. https://www.euro 2307/3094510
peanjournalofeconomicsfinanceandadministrativesciences. Horta, P., Mendes, C., & Vieira, I. (2008). Contagion effects of
com/ the US subprime crisis on developed countries. CEFAGE-UE
Breitung, J., & Candelon, B. (2006). Testing for short- and long- Working Paper. Évora, Portugal: CEFAGE-UE.
run causality: A frequency-domain approach. Journal of Hwang, I., Haeuck, I. F., & Kim, T. S. (2010). Contagion effects
Econometrics, 132(2), 363–378. https://doi.org/10.1016/j. of the U.S. subprime crisis on international stock markets.
jeconom.2005.02.004 Finance and Corporate Governance Conference 2010 Paper.
Calvo, S., & Mendoza, E. (2000). Rational contagion and the Melbourne, Australia, April 2010. Victoria, Australia: La Trobe
globalization of securities markets. Journal of International University. https://dx.doi.org10.2139/ssrn.1536349
Economics, 51, 79–113. https://doi.org/10.1016/S0022- Jones, P. M., & Olson, E. (2013). The time-varying correlation
1996(99)00038-0 between uncertainty output and inflation: Evidence from a
Campbell, J. Y., Lo, A. W., & MacKinlay, A. C. (1997). The DCC–GARCH model. Economics Letters, 118(1), 33–37.
econometrics of financial markets. Princeton, NJ: Princeton https://doi.org/10.1016/j.econlet.2012.09.012
University Press. Kaminsky, G. L., & Schmukler, S.L. (1999). What triggers market
Carrick, A. (2020, February 24). FTSE 100 plunges 3.4 per cent as jitters? A chronicle of the Asian crisis. Journal of International
Italy confirms seventh coronavirus death. CITYA.M. Retrieved Money and Finance, 18, 537–560. https://doi.org/10.1016/
July 10, 2020 (actual access date), from https://www.cityam. S0261-5606(99)00015-7
com/ftse-100-plunges-2-per-cent-as-coronavirus-takes-hold- Khan, K., Zhao, H., Zhang, H., Yang, H., Shah, M. H., & Jahanger,
in-italy/ A. (2020). The impact of COVID-19 pandemic on stock
Celik, S. (2012). The more contagion effect on emerging markets: An empirical analysis of world major stock indices.
markets: The evidence of DCC-GARCH model. Economic Journal of Asian Finance, Economics, and Business, 7(7),
Modelling, 29(5), 1946–1959. https://doi.org/10.1016/j. 463–474. https://doi.org/10.13106/jafeb.2020.vol7.no7.463
econmod.2012.06.011 McLean, R., He, L. & Tappe, A. (2020, February 24). Dow plunges
Chiang, T. C., Jeon, B. N., & Li, H. (2007). Dynamic correlation 1,000 points, posting its worst day in two years as coronavirus
analysis of financial contagion: evidence from Asian markets. fears spike. CNN Business. Retrieved July 7, 2020 fromThao Phan Thi Dieu LE, Hieu Luong Minh TRAN /
770 Journal of Asian Finance, Economics and Business Vol 8 No 2 (2021) 0759–0770
https://edition.cnn.com/2020/02/23/business/stock-futures- & Finance, 20(4), 717–732. https://doi.org/10.1016/j.iref.2011.
coronavirus/index.html 01.006
Mighri, Z., & Mansouri, F. (2013). Dynamic conditional correlation Walden, M. (2020, May 13). How has Vietnam, a developing nation
analysis of stock market contagion: evidence from the 2007- in South-East Asia, done so well to combat coronavirus?. ABC
2010 financial crises. The International Journal of Economics News. Retrieved July 7, 2020 (actual access date), from https://
and Financial issues, 3(3), 237–661. https://www.econjournals. www.abc.net.au/news/2020-05-13/coronavirus-vietnam-no-
com/index.php/ijefi/article/view/390 deaths-success-in-south-east-asia/12237314
Mulyadi, M. (2009). Volatility spillover in Indonesia, USA, and Williams, M. (2010). Uncontrolled Risk: The Lessons of Lehman
Japan capital market. MPRA Paper 16914. Munich, Germany: Brothers and how systemic risk can still bring down the world
University of Munich financial system (1st ed.). New York, NY: McGraw-Hill.
Naoui, K., Liouane, N., & Brahim, S. (2010). A dynamic Winn, P. (2020, May 07). Is Vietnam the coronavirus-fighting
conditional correlation analysis of financial contagion: the champ of the world? The World. Retrieved July 7, 2020 from
case of the subprime credit crisis. International Journal of https://www.pri.org/stories/2020-05-07/vietnam-coronavirus-
Economics and Finance, 2(3), 85–96. https://doi.org/10.5539/ fighting-champ-world
ijef.v2n3p85 World Health Organization. (2020). Coronavirus disease
Nguyen, M. K., & Le, D. N. (2018). Return Spillover from the (COVID-19): situation report, 162. World Health Organization.
US and Japanese Stock Markets to the Vietnamese Stock https://apps.who.int/iris/handle/10665/332970
Market: A Frequency-Domain Approach. Emerging Markets World Intellectual Property Organization. (2019). The Global
Finance & Trade, 1–12. https://doi.org/10.1080/154049 Innovation Index 2019: Creating healthy lives - The future of
6X.2018.1525357 medical innovation. World Intellectual Property Organization
Sok-Gee, C., Karim, M. A., & Karim, M. A. (2010). Volatility (WIPO). https://www.wipo.int/global_innovation_index/en/2019/
spillovers of the major stock markets in ASEAN-5 with the Worthington, A. & Higgs, H. (2004). Transmission of Equity Returns
US and Japanese stock markets. International Research and Volatility in Asian Developed and Emerging Markets: A
Journal of Finance and Economics, 44, 156–168. http://www. Multivariate GARCH Analysis. International Journal of Finance
internationalresearchjournaloffinanceandeconomics.com/ & Economics, 9(1), 71–80. https://doi.org/10.1002/ijfe.222
ISSUES/IRJFE%20issue%2044.htm
Zoleta, A. (2018). The great financial crisis and how the Philippines
Syllignakis, M. N., & Kouretas, G. P. (2011). Dynamic correlation got away from it. Unpublished internal document, Chartered
analysis of financial contagion: evidence from the Central and Institute for Securities & Investment.
Eastern European markets. International Review of EconomicsYou can also read