Momentum Effect in the Oman Stock Market Over the Period of 2005-2018
←
→
Page content transcription
If your browser does not render page correctly, please read the page content below
Omar Khlaif GHARAIBEH, Ahmad AL-KHAZALI, Ali Zkariya AL-QURAN /
                                          Journal of Asian Finance, Economics and Business Vol 8 No 2 (2021) 0711–0724                                    711

Print ISSN: 2288-4637 / Online ISSN 2288-4645
doi:10.13106/jafeb.2021.vol8.no2.0711

                                      Momentum Effect in the Oman Stock Market
                                            Over the Period of 2005-2018

                          Omar Khlaif GHARAIBEH1, Ahmad AL-KHAZALI2, Ali Zkariya AL-QURAN3

                                  Received: November 05, 2020 Revised: January 05, 2021 Accepted: January 15, 2021

                                                                                        Abstract
The purpose of this paper is to investigate the profitability of the momentum effects on the Oman Stock Market (OSM). This study uses
the monthly returns of all stocks listed on the OSM, with a total of 107 companies used in the study for the period from 2005 to 2018.
According to the methodology developed by Jegadeesh and Titman (1993), this study builds momentum portfolios based on various sizes.
Moreover, the January effect is also examined to recognize if this effect is related to the momentum effect. The results find that there is
evidence of momentum returns and these returns are statistically and economically significant. The sub-periods confirmed the profitability
of the momentum strategy. This paper shows that momentum returns are evident at different sizes; big, medium, and small-sized portfolios.
Besides, the result shows that the classic January effect does not play an important role in the momentum returns. Thus, the implication
is that the momentum should not take into account the annual, seasonal, and size returns. The capital asset pricing model (CAPM) or the
three-factor model cannot explain momentum returns generated by individual stocks in the Oman Stock Market. These results are useful to
academia and investors alike.

Keyword: Momentum Effect, Size, January, Oman Stock Market, Capital Asset Pricing Model

JEL Classification Code: G4, G32, G21

1. Introduction                                                                                  Jegadeesh and Titman (1993) documented the momentum
                                                                                                 effect, which means short-term winners will outperform
    Momentum is the rate of change of returns of the stock                                       short-term losers. Rouwenhorst (1998) asserted that the
or the index. If the rate of change of returns is high, then the                                 momentum effect is the persistence of price. Jegadeesh and
momentum is considered high and if the rate of change of                                         Titman (1993) and Chan et al. (1996) examined whether
returns is low, then momentum is considered low. The effect                                      forecasts of future returns from previous returns due to lack
of momentum remains a controversial subject for researchers                                      of rapid market information (under-reaction), especially
and challenges the efficient market hypothesis (EMH).                                            news about past earnings. Past return and past earnings are
                                                                                                 noteworthy in predicting large deviations in future returns
                                                                                                 after managing others. Chan et al. (2000) investigated the
                                                                                                 profitability of momentum strategies applied to global
1
  First Author and Corresponding Author. Associate Professor,                                    equity market indices. They point out that momentum
Finance and Banking Department, Faculty of Economic and                                          profits come from primarily time-series predictability in
Administrative Sciences, Al-alBayt University, Jordan [Postal
Address: Al-Mafraq, Jordan] Email: omar.k.gharaibeh@gmail.com
                                                                                                 equity market indices—some of the profits comes from
2
  Associate Professor. Finance and Banking Department, Faculty                                   currency market forecast.
of Economic and Administrative Sciences, Al-alBayt University,                                       Using Middle East data for the period 2008–2013, Ejaz
Jordan. Email: ahmadkhzl@yahoo.com                                                               and Polak (2014) examined the existence of momentum
3
  Assistant Professor. Department of Business Administration, Faculty
  of Economic and Administrative Sciences, Al-alBayt University,                                 effect in six countries (1) the United Arab Emirates
  Jordan. Email: ali.z.quran@yahoo.com                                                           both Abu Dhabi and Dubai stock markets (2) Jordan (3)
                                                                                                 Egypt (4) Oman (5) Morocco (6) Saudi Arabia. This paper
© Copyright: The Author(s)
This is an Open Access article distributed under the terms of the Creative Commons Attribution   aims to find momentum effect in the Middle East (ME)
Non-Commercial License (https://creativecommons.org/licenses/by-nc/4.0/) which permits
unrestricted non-commercial use, distribution, and reproduction in any medium, provided the
                                                                                                 stock markets and to investigate whether the risk-based
original work is properly cited.                                                                 CAPM model can explain momentum returns in the 7
                                                                                                 Arabic stock markets from the ME.
Omar Khlaif GHARAIBEH, Ahmad AL-KHAZALI, Ali Zkariya AL-QURAN /
712                               Journal of Asian Finance, Economics and Business Vol 8 No 2 (2021) 0711–0724

momentum effect is statistically significant in all 7 stock            only evident in a micro-size and small size portfolio. This
markets. However, momentum returns cannot be explained                 paper contradicts the previous results and shows that the
by the CAPM. Their study is the first study investigates the           momentum strategy is pronounced in large, medium, and
momentum effect among 7 Arabic stock markets together                  small firms. This result helps investors in the Oman stock
in the ME. Their recommendation was more research have                 market to invest and make profits from the momentum
to extend more stock markets to understand the ME stock                strategy regardless of company size. This study will
markets.                                                               contribute to the existing literature in momentum, especially
     The current study extends the previous study by applying          in the Arab stock market such as Oman. Finally, this paper
the CAPM and three-factor model to attempt in explaining the           reveals that the CAPM and the Fama-French 3-factor model
momentum profits on the Omani stock market. The question               fail to capture the momentum returns and this result is in line
posed in the current study has significant implications in             with some prior studies such as Fama and French (2008).
academia and to investors. Furthermore, this study extends
the previous study by using a large sample that consists of            2. Literature Review
all firms listed on the Omani stock market covering a longer
                                                                           Jegadeesh and Titman (1993) are the first studies to
period from November 2005 to December 2018.
                                                                       document momentum strategies. They suggest that
        This study was carried out for different reasons. First,
                                                                       momentum effects can be used to predict future returns.
some of the existing literature found that momentum returns
                                                                       They demonstrated that strategies to long stocks that have
are related to the January effect (Yao, 2012), while others such
                                                                       been successfully in the past and short stocks that have done
 as Fama and French (2008), Alhenawi (2015), and Gharaibeh
                                                                       poorly in the past have had significant positive returns over
(2015) showed that momentum returns are attributed to the
                                                                       3- to 12-month retention periods. The authors found that
size effect. It is useful to know if the momentum is existence
                                                                       the profits of these strategies were not due to systematic risk
on different size levels and if it is attributed to January or
                                                                       or to delayed stock price reactions to common factors.
     size effects. Thus, searching for further evidence is still
                                                                       However, some of the abnormal returns occurred in the first
    required to support the current literature. Second, Smith
                                                                       year after portfolio creation and stopped in the next two
(2007) indicated that although the Omani stock market has
                                                                       years. A comparable design of returns is also observed
a foreign investment limit of 49% for non-GCC nationals, it
                                                                       around earnings announcements of previous winners and
 is one of the more-open Arab equity markets. Assaf (2003)
                                                                       losers. They decided the strategy was due to a lack of
documented that listed companies are open to all foreign
                                                                       response to company news and conservative investments
    participants in Oman. This openness to foreign investors
                                                                       (under-reaction). As a result, they are hesitant to change
motivates us to study this market to achieve abnormal returns.
                                                                       their beliefs.
     The research questions in this study are as follows: Is
                                                                           Fama and French (2008) proposed that the momentum
there a momentum effect at the stock level in the Oman stock
                                                                       effect should take place as compensation for high risks.
market for 2005–2018? Is there a momentum effect on the
                                                                       Thus, by applying the Fama-French three-factor model,
 small, medium, and big size level of the Oman stock market?
                                                                       they fail to find a risk-based explanation for momentum
Is the momentum is attributed to January or side effects? Can
                                                                       profits. Based on cross-section regression, the anomalous
the CAPM and three-factor model explain the momentum
                                                                       returns related to net equity issues, momentum, and
returns on the Oman stock market?
                                                                       accruals are present in all size sets (micro, small, and large).
     This paper also investigates the implications of the
                                                                       The anomalies of profitability and asset growth are less
January effect of a crucial paper in a momentum strategy.
                                                                       robust. There is an asset growth anomaly in average returns
The paper on return momentum by Yao (2012) found that
                                                                       on micro-cap and small equities, but it is ambiguous for
momentum is entirely attributed to the January effect.
                                                                       large equities. Among profitable companies, high
Inconsistent with Yao‘s (2012) finding, the analysis in this
                                                                       profitability tends to be related to unusually high returns,
study shows that the behavior of January profits is not
                                                                       but there is little proof that unprofitable companies have
important in the momentum returns, which leads to different
                                                                       abnormally low returns. However, the current study uses
conclusions from the previous study. The other motivation
                                                                       both the CAPM and the Fama-French three-factor model
behind the current study is the need to test whether there is
                                                                       because the author believes that what may be bad practice
a momentum effect on different size levels on the Omani
                                                                       for these models to explain momentum returns within
stock market. This study shows that the momentum effect
                                                                       developed countries may be very good to explain the nature
exists at different size levels. Alhenawi (2015) showed that
                                                                       of momentum returns in developing countries.
the momentum effect is stronger in big firms, while Fama
and French (2008) showed that the momentum effect is
Omar Khlaif GHARAIBEH, Ahmad AL-KHAZALI, Ali Zkariya AL-QURAN /
Journal of Asian Finance, Economics and Business Vol 8 No 2 (2021) 0711–0724 713
Contrary to the results of Jegadeesh and Titman (1993), Using stock level data from January 1990 to December
Fama and French (1996) and Yao (2012) suggested that the 2011, Cakici et al. (2013) examined the value and
January effect is necessary to further clarify the momentum momentum effects of 18 emerging equity markets. They
effect. Yao (2012) used the US stock data from 1926 to 2009 show solid proof in the value returns across all emerging
and revealed that the superior performance of the momentum markets and all levels of momentum return except Eastern
depends on the January effect in the cross-section of returns. Europe. They examine size patterns in value and
He re-examined two stock trading strategies: momentum momentum. After creating portfolios sorted on size and
and contrarian. Their finding demonstrated that the January BE/ME ratio, as well as the size and lagged momentum,
size effect fully explain the returns of long-term contrarian, using 3-factor models to capture the returns for these
instead of investor overreaction. In addition, their study also portfolios in regard to factors made employing local, U.S.,
examines the Novy-Marx (2011) concern about whether and aggregate global developed stock markets data. Local
return autocorrelation ―is real momentum‖ by showing that factors is better, they suggest emerging market
the outperformance of momentum returns is resulting from segmentation.
strong January in the cross-section. This leads to the long- While numerous studies have provided evidence of the
term contrarian returns must be considered mainly illusory, momentum effect, many studies have provided evidence
while momentum returns must take account of January suggesting that momentum returns are not present in many
effect in returns. emerging markets. By looking at the CAPM model for risk
Based on a large portfolio, Narayan and Phan (2017) analysis, Khan (2016) examined the momentum effect of
estimated momentum profits for Islamic equity portfolio, 83 firms on the Karachi stock exchange (KSE) from 2007
managed stock characteristics and market conditions, to 2014. The winner portfolio returns were only positive in
analyzed whether seasonal figures, and looked at the one of sixteen strategies while the zero cost portfolios
determinants of profits. They found ample evidence that the returns were positive in 4 of sixteen strategies. In addition, a
momentum strategies worked in Islamic stocks, but decreasing trend was observed in the losses mentioned in the
depending on the stock‘s characteristic, high and low 14 strategies. His analysis indicated that the loser portfolio is
caused different results and the profits were effective in individually generates profit from zero cost portfolios. In all
January. They also found that the market risk factors– i.e. momentum strategies, beta and alpha values emphasized
market value, stock value, size, and beta factors–and that returns could be enhanced by taking a short position in
macroeconomic risk explain the return. They determined the loser‘s portfolio with regard to the winner portfolio and it
that the Islamic stock returns was a ransom only for risk also confirmed that there is no need to take more excessive
and not for a price error. risk. His paper suggested that winner minus loser‘s
Employing cross-section returns method and using a portfolio companies in the KSE do not follow the
sample of companies listed in the three different markets in momentum effect while loser‘s portfolio companies in the
the U.S. from 1963 to 2012, Alhenawi (2015) examines the KSE follow the momentum effect. His paper suggested and
interaction between momentum and size effects. In demonstrated a low and significant momentum effect on the
addition, he focused on the progress of this interaction over KSE and these results are consistent with Habib and
diverse stock market namely Nasdaq, AMEX, and NYSE. Mohsin (2012) Griffin et al. (2003), and Gharaibeh (2015)
Alhenawi (2015) reported a major shift in structure of who found that although there are no momentum profits at
equity returns during the increasing markets of the 1990s the level of firms in the Oman Stock Exchange (OSE). This
and 2000s. First, momentum absorbed the effect of size. study shows sufficient evidence of the momentum for large-
Second, the effect of momentum is stronger in larger firms, sized portfolios. The CAPM and Fama-French three-factor
not smaller ones. These patterns indicate a strong interaction model cannot explain large-sized momentum returns.
between the two effects. Possibly, in up markets, firms grow Mobarek et al. (2008) sought for evidence or returns
rapidly, and consequently, the effect of momentum and size on the Bangladesh‘s Stock Exchange (DSE) is independent
stem from a common economic phenomenon: growth. The and follows a random walk pattern. Their study focuses on
results were robust for changes in the length of the assessing whether returns on the DSE deviates from the
formation period and the use of residual return (rather than norm of efficiency. Their study includes all firms listed in
total return) to rank shares. Nevertheless, the result of the DSE daily price index, primarily during the period
Alhenawi (2015) contradicts with result of Fama and 1988-2000. The results provided evidence that the stock
French (1998) who demonstrated that there is an anomaly returns are inconsistent with the random movement patterns
in asset growth in average return on small and micro stocks, and the significant autocorrelation coefficient at various delays
but is inattentive from large stocks. rejects the null hypothesis of weak-form efficiency. This
finding is in line with the observations of various subsamples
without dispensing with stocks. This anomaly with theOmar Khlaif GHARAIBEH, Ahmad AL-KHAZALI, Ali Zkariya AL-QURAN /
714 Journal of Asian Finance, Economics and Business Vol 8 No 2 (2021) 0711–0724
efficient market hypothesis is consistent with the idea that and buy on the portfolio that have the highest unanticipated
the market does not respond to new information earnings.
immediately. This may be due to delay in the dissemination This article is structured as follows: The next section
of new price-sensitive information or biases (under or provides the data and methodological approach used in the
overreaction) in market participants‘ response to this to current study. Section 4 discusses the findings and the
information. The momentum effect associated with the robustness check. Section 5 concludes this study with a
herding in specific ‗positive feedback trading‘ or ‗trend summary of the results and discussion.
following‘ trading strategy by ordinary investors.
Zaremba (2018) investigated the effect of momentum at 3. Methodological Approach
the level of country in global stock markets. Using a sample
from 78 countries from 1995 to 2015, they tested a set of Oman stock market (Muscat Securities Market) was
potential 40 cross-sectional inter-market anomalies, some established on June 21, 1988. Bank stocks represent 60% of
of which were never been investigated. The finding show its capital, while the brokerage companies and invests the
that more than 50% of these return patterns help as reliable remaining stocks of its capital. The sample includes the
and robust sources of returns, with a convincing evidence monthly prices, size, and BE/ME ratio for all the stocks listed
that the anomalies with good performance in the past 6–12 on the Oman Stock Market (OSM) over the period from
months will be much better in the future. In addition, November 2005 to December 2018. For the market index, the
returns at the country-level strategies are weakly correlated. price of Morgan Stanley Capital International (MSCI) Oman
As a result, a portfolio that includes previous top- market index is taken. All previous data is downloaded
performing strategies can be a great opportunity for global from Datastream. A total of 107 stocks are employed in the
investors. study with observation ranges from a minimum of 70 to a
Zaremba et al. (2019) developed a new model for the maximum of 164.
success of new firms in relation to the onset of the Table 1 details the summary statistics for each of the
Brownian signal. To test the model‘s performance, they used it 107 firms included in the sample. Notably, there is a huge
to build a portfolio of firms with the goal of increasing the variation in the average and standard deviation of returns. The
likelihood that at least one firm would find a solution (IPO average monthly returns for firms range from –1.03 to 11.3,
or acquisition). Together they create tool design as a tool with a grand average monthly return of 1.39 and an average
development problem and demonstrate that greedy solution standard deviation of 14.34 for all firms. National Finance,
can be applied. They use a selective winners framework for Dhofar Fisheries & Food Industry, Flexible Indl. Packages
the problem of selecting a portfolio of startup firms. With have the highest monthly averages (over 5 per month).
the exit prospects model, they can create representative In contrast, Al Oula has the lowest average (under –1 per
portfolios that can achieve rates that can be as high as 60%, month). Concerning the distribution of returns seems to a
which is twice your firm‘s rate. wide range of kurtosis and skewness values.
In the Tunisian stock market (TSM), Boussaidi and The purpose of this study is to examine whether the
Dridi (2020) attempt to explain the momentum from two momentum effect is related to January and size effects on
hypothesis; the risk and the underreaction. For the risk, they the Omani stock market and to investigate whether the
employs the 5-factor model which is used by Fama and momentum profits can be captured by the CAPM and 3-
French (2015) to explain momentum effect. They showed factor model. A description of the strategy is provided next.
that the momentum profits cannot be captured by the 5- The research questions in this study are as follows: Is there
factor model. On the other hand, their finding support the a momentum effect at the stock level in the Oman stock
underreaction, Based on event study, news of good market for 2005-2018? Is there a momentum effect on the
earnings follows positive extraordinary returns; while news small, medium, and big size level of the Oman stock market?
of bad earnings follows negative extraordinary returns over Is the momentum is attributed to January or side effects? Can
twelve months from the date of announcement. In line with the CAPM and 3-factor model capture the momentum
the underreaction hypothesis, this implies that the market returns on the Oman stock market?
gradually corrects in the same way to the unanticipated To examine these previous research questions and to
earnings. They expanded the 5-factor model to insert a test for the existence of a momentum effect and whether the
factor related to unanticipated earnings. They showed that the short-winner (SW) on the small, medium, big level size of
momentum returns are explained by the investment portfolio that momentum strategies outperform the short-loser (SL) on the
is sell on the portfolio that have the lowest unanticipated earnings small, medium, and big level size of momentum strategies, as
well as to test whether momentum strategies are attributed to
January or side effects, the following hypotheses are tested.Omar Khlaif GHARAIBEH, Ahmad AL-KHAZALI, Ali Zkariya AL-QURAN /
Journal of Asian Finance, Economics and Business Vol 8 No 2 (2021) 0711–0724 715
Table 1: Descriptive statistics of firm stock returns in Oman
Firm Names Av. S.D. Kurt. Skew.
National Finance 11.18 1.16 100.15 9.96
Dhofar Fisheries And Food Indus 9.60 0.93 92.61 9.61
Flexible Indl.Packages 5.82 0.74 84.77 8.97
Sweets Of Oman 4.78 0.21 13.91 2.86
National Pharm.Inds. 4.71 0.44 75.28 8.31
Oman Foods International 3.94 0.35 24.62 4.15
Gulf Mushroom Products 3.71 0.22 68.76 7.74
Asaffa Poultry Farms 3.53 0.32 83.18 8.72
Oman Cement 3.47 0.21 86.21 8.80
Oman Cables Industry 3.33 0.15 6.10 0.74
Oman Filters 3.32 0.31 17.47 3.20
Salalah Mills 3.08 0.10 2.78 1.57
Al Fajar Al Alamia 2.91 0.12 33.01 5.07
Muscat Thread Mills 2.74 0.19 38.73 5.43
Oman Inv.& Fin. 2.67 0.13 0.88 0.54
Omani Euro Food Inds. 2.55 0.36 50.50 5.96
National Detergent 2.45 0.14 12.30 3.04
Oman Refreshment 2.37 0.14 29.57 4.12
Dhofar Poultry 2.33 0.16 9.28 2.05
Bank Muscat 2.26 0.18 64.18 7.14
Al Anwar Ceramic Tile 2.23 0.10 3.47 0.13
Bank Sohar 2.06 0.10 2.07 0.68
Al Jazeira Services 2.04 0.16 3.49 0.84
Al Anwar Holding 1.98 0.14 0.76 0.17
Oman Flour Mills 1.91 0.11 6.77 1.23
Urbar Hotel And Resort 1.84 0.11 65.71 7.66
National Gas 1.83 0.12 4.30 1.34
Al Maha Ptl.Prds.Mktg. 1.83 0.08 0.68 0.34
National Rlst.Dev. 1.81 0.14 58.77 7.46
Oman & Emirates Hldg. 1.75 0.20 6.58 1.77
National Aluminium Prds. 1.62 0.15 4.62 1.46
Oman Intl.Marketing 1.60 0.16 102.00 10.10
Oman Fisheries 1.57 0.16 32.62 4.56
Oman Oil Marketing 1.56 0.07 6.54 0.66
Oman Chlorine 1.47 0.09 4.08 1.35
Al Batinah Hotels 1.46 0.10 33.95 4.58
Gulf Investment Service 1.43 0.18 4.57 –0.20
Oman Nat.Engr.& Inv.Co. 1.43 0.09 4.47 1.71
Al Hassan Engineering 1.41 0.14 3.61 1.19Omar Khlaif GHARAIBEH, Ahmad AL-KHAZALI, Ali Zkariya AL-QURAN /
716 Journal of Asian Finance, Economics and Business Vol 8 No 2 (2021) 0711–0724
Table 1: (Continued)
Firm Names Av. S.D. Kurt. Skew.
Raysut Cement 1.40 0.10 3.51 –0.32
Smn Power Hldg. 1.36 0.06 6.28 2.13
Dhofar Cattlefeed 1.32 0.13 2.00 0.95
Global Financial Inv. 1.32 0.15 12.16 2.49
Gulf Intl.Chemicals 1.31 0.15 16.07 2.87
Gulf Hotels Oman 1.29 0.05 6.19 1.77
Areej Veg.Oils & De. 1.26 0.12 84.49 8.78
Sohar Power 1.25 0.10 10.64 2.19
National Secs. 1.23 0.17 22.70 3.56
Oman Fibre Optic 1.21 0.07 6.80 1.74
Shell Oman Marketing 1.15 0.06 5.15 1.09
Taageer Finance 1.14 0.11 2.61 1.22
Oman Ed.& Trn.Inv.Co. 1.14 0.12 13.80 1.22
Renaissance Services 1.09 0.12 2.21 –0.11
Oman Nat.Inv.Corp.Hldg. 1.08 0.16 2.85 0.36
Oman Chromite 1.05 0.09 13.61 2.37
Ahli Bank 1.01 0.11 5.39 1.57
Oman Orix Leasing 0.98 0.08 3.47 0.83
Oman United Insurance 0.93 0.13 1.24 0.16
Dhofar Intl.Dev.& Inv. 0.91 0.10 2.08 0.72
National Biscuit Inds. 0.90 0.08 23.08 3.19
Bank Dhofar 0.88 0.08 1.33 0.14
Al Omaniya Fnsr. 0.84 0.06 1.07 0.66
Al Kamil Power 0.80 0.08 1.84 0.71
Acwa Power Barka 0.77 0.08 28.49 3.50
Gulf Stone 0.75 0.10 3.86 –0.85
Ominvest 0.71 0.17 3.30 0.28
Al Jazeera Spct. 0.69 0.04 3.16 1.06
Salalah Port Services 0.67 0.08 12.86 2.49
United Finance 0.65 0.12 2.52 0.68
Oman Packaging 0.62 0.09 7.62 1.67
Oman Ceramics 0.61 0.20 27.31 3.55
Al Madina Investment 0.61 0.16 1.51 0.86
Muscat Finance 0.60 0.08 1.40 0.34
Financial Services 0.60 0.16 1.56 0.86
Port Services 0.59 0.10 2.50 0.21
Majan College 0.52 0.10 7.29 1.61
Construction Mats.Inds. 0.52 0.12 2.50 0.91
Al Batinah Dv&It. 0.45 0.14 12.68 2.59Omar Khlaif GHARAIBEH, Ahmad AL-KHAZALI, Ali Zkariya AL-QURAN /
Journal of Asian Finance, Economics and Business Vol 8 No 2 (2021) 0711–0724 717
Table 1: (Continued)
Firm Names Av. S.D. Kurt. Skew.
Dhofar Bevs.& Foodstuff 0.44 0.04 11.43 1.87
United Power 0.44 0.09 2.54 –0.42
The Financial Corp. 0.41 0.10 5.39 1.21
Oman Hotels & Tourism 0.40 0.06 16.75 3.14
Dhofar Insurance 0.40 0.12 6.90 1.68
Salalah Beach Resort 0.38 0.04 12.14 1.94
National Bank Of Oman 0.26 0.06 2.57 –0.89
National Mineral Water 0.22 0.14 6.20 1.81
Dhofar University 0.19 0.02 90.90 9.15
Sahara Hospitality 0.18 0.07 12.75 2.04
Majan Glass 0.17 0.04 35.85 4.90
Gulf Plastic Industries 0.15 0.10 2.18 0.88
Oman Agriculture Dev. 0.13 0.03 29.77 –0.22
Dhofar Tourism 0.13 0.03 8.10 0.74
Abrasives Manufacturing 0.12 0.05 13.69 –0.52
Computer Stationery Ind. 0.11 0.17 7.27 0.94
Al Buraimi Hotel 0.06 0.03 16.19 0.95
Hotels Man.Company 0.01 0.01 50.98 1.03
Muscat National Holding –0.02 0.10 4.80 1.15
Oman Telecommunications –0.07 0.08 10.87 1.68
National Hosplty.Inst. 50 –0.13 0.05 36.68 –3.82
Voltamp Energy –0.16 0.10 2.62 –0.01
Shurooq Inv.Services –0.18 0.08 26.53 –3.03
Hsbc Oman Bank –0.40 0.07 3.10 0.15
Omani Qatari Telecom. –0.40 0.05 1.31 0.81
Packaging Company –0.66 0.05 65.72 –7.34
Oman Textile Mills Hldg. –0.89 0.12 13.70 1.92
Galfar Engr.& Cntg. Omr1 –0.94 0.12 8.18 0.53
Al Oula –1.03 0.16 11.64 –1.03
Average 1.39 14.34
H1: SW portfolios outperform SL portfolios over their Table 1 details summary statistics for the data of all firm
holding period. stock returns in Oman obtained from DataStream. Av. in
H2: Portfolios of SW on the small, medium, and big size column two indicates the average monthly returns; S.D. in
outperform portfolios of SL on the small, medium, and big column three means the standard deviation of monthly returns.
size over their holding period. Kurtosis and skewness indicate measures of normal distribution.
H3: Momentum returns are attributed to January or size
effect. 3.1. The Momentum Strategy
H4: Momentum returns can be captured by the Model
(CAPM) and the Fama and French 3-factor model. Following the methodology developed by Jegadeesh
and Titman (1993), this study performs the construction ofOmar Khlaif GHARAIBEH, Ahmad AL-KHAZALI, Ali Zkariya AL-QURAN /
718 Journal of Asian Finance, Economics and Business Vol 8 No 2 (2021) 0711–0724
the momentum portfolios. At the beginning of every month, periods. This finding confirms the finding of Ejaz and
stocks are sorted based on the past J-month returns, for Polak (2014) who found solid evidence of the momentum
J = 3, 6, 9, and 12 months. For a given J, 25% of the most effect on the Omani stock market. To check whether the
companies in the last J-month represent a short- term previous momentum results documented in Table 2 are
winner (SW) portfolio, and 25% of the lowest return of driven by a given size class, Table 3 provides momentum
companies in the last J-month represent short-term loser returns based on size by dividing the Omani firm sample into
(SL) portfolio. There are about 26 firms in each winner and three groups; small, medium, and big-sized portfolios. To
loser portfolio. Concerning the momentum strategy, short- save space, the strategy based on J = 6 months is presented.
term winners over the previous 3, 6, 9, and 12 months should This table provides the average monthly returns of the
persist to outperform short-term losers over the subsequent selling, buying, and arbitrage portfolios of the momentum
3, 6, 9, and 12 months. So, the strategy of momentum longs strategy. Following the Jegadeesh and Titman (1993)
the SW portfolio and shorts the SL portfolio to construct the methodology, portfolios are classified where every month t,
SW-SL momentum arbitrage portfolio. Portfolios are held for and the firm stock returns in Oman are sorted based on the
the K-month retention period and K = 1, 3, 6, 9, and 12 compound return due to past J = 3, 6, 9, and 12 formation
months. months. The largest 25 are firm returns with the largest past
returns and classified in the short-term winner SW portfolio,
3.2. Momentum Strategy Based on Different Size while the lowest 25 are firm returns with the lowest past
returns and classified in the short-term loser SL portfolio. All
To form the momentum strategy based on different previous portfolios are equally weighted. SW-SL represents
sizes, this paper divided the Oman firm sample into three the momentum strategy based on buying the winner portfolio
groups: small, medium, and big size portfolios including and selling the loser portfolio. These portfolios are held for
33%, 34%, and 33%, respectively. Small, middle, and big- K = 1, 3, 6, 9, and 12-month. The simple t-statistics are
sized portfolios contain 33, 34, and 33 of Oman firm produced in parentheses.
sample respectively. Then, 4 momentum portfolios were
classified for each size in the same way as defined in section 4.2. Momentum Profits Based on Size
3.1 (the momentum strategy). Therefore, there are about 8
firms in each winner and loser portfolio. The results in Panel A, B, and C in Table 3 show large
and significant profits for all three groups - small, medium,
4. Conducting Research and Results and big-sized portfolios. For instance, the momentum
strategy with a 6-month retention period (K = 6) generates a
Section 4.1 provides the results of the momentum strategy significant profits for small, medium and big-sized portfolios
for Omani stock returns. Section 4.2 displays the profitability of 5.99% (t-stat 7.31), 7.15% (t-stat 8.6) and 5.77% (t-stat
of momentum strategy based on size to check whether 11.81), respectively. The results in Panel A, Panel B, and
momentum returns are driven by a given size class, while Panel C in Table 3 demonstrate that there is strong evidence
Section 4.3 presents robustness checks for the momentum of momentum effects that are not driven by a particular size
strategy based on the sub-period analysis. Section 4.4 shows class, unlike previous studies such as O‘Brien et al. (2010),
the January effect on momentum returns. Finally, section 4.5 Alhenawi (2015), and Gharaibeh (2015), who found that the
introduces risk-adjustment regressions. momentum effect exists only in a large-sized portfolio, while
Fama and French (2008) showed that the momentum effect is
4.1. The Momentum Strategy only evident in a micro-size and small size portfolio.
This table shows average monthly returns of the selling,
The results in Table 2 refer to the momentum strategy buying, and arbitrage portfolios of the momentum strategy.
profits (SW-SL) which is statistically significant for the The Oman firm sample is divided into three groups based on
overall K-month retention period. For instance, for the 6- their sizes; small, middle, and big. Small, middle, and big-
month formation period case with a 6-month retention sized portfolios contain 33, 34, and 33 of Oman firm sample.
period, the past short-term winner generates an average Table 2 shows how these portfolios were developed.
of 5.46 per month while the short-term loser generates The post-formation behavior of the momentum strategy
an average of –1.79 per month over the same period. The returns is also demonstrated in Figure. 1. Figure 1 illustrates
difference between the average monthly returns of the short- the sub-period post-retention cumulative monthly profits of
term winner (SW) portfolio and the short-term loser (SL) the momentum strategy with K = 1. It indicates an increase
portfolio is large at 7.25 per month (t-stat 11.57). across the first 5 months then it begins declining for the
Overall, the results in Table 2 provide strong evidence whole period. However, the strategy keeps providing large
of profitability in the momentum strategy during all holding cumulative profits.Omar Khlaif GHARAIBEH, Ahmad AL-KHAZALI, Ali Zkariya AL-QURAN /
Journal of Asian Finance, Economics and Business Vol 8 No 2 (2021) 0711–0724 719
Table 2: Profitability of momentum strategy
Holding Period Returns
J-months Portfolio K=1 K=3 K=6 K=9 K = 12
3-months SW 8.93 4.18 2.93 2.31 2.00
(9.4) (7.34) (5.93) (4.97) (4.38)
SL –5.40 –0.87 0.47 0.97 1.31
(–10.1) (–1.4) (0.74) (1.63) (2.21)
SW-SL 14.34 5.05 2.46 1.33 0.69
(14.62) (8.41) (4.65) (3.2) (1.98)
6-months SW 7.70 7.35 5.46 4.06 3.32
(8.35) (9.02) (8.34) (7.17) (6.13)
SL –3.59 –3.49 –1.79 –0.36 0.50
(–6.79) (–6.35) (–2.92) (–0.57) (0.79)
SW-SL 11.29 10.84 7.25 4.42 2.82
(12.19) (13.82) (11.57) (9.11) (7.03)
9-months SW 7.59 6.95 6.62 5.51 4.20
(7.65) (8.28) (8.63) (7.99) (6.85)
SL –2.77 –2.94 –2.63 –1.37 –0.64
(–5.03) (–5.16) (–4.27) (–2.07) (–1.04)
SW-SL 10.36 9.89 9.24 6.88 4.84
(10.31) (11.99) (12.34) (10.92) (10.09)
12-months SW 6.27 6.31 6.19 5.81 4.47
(7.44) (7.8) (7.96) (7.68) (7.87)
SL –2.37 –2.40 –2.18 –2.39 –1.69
(–4.29) (–4.36) (–3.47) (–4.11) (–2.84)
SW-SL 8.64 8.71 8.38 8.19 6.16
(10.15) (10.96) (11.04) (11.26) (11.45)
Figure 1 is done by the researcher on an excel program. This table provides the average monthly returns in
This figure demonstrates the cumulative raw profits of the percentages of the buying, selling, and arbitrage portfolios
momentum strategy for the non-overlapping retention of the momentum strategy in sub-periods. Panel A shows the
period K = 1 month, for the firm stock returns of Oman for results for the first Sub-period (April 2006 to June 2012),
60 months following the beginning of the retention period. while Panel B provides the results for the second Sub-period
(July 2012 to December 2018). Table 2 describes how these
4.3. Sub period Analysis portfolios have constructed.
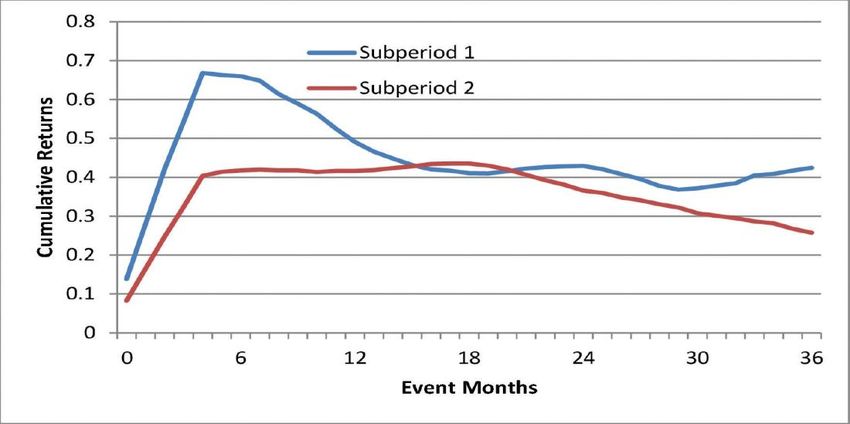
In this section, we test the stability of the momentum strategy Figure 2 illustrates the sub-period post-retention
over sub-periods by examining the momentum profits in two cumulative monthly profits of the momentum strategy
sub-periods for equal size. The first sub-period extends from with K = 1. It refers to roughly similar post-retention
April 2006 to June 2012. The second sub-period extends from period behavior in the two sub-periods. While both charts
July 2012 to December 2018. Table 3 provides the profitability largely increase across the first 5 months then begin
of the momentum strategy in these two sub periods. Only a declining for the whole period, the two sub-periods keep
strategy based on J = 6 months was introduced to save space. providing large cumulative profits.Omar Khlaif GHARAIBEH, Ahmad AL-KHAZALI, Ali Zkariya AL-QURAN /
720 Journal of Asian Finance, Economics and Business Vol 8 No 2 (2021) 0711–0724
Table 3: Profitability of Momentum Strategy Based on Different Sizes
Holding Period Returns
J–months Portfolio K=1 K=3 K=6 K=9 K = 12
Panel A: Small–Sized Portfolio
6–months SW 7.24 7.05 4.85 3.89 3.35
(5.01) (5.58) (5.44) (5.24) (4.73)
SL –3.15 –3.00 –1.14 –0.01 0.57
(–5.49) (–4.69) (–1.33) (–0.01) (0.77)
SW–SL 10.39 10.05 5.99 3.90 2.78
(7.51) (9.17) (7.31) (5.36) (4.69)
Panel B: medium–Sized Portfolio
6–months SW 7.35 6.55 5.04 3.74 2.97
(6.44) (7.42) (6.22) (5.35) (4.56)
SL –3.81 –3.78 –2.11 –0.74 0.14
(–6.28) (–6.03) (–3.07) (–1.05) (0.2)
SW–SL 11.16 10.33 7.15 4.48 2.83
(9.28) (11.27) (8.6) (6.51) (4.96)
Panel C: Big–Sized Portfolio
6–months SW 4.94 5.25 3.74 2.59 2.11
(7.27) (7.89) (5.82) (4.06) (3.17)
SL –3.54 –3.40 –2.03 –1.00 –0.48
(–4.99) (–4.68) (–2.78) (–1.35) (–0.64)
SW–SL 8.48 8.65 5.77 3.60 2.59
(13.76) (14.5) (11.81) (8.2) (6.41)
Figure 1: Cumulative Returns of the Momentum StrategyOmar Khlaif GHARAIBEH, Ahmad AL-KHAZALI, Ali Zkariya AL-QURAN /
Journal of Asian Finance, Economics and Business Vol 8 No 2 (2021) 0711–0724 721
Table 4: Profitability of Momentum Strategy in Sub Periods
Holding Period Returns
J–months Portfolio K=1 K=3 K=6 K=9 K = 12
Panel A: Sub period 1 ( April 2006 to June 2012)
6–months SW 10.06 9.54 6.73 4.84 3.66
(6.04) (6.69) (6.02) (5.14) (4.14)
SL –4.23 –4.16 –1.84 0.07 1.06
(–4.38) (–4.15) (–1.69) (0.06) (1.04)
SW–SL 14.29 13.70 8.58 4.77 2.60
(8.51) (10.09) (7.72) (5.6) (3.89)
Panel B: Sub period 2 (July 2012 to December 2018)
6–months SW 5.38 5.11 3.93 2.91 2.59
(7.81) (8.25) (6.98) (5.72) (5.15)
SL –2.96 –2.84 –1.57 –0.69 0.06
(–6.72) (–6.5) (–3.18) (–1.27) (0.11)
SW–SL 8.34 7.95 5.51 3.59 2.52
(14.85) (16.39) (13.01) (11.32) (8.53)
Figure 2: Cumulative returns of the momentum strategy in sub-periods
Figure 2 is done by the researcher on an excel program. 4.4. January Effect in Momentum Profits
This figure represents the cumulative returns of the
momentum strategy for the first and second sub-periods. This paper considers seasonal effects. The question of
The graph demonstrates the cumulative raw profits of whether momentum returns are characterized by effects of
the momentum strategy for the non-overlapping retention seasonal is inspired by the work of Jegadeesh and Titman
period K = 1 month, for the firm stock returns of Oman for (1993) and Sias (2007) which provides ample evidence of
36 months following the beginning of the retention period. effect of seasonal to increase strength of momentum profitsOmar Khlaif GHARAIBEH, Ahmad AL-KHAZALI, Ali Zkariya AL-QURAN /
722 Journal of Asian Finance, Economics and Business Vol 8 No 2 (2021) 0711–0724
and these results are along with the previous literature by and K = 6 retention period for the momentum strategy.
Conrad and Kaul (1998) and Chordia and Shivakumar These portfolios are defined in Table 2. The CAPM
(2002). They show that Winners outperform Losers in regression model is as follows:
all months except January. The findings of Jegadeesh
and Titman (1993) showed that January is evident when Rpt p p Rmt pt ,
Losers outperform Winners. These results are also
confirmed by those in Sias (2007). The results in the The Fama-French 3-factor regression model is as follows:
current study are inconsistent with this. This paper finds
that over the period from November 2005 to December
2018, the Oman stock portfolio produces January profits of Rpt p p Rmt ssmb SMBt hhml HMLt pt ,
12.20 per month (t-stat 2.46), and over the non-January
months, the portfolio provides a profit of 10.59 (t-stat Where Rpt = the portfolio‘s return, Rmt = the return on
11.71). Therefore, the momentum profits are existence in the market, SMBt = the Fama-French size factor, and HMLt
both January and non-January month. = the Fama-French book-to-market factor. The t-statistics
Table 5 provides further details on the average monthly presented in parentheses was modified for
momentum portfolio returns in percentages of the buying, heteroskedasticity using the White (1980) test.
selling, and arbitrage portfolios. The first column indicates the
overall, January and non-January average monthly returns. 4.5. Risk-adjusted Momentum Profits
Table 6 demonstrates the CAPM and Fama-French 3-
factor regression outcomes for monthly profits of J = 6 A reward for bearing risk should be taken into
consideration to examine whether these strategies provide
abnormal profits - the profits of the pure, early-stage, and
Table 5: Seasonal Momentum Profits late-stage momentum strategies are risk-adjusted applying
both the CAPM model and Fama-French 3-factor model.
SW SL SW–SL
The CAPM model contains a market factor as follows:
Overall
Rpt p p (Rmt ) pt (1)
7.70 –3.59 11.29
(8.35) (–6.79) (12.19)
Where Rpt = the independent variable the monthly return of
January the strategy portfolio p, Rpt = the monthly return of portfolio
9.79 –2.40 12.20 p at time t, for the explanatory variables, Rpt denotes
the value-weighted Oman index‘s monthly return for
(2.07) (–1.08) (2.46) month t. The monthly market returns extending from
Non– January
January 2004 to April 2014 is downloaded from OSM.
The three-factor regression is as follows:
1.66 –8.93 10.59
Rpt = ap + bp(Rmt) + bambSMB + bhmlHML + ept (2)
(0.62) (–3.81) (11.71)
Table 6: Risk-Adjusted Momentum Profits
CAPM Three–factor model
Portfolio α βrm Adj R 2
α βrm βsmb βhml Adj R2
SW 0.075 0.373 6.16 0.071 0.371 0.309 –0.015 12.39
(8.66) (2.48) (7.30) (2.82) (1.53) (–0.06)
SL –0.037 0.200 5.31 –0.033 0.200 –0.237 –0.017 17.93
(–7.26) (2.57) (–8.51) (2.78) (–2.06) (–0.19)
SW–SL 0.112 0.171 0.44 0.104 0.169 0.546 0.002 23.70
(12.30) (0.95) (10.75) (1.18) (3.33) (0.01)Omar Khlaif GHARAIBEH, Ahmad AL-KHAZALI, Ali Zkariya AL-QURAN /
Journal of Asian Finance, Economics and Business Vol 8 No 2 (2021) 0711–0724 723
Where Rmt indicates the portfolio‘s return, Rmt indicates effects. By investigating the effects of January and size, this
the market variable represented by the return on the MSCI paper addresses the subject raised recently by Yao (2012),
Oman market index, and SMBt is the Fama-French size who argued that momentum returns have risen since the
factor, and HMLt is the Fama-French BE/ME factor. The January effect. Contrary to the previous study, the current
monthly return for each retention period arises from study states that the performance of the momentum portfolio
employing the Jegadeesh and Titman (1993) model is not due to the January effect. Besides, O‘Brien et al.
overlapping portfolio methodology. The t-statistics (2010), Alhenawi (2015), and Gharaibeh (2015) found that
presented in parentheses was modified to minimize the the momentum effect exists only in a large-sized portfolio,
problem of heteroskedasticity using the White (1980) test. while Fama and French (2008) showed that the momentum
The coefficients p smb and hml are the regression effect is only evident in a micro-size and small size portfolio.
loading corresponding to the market return, size, and book- This paper showed that the momentum effect exists in
to-market factors of the model, while the alpha p (or different sizes, large, medium, and small-sized portfolios.
simply alpha) is the risk-adjusted abnormal returns of the These results help investors in the Oman stock market
portfolios over the estimation period. Abnormal profits are to invest and make profits from the momentum strategy
evident when alpha is statistically significant. The White regardless of January and company size. The findings in
test is used in the current section to be regression coefficient this paper provide new insights related to both professional
t-values corrected for heteroskedasticity. practitioners and academic researchers.
Table 6 presents the estimated regression coefficients This article also tries to understand the source of the
and the associated tvalues for the long, short, and arbitrage momentum effect. The results show that the CAPM and
portfolios denoted by SW-SL for the momentum strategy Fama-French 3-factor model cannot explain momentum
with six-month retention periods (K = 6). The alphas of the returns on the Oman stock market. This result is consistent
momentum zero-cost portfolios (SW-SL) in the two models with previous studies such as Fama and French (2008).
are big (0.112 and 0.104 per month) and they are statistically Therefore, to understand the momentum returns in the
significant (tstat 12.30, and 10.75, respectively). The long Oman stock market, this study recommends employing the
and short sides of these strategies generate significant Fama and French 5-factor model in future research. In
abnormal returns. Clearly, both the CAPM and Fama-French general, the presence of momentum profits opens up new
three-factor model cannot explain these abnormal profits. opportunities for investors and researchers using the
momentum strategy to achieve abnormal returns.
5. Research Limitations
The non-parametric momentum strategy result in this References
paper is that no consideration is taken of trading costs.
Alhenawi, Y. (2015). On the interaction between momentum effect
Trading costs are ignored because the purpose of this and size effect. Review of Financial Economics, 26, 36–46.
study is not to suggest long-short momentum strategies https://doi.org/10.1016/j.rfe.2015.03.005
for investors to use but rather to use abnormal long-short
profitability as evidence of the presence of momentum Assaf, A. (2003). Transmission of stock price movements: The case
of GCC stock markets. Review of Middle East Economics and
effect more generally.
Finance, 1(2), 171–189. https://doi.org/10.2202/1475-3693.1010
6. Conclusions Boussaidi, R., & Dridi, G. (2020). The momentum effect in the
Tunisian stock market: Risk hypothesis vs. underreaction
This paper aims to examine the existence of the hypothesis. Borsa Istanbul Review, 20(2), 178–195. https://doi.
momentum effect and its relationship to January and size org/10.1016/j.bir.2020.01.002.
effects. Besides, the current study extends the previous study Cakici, N., Fabozzi, F. J., & Tan, S. (2013). Size, value, and momentum
by applying the CAPM and three-factor model to explain the in emerging market stock returns. Emerging Markets Review,
momentum returns on the Omani stock market for the period 16, 46–65. https://doi.org/10.1016/j.ememar.2013.03.001
2005 to 2018. The current study confirms that there is strong Chan, K., Hameed, A., & Tong, W. (2000). The profitability of
evidence of momentum returns on the Omani stock market. momentum strategies in the international equity markets.
The result of this study shows that the momentum profits Journal of Financial and Quantitative Analysis, 35(2), 153–
in two sub-periods of equal size are statistically significant. 172. https://www.jstor.org/stable/2676188
The existence of the momentum effect violates the efficient Chan, L. K., Jegadeesh, N., & Lakonishok, J. (1996). Momentum
market hypothesis. strategies. The Journal of Finance, 51(5), 1681–1713. https://
To understand more about momentum profits, this paper doi.org/10.1111/j.1540-6261.1996.tb05222.x
investigates momentum profit portfolios in seasonal and sizeOmar Khlaif GHARAIBEH, Ahmad AL-KHAZALI, Ali Zkariya AL-QURAN /
724 Journal of Asian Finance, Economics and Business Vol 8 No 2 (2021) 0711–0724
Chordia, T., & Shivakumar, L. (2002). Momentum, business cycle, efficiency. The Journal of Finance, 48(1), 65–91. https://doi.
and time‐ varying expected returns. The Journal of Finance, org/10.1111/j.1540-6261.1993.tb04702.x
57(2), 985–1019. https://doi.org/10.1111/1540-6261.00449 Khan, S. (2016). Momentum strategies and Karachi stock exchange.
Conrad, J., & Kaul, G. (1998). An anatomy of trading strategies. Journal of Poverty, Investment, and Development, 26, 51–61.
Review of Financial Studies, 11(3), 489–519. https://doi. https://core.ac.uk/download/pdf/234695652.pdf
org/10.1093/rfs/11.3.489 Mobarek, A., Mollah, A. S., & Bhuyan, R. (2008). Market efficiency
Ejaz, A., & Polak, P. (2014). Short term momentum effect: A case in the emerging stock market: evidence from Bangladesh.
of Middle East stock markets. Verslas Teorija ir Paktika, 16(1), Journal of Emerging Market Finance, 7(1), 17–41. https://doi.
104–112. doi:10.3846/btp.2015.438 org/10.1177/097265270700700102
Fama, E. F., & French, K. R. (1998). Value versus growth: The Narayan, P. K., & Phan, D. H. B. (2017). Momentum strategies
international evidence. The Journal of Finance, 53(6), 1975– for Islamic stocks. Pacific-Basin Finance Journal, 42, 96–112.
1999. https://doi.org/10.1111/0022-1082.00080 https://doi.org/10.1016/j.pacfin.2016.05.015.
Fama, E. F., & French, K. R. (2008). Dissecting anomalies. The Novy-Marx, R. (2011). Operating leverage. Review of Finance,
Journal of Finance, 51(4), 1653–1678. https://doi.org/10.1111/ 15(1), 103–134. https://doi.org/10.1093/rof/rfq019
j.1540-6261.2008.01371.x O‘Brien, M. A., Brailsford, T., & Gaunt, C. (2010). Interaction
Fu, H. P., & Wood, A. (2010). Momentum in Taiwan: Seasonality of size, book‐ to‐ market, and momentum effects in Australia.
matters! Applied Economics Letters, 17(13), 1247–1253. Accounting & Finance, 50(1), 197–219. https://doi.org/10.1111/
https://doi.org/10.1080/00036840902917589 j.1467-629X.2009.00318.x
Gharaibeh, O. K. (2015). Interaction of size and momentum Rouwenhorst, K. G. (1998). International momentum strategies.
effects in Jordan firms: 2005-2014. International Review of The Journal of Finance, 53(1), 267–284. https://doi.org/10.
Management and Business Research, 4(1), 121–136. https:// 1111/0022-1082.95722
www.irmbrjournal.com/papers/1425722762.pdf Sias, R. (2007). Causes and seasonality of momentum profits.
Gharaibeh, O. K., & Al-Eitan, G. N. (2015). Is the 52-week high Financial Analysts Journal, 63(2), 48–54. https://doi.org/10.
strategy as pervasive as momentum? Evidence from Arabic 2469/faj.v63.n2.4521
market indices. Research Journal of Finance and Accounting, Smith, G. (2007). Random walks in Middle Eastern stock markets.
6(22), 68–75. https://iiste.org/Journals/index.php/RJFA/issue/ Applied Financial Economics, 17(7), 587–596. https://doi.
view/2151 org/10.1080/09603100600911200
Griffin, J. M., Ji, X., & Martin, J. S. (2003). Momentum investing White, H. (1980). A heteroskedasticity-consistent covariance matrix
and business cycle risk: Evidence from pole to pole. The estimator and a direct test for heteroskedasticity. Econometrica:
Journal of Finance, 58(6), 2515–2547. https://doi.org/10.1046/ Journal of the Econometric Society, 48(4), 817–838. https://
j.1540-6261.2003.00614.x www.jstor.org/stable/1912934
Grinblatt, M., Titman, S., & Wermers, R. (1995). Momentum Yao, Y. (2012). Momentum, contrarian, and January seasonality.
investment strategies, portfolio performance, and herding: Journal of Banking & Finance, 36(10), 2757–2769. https://doi.
A study of mutual fund behavior. The American Economic org/10.1016/j.jbankfin.2011.12.004
Review, 85(5), 1088–1105. https://www.jstor.org/ Zaremba, A. (2018). The momentum effect in country-level stock
stable/2950976 market anomalies. Economic Research, 31(1), 703–721. https://
Habib, U. R., & Mohsin, H. M. (2012). Momentum effect: doi.org/10.1080/1331677X.2018.1441045.
Empirical evidence from the Karachi stock exchange. The Zaremba, A., Mikutowski, M., Karathanasopoulos, A., &
Pakistan Development Review, 9 449–461. https://www.jstor. Osman, M. (2019). Picking winners to pick your winners:
org/stable/23734777 The momentum effect in commodity risk factors. The North
Jegadeesh, N., & Titman, S. (1993). Returns to buying American Journal of Economics and Finance, 50(C), 10107.
winners and selling losers: Implications for stock market https://doi.org/10.1016/j.najef.2019.101017You can also read