Provincial Public Residential Rental Stock - PERFORMANCE AND EXPENDITURE REVIEW PUBLIC WORKS - GTAC
←
→
Page content transcription
If your browser does not render page correctly, please read the page content below
PERFORMANCE AND EXPENDITURE REVIEW

Provincial Public Residential Rental Stock
PUBLIC WORKS

MAY 2018
Disclaimer
All care has been taken in the preparation of this document and the information contained herein has
been derived from sources believed to be accurate and reliable. Alcari Consulting does not assume
responsibility for any error, omission or opinion expressed, nor for any decisions based on this
information.

Project team
Gafee Vengadajellum
Odette Crofton
Santhurie Naidoo
Adrian Di Lollo
Ilse Martin
Saloshna Shunmugam
Serena Shunmugam
Larry Hobson
Tinashe Guramatunhu
Kate Shand

Contact details
Alcari Consulting
63 Himalaya Road, Braelyn, East London, 5209
Tel:    +27 72 800 2983
Fax:    086 583 4352
Email: gvenga@lantic.net
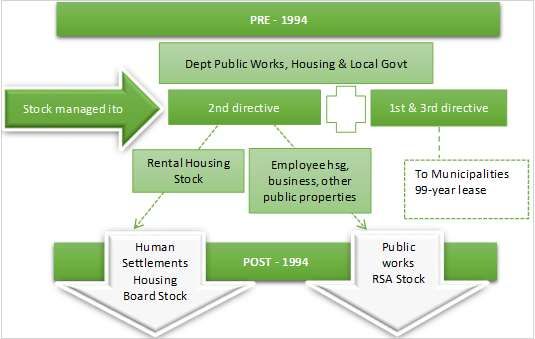
Table of Contents
1      Introduction .......................................................................................................................................... 1
2      Purpose of this study ............................................................................................................................ 1
3      Background to the provincial public works housing stock.................................................................... 1
4      Current legislative and regulatory framework...................................................................................... 2
5      Profile of the stock ................................................................................................................................ 4
6      Institutional framework ........................................................................................................................ 5
    6.1       Spheres of government and the inter-departmental matrix ........................................................ 5
    6.2       Funding flows ................................................................................................................................ 6
7      Programme analysis .............................................................................................................................. 7
8      Expenditure analysis ........................................................................................................................... 11
    8.1       Programme funding sources and flows ...................................................................................... 11
    8.2       Income and expenses.................................................................................................................. 13
       8.2.1          Income ................................................................................................................................ 13
       8.2.2          Expenses.............................................................................................................................. 13
       8.2.3          Net operating losses ........................................................................................................... 14
9      Benchmarking analysis ........................................................................................................................ 15
    9.1       Cost-to-income ratios ................................................................................................................. 15
    9.2       Comparative analysis .................................................................................................................. 15
    9.3       Key findings ................................................................................................................................. 17
10 Financial modelling.............................................................................................................................. 18
    10.1      Assumptions underlying different scenarios .............................................................................. 18
    10.2      Projected fiscal implications ....................................................................................................... 20
    10.3      Evaluation of the scenarios ......................................................................................................... 21
11     Conclusions and recommendations ................................................................................................... 22
12     Appendices ......................................................................................................................................... 25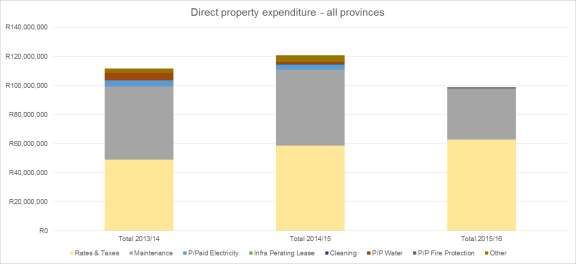
Acronym               Definition
 BAS                   Basic accounting system
 BCA                   Building condition audit/assessment
 GEHS                  Government Employee Housing Scheme
 GIAMA                 Government Immovable Asset Management Act
 GTAC                  Government Technical Advisory Centre
 PW                    Public Works

List of figures
Figure 1: History and context of the stock
Figure 2: Policy overview
Figure 3: Institutional framework
Figure 4: Funding framework
Figure 5: Chain of delivery
Figure 6: Financial model design

List of tables
Table 1: National property portfolio
Table 2: Programme elements
Table 3: Programme challenges
Table 4: Provincial public works budget allocations
Table 5: Comparison of average monthly residential rentals
Table 6: Description of base case and scenarios
Table 7: Summary of fiscal projections per scenario
Table 8: Evaluation of scenarios
Table 9: Analysis of overall cost to government of existing employee accommodation
Table 10: Summary of conclusions and recommendations

List of maps
Map 1: Density map of the public works residential rental property portfolio

List of graphs
Graph 1: Expenditure as a % of immovable assets budget
Graph 2: Rental income as a % of immovable assets budget
Graph 3: Rental collections compared to rentals raised
Graph 4: Direct property expenditure items
Graph 5: Net position per unit of the properties per financial year
Graph 6: Overall net position of the properties per financial year
Graph 7: Cost-to-income ratio
Graph 8: Maintenance cost per unit
Graph 9: Total management costs per unit per month for 2015/16
Graph 10: Summary of equitable share required to cover losses per scenario
Graph 11: Annual surplus/deficit per scenario per financial year
1 Introduction
The Government Technical Advisory Centre (GTAC), an agency of the National Treasury, was established
to support public financial management through the provision of professional advisory services,
programme and project management and transaction support. GTAC promotes public-sector capacity
building through partnerships with academic and research institutions, civil society and business
organisations. Since mid-2013, GTAC has conducted a number of performance and expenditure reviews
to address gaps and misalignment between planning, budgeting and monitoring of government
programmes and functions. These have helped the National Treasury and affected departments to better
understand the factors that raise the cost and constrain the delivery of various government functions and
services. The reviews have led to policies and programmes being refined, aligned and changed. This
performance and expenditure review focuses on provincial residential rental housing stock within the
provincial departments of public works.
2 Purpose of this study
The purpose of this study was to obtain relevant data and analyse the costs and revenues associated with
provincial government renting state-owned residential properties to private tenants in the period
2013/14 to 2015/16.
The key objectives of the project were to:
Identify and quantify all costs and revenues associated with the management of state-owned
residential rental properties by provincial governments.
Assess the quality and comprehensiveness of available data on leases and rentals.
Estimate the discrepancy between rentals charged and market-related rates that could be
obtained for similar properties.
Identify weaknesses in rent-collection systems and processes and make recommendations to
address them.
Make recommendations to improve the effectiveness and efficiency of property rental
processes.
At the outset, the study focused on all provincially owned and managed residential rental stock within the
provincial departments of human settlements and public works. After the policy and institutional analysis
and the logical framework had been completed, it became clear that while many of the programme
elements are the same, the focus and policy intention of the rental stock falling under the two national
departments was quite different. As such, the analysis and reporting had to be done separately. This
report focuses on the residential rental stock of the provincial public works departments and excludes the
provincial residential properties that form part of the public works prestige properties.
3 Background to the provincial public works housing stock
The analysis focused on provincially owned residential rental properties managed by provincial public
works departments, which are the custodians of the properties. In terms of the guidelines set out in the
Government Immovable Asset Management (GIAMA) (2007), the properties would be classified under
“property category 6: general asset, custodian, provincial residential leasehold”. Provincial public works
provides these properties to user departments for residential rental.
Typically, the residential rental housing properties are freestanding houses. There are, however, also
“road camps”, temporary housing structures, rondawels and flats. The public works residential stock is
1old; it was built between the 1950s and 1970s. At the time, Public Works was part of the housing and local
government departments. When Public Works became a separate government department, employee
housing and other public properties remained with Public Works (Figure 1).
Figure 1: History and context of the stock
Most provincial public works departments are still in the process of updating asset registers based on
audits of the stock in the provinces that have been done in stages over the last few years as funding has
become available. The occupants of the stock are a mixture of government employees, private tenants
and illegal occupants. The provinces are regularising and resolving issues relating to existing occupants in
phases.
The purpose of public works residential rental properties was to accommodate employees based in
remote locations and provide for the housing needs of essential services. The provincial public works
departments indicated that the provision and management of residential employee housing is not
understood to be a core function of Public Works. The residential properties forming part of this study are
not recorded or managed separately from other assets in the provinces, which makes the oversight,
monitoring and management of this portfolio particularly difficult.
4 Current legislative and regulatory framework
After 1994 (see Figure 2), the development of a government immovable property management policy
(2005) and strategy (2006) triggered the need to address the various issues relating to the management
and maintenance of all public immovable assets. The strategy resulted in the development of GIAMA,
which was aimed at ensuring competent management of immovable assets in national and provincial
government.
GIAMA provides a uniform framework for managing an immovable asset that is held or used by a national
or provincial department to ensure the use of the asset is aligned with the service delivery objectives of
2that department. The act requires the issuing of guidelines and minimum standards in respect of
immovable asset management by a national or provincial department. The National Treasury and national
public works introduced guidelines, but they did not specifically separate the residential properties from
other assets managed by the provinces.
GIAMA legislation was developed to detail the planning, management and disposal of government assets
in each of the provinces. Provinces developed provincial policies or directives for managing residential
housing properties. Among other things, these policies and directives covered operational management,
roles and responsibilities, allocations criteria, rent setting, rental increases, payments and disposal of
properties. The finalisation and approval of these policies took some time. Implementation of the
guidelines was slow if not stalled completely by objections and issues raised by tenants, employees and
unions in the provinces.
While the policy framework adequately covers all the key asset planning and management requirements,
it does not specifically deal with residential property management challenges and the costs and funding
implications of implementing and complying with legislation.
The Public Service Co-ordinating Bargaining Council resolution 7 of 2015 established the Government
Employee Housing Scheme (GEHS). This resolution emphasised home ownership rather than rental
accommodation, but also made provision for continued rental accommodation. It required the enrollment
of all government employees with the GEHS to be able to access the housing allowance for either home
ownership or rental from 2016. This ought to have provided a means to monitor which employees were
accessing this type of rental accommodation and to identify employees who needed rental
accommodation. However, the databases and information of the GEHS are not yet fully up to date or
accessible.
The GEHS fixed the housing allowance (R900/month at the time) for existing employees renting
government accommodation prior to 21 May 2015 and diverted any increase in the allowance to a savings
scheme for future home-ownership purposes. Communicating and introducing this within the provinces
created some confusion and resistance. It may also have led to an increased rate of rental defaults.
Provincial residential rental accommodation is also affected by the National Rental Housing Act (1999)
and legislation relating to property and lease management, stock disposal and occupant evictions.
Provinces that have pursued evictions of occupants have found the process to be very costly and are still
left with the obligation to find alternative accommodation for the occupants once eviction is granted.
Given the sociopolitical issues and management challenges relating to the properties, and that their
management is not a core provincial function, most provinces indicated a desire to dispose of the whole
portfolio.
Figure 2: Policy overview
3Constitution of RSA
White paper: Public works,
1997
National Infrastructure
PFMA
maintenance strategy
GIAMA policy DORA
Public Service Co-ordinates
Bargaining Council (PSCBC)
Government Immovable
GIAMA guidelines - recording assets
Asset Management Act PSCBC Resolution 7 of 2015 - GEHS
Land affairs act 101 of 1987 DPSA Annual circular - GEHS
Rating of state property act 79 of
Provincial budget votes
1984
State land disposal act 48 of 1961
GIAMA - C-AMP guidelines GEHS Information
EC Land Disposal Act
FS Land Admin Act
Gauteng Land Admin Act
KZN Land Admin Act
Mpumalanga Land Admin Act
Northern province land admin Act
NC Land Admin Act
NW Land Admin Act
WC Land Admin Act
Cross-cutting legislation
Rental Housing Act, 50 of 1999
Sectional titles scheme management act 8 of 2011
Prevention of illegal eviction and unlawfull occupation of land act 19 of 1998
Local government property rates act 6 of 2004
Cross cutting policy /strategy
MTSF targets
5 Profile of the stock
The various provincial public works departments have a residential rental portfolio of 6 627 units. As can
be expected from the history of the stock, the more rural provinces of Limpopo, the Eastern Cape and
Mpumalanga have the largest proportion of leases, as shown in Table 1.
Table 1: National property portfolio
Units E Cape F State G’teng KZN W Cape Limpopo M’langa N Cape NW Total
Properties 856 246 167 347 55 2 047 1 226 202 516 5 662
Units leased* 1 399 229 167 384 236 2 289 1 226 181 516 6 627
% of total 21% 3% 3% 6% 4% 35% 19% 3% 8% 100%
* In some cases, more than one unit is rented in a single property
It should be noted that the asset registers for these properties are not complete, nor is the information
on the type of unit per province. There is also no reconciliation between the asset and leasing registers.
There is more than one lease for some properties as some of them are leased out on a per-room basis.
4Average monthly rentals are R1 339 per month. Gauteng has the highest average rentals at R3 173 per
month, while average rentals in KwaZulu-Natal, Limpopo and Mpumalanga are equal to government
employees’ rental housing allowance of R900 per month.
Some provinces were able to provide information on the departments and staff levels accessing the
housing stock. Health, Transport and Education are the main users of the stock, but a wide variety of other
departments access it too. The accommodation is used by all levels of staff, from heads of department to
operational staff.
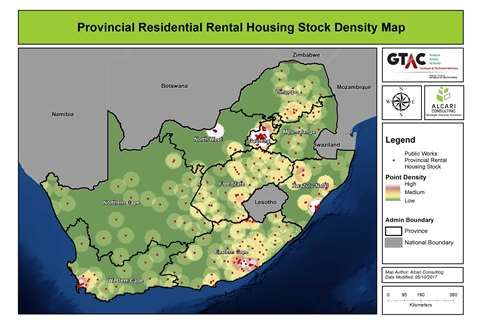
Map 1 shows that the accommodation is dispersed across the provinces, but the largest concentration is
in urban areas, where the private rental housing markets could deal with the accommodation needs of
employees. Provincial public works residential accommodation therefore does not appear to be provided
and operated in terms of its purpose.
Map 1: Density map of the public works residential rental property portfolio
The distribution of the stock throughout the provinces may also make the property management function
difficult and costly. Some provinces have regional offices that manage the properties and other assets in
the area, while others manage the stock from a central location.
6 Institutional framework
6.1 Spheres of government and the inter-departmental matrix
Figure 3 outlines the relationships between different spheres of government.
Figure 3: Institutional framework
5Parliament
Cabinet
Ministry of Public Ministry of Public Service &
Ministry of Finance
Works Administration
Dept of Public Works National Treasury Public Service &
Administration
National: Employer & Employee
PSCBC representatives / unions
Departments in
Public Works:
GEHS
Asset Management
Asset Disposal Provincial Public Provincial Treasury
Finance Works
Regional offices
Maintenance Province: Employer & Employee
HR/Corp services User Departments representatives / unions
Rental Private & Employee Tenants
Tribunals
Illegal occupants / Tenants
Municipalities
Service providers:
CBO’S & NGO’S Post Office
Property & facilities
As a separate sphere of government, provinces can use their own systems and arrangements as long as
they comply with GIAMA. National public works, which should provide advice and guidance, has
introduced some systems to assist with property management (iWorks). But as this is not compulsory, a
province may not choose to follow national directives or arrangements.
6.2 Funding flows
Funds for these properties are allocated over the three-year Medium-Term Expenditure Framework
period from each provincial Treasury to the provincial Department of Public Works via an equitable share
(Figure 4). This allocation is then apportioned to various budget components in provincial public works –
typically, immovable asset management, maintenance and capital assets. The allocations do not
distinguish residential properties from other immovable assets being managed by a province.
Figure 4: Funding framework
6Parliament
Cabinet
Ministry of Public
Works Ministry of Finance Ministry of Public Service &
Administration
Dept of Public Works Dept of Public Service &
National Treasury
Funding: Nat Administration
Budget Votes
Funding: Prov GEHS
Budget Votes
Provincial Treasury
Various Departments in Equitable
Public Works process share
operational funding &
Provincial Public
revenue Works
Enrolment to GEHS for Salary
Asset Management
Rental payment Salary deduction - State deduction - State Employee
Asset Disposal
Finance Employee Housing Allowance for Housing Allowance for Rental
Regional offices Rental
Maintenance
HR/Corp services
Private & Employee
Tenants
Municipalities (Rates & taxes)
Service providers: Property &
facilities maintenance
Asset planning and resultant funding allocations within provinces by provincial public works departments
(as the custodian of such assets) should be done using a Custodian User Asset Management Plan.
However, in most cases plans are a work in progress, as assets are audited and updated in phases as
funding becomes available. Asset planning for the residential portfolio is therefore not adequately done.
Operating funding is allocated to urgent expenditure priorities, which may be in the residential portfolio
or for other assets. Municipal rates and urgent maintenance are covered by operating funding. In some
provinces, capital improvement and maintenance have also been done. Water and electricity charges are
for the occupants’ account, but the province must cover defaults and shortfalls.
Revenues from rentals received are paid directly to the province in the case of private tenants or via salary
deduction in the case of government employees. The salary deduction from government employees is
linked to the rental housing allowance as prescribed by the GEHS.
Each province has in-house staff (funded from the equitable share) who manage the properties and
undertake urgent maintenance of these and other assets owned by the province. Some capital repairs
and maintenance are outsourced, depending on their urgency and availability of funding. In KwaZulu-
Natal, user departments are responsible for managing the properties, including maintenance and rent
collection.
No separate monitoring and accounting of the residential properties is in place. Records and information
are often lost within the province or among the different departments responsible for the stock. Manual
reconciliations are then done between the finance system and various property management systems or
Excel spreadsheets in the province.
7 Programme analysis
7The provinces’ role is to deliver property planning and management. Provincial public works is the
custodian department responsible for implementing all the programme elements outlined in Table 2.
Table 2: Programme elements
Programme elements Sub-elements
Asset planning Research, policy/legislation and programme development
Capital and operating funding
Monitoring & evaluation
Asset management review
Asset management plans & budgets
Asset management Leasing/letting management
Rental management
Lease/tenant management
Maintenance management
Facilities management
Utilities management
Asset disposal Disposal method
Property preparation
Funding the transaction
Contracting
Property transfer/conveyancing
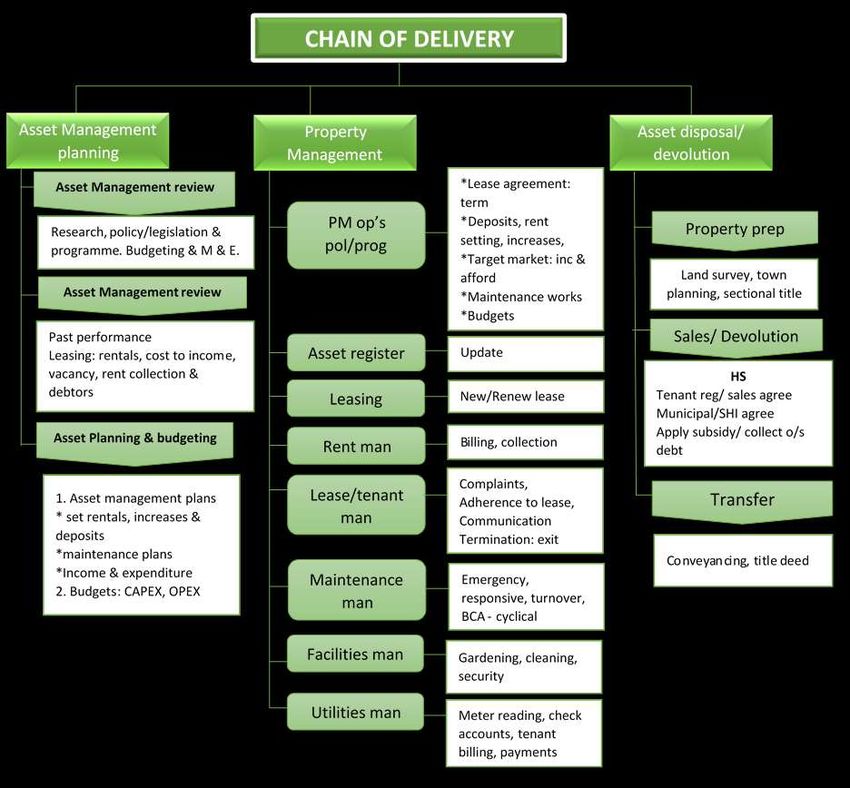
Figure 5 shows the chain of delivery. It provides more detail on programme elements and shows the ideal
property management arrangements and services required from the provinces.
Figure 5: Chain of delivery
8The model (see Appendix 1) is structured in terms of the programme elements and its sub-elements in
the chain of delivery. The outcomes relate to efficient and effective management of stock that is currently
not well managed and disposal of stock that is surplus to the departments’ needs. Key indicators are
developed to enable the departments to measure and monitor performance of the stock. The risks and
assumptions relate to poor planning, unsustainable rentals, low rent collection, and premature ageing of
the property as a result of poor maintenance, which results in an increasing cost to government over the
long term. The desired impact pertains to the original intention of the programme to provide
accommodation to employees with scarce skills in remote locations where there is a market shortage of
rental housing products.
Several issues make it difficult to properly manage the properties:
9 Various departments or sections in provincial public works deal with various functions related to
managing the properties. This makes it difficult to properly collect information and oversee,
monitor and manage the portfolio.
Government employees, tenants and the unions in the province have considerable influence in
the rental management process. They are able to organise stopping rental payments, rental
increases and any changes to the property, leasing, disposal and management arrangements.
Only two provinces have undertaken to dispose of these properties. National public works, together with
the provinces, is currently developing general guidelines for the disposal of residential and other
properties, drawing on the provinces’ experience of disposing properties through the national GIAMA task
team. Generally, properties should be disposed of at market rates, but in the case of Free State province,
the residential properties were disposed to their occupants as a donation, given the condition of the
properties and that the occupants were indigent. In Limpopo, the disposal of these properties was
stopped as the process was seen as unfairly benefiting employees who could afford to purchase them.
A summary of the programme challenges is set out in Table 3.
Table 3: Programme challenges
Issues/Challenges/Problems Consequence/s
Asset planning
Asset register incomplete Incomplete and no physical verification of assets.
Planning and budgeting cannot be properly done.
Market assessment incomplete No market assessments done as basis for rent setting.
Rentals not aligned to market rentals.
Budgeting and planning incomplete Baseline budget adjustment rather than real projection of
operating and management costs.
Lack of maintenance and maintenance planning Properties in poor state of repair. No planned maintenance,
just emergency maintenance.
Non-compliance with building and health and safety
legislation.
Premature ageing of the properties.
No facilities management: gardening, cleaning, security.
Policy implementation difficult Policies approved but cannot be fully implemented due to
tenant or union interference.
Inadequate systems and staffing capacity Provinces can decide on systems, staffing and processes for
management, reporting and oversight of the properties.
As the residential portfolio is not a core function, it
competes with other core functions, capacity and funding
required in the province.
Inefficient and ineffective property management services Provinces can decide on systems, staffing and processes for
management, reporting and oversight of the properties.
Properties are managed on an ad hoc basis.
No political will to address unsustainability of the stock Policies approved but cannot be fully implemented due to
tenant or union interference.
Historical sociopolitical issues relating to the stock make it
challenging to address.
Eviction is costly and still requires occupants to be housed by
government.
Asset management
Leasing criteria and requirements Income and affordability not considered when leasing.
Historical occupants in the stock.
Occupancy in some cases unknown Asset and occupancy audits are done in phases and
incomplete. It is not known if there is overcrowding or
10Issues/Challenges/Problems Consequence/s
subletting and if the properties are not serving their target
market.
Poor tenant behaviour: social problems No relationship and engagement with tenants.
Provincial management arrangements and staffing not set
up to be responsive to tenant management.
Rent setting and adjustments not done Non-viable rentals that are below cost recovery.
Policies approved but cannot be fully implemented due to
tenant or union interference.
No rent increases linked to inflation to cover cost increases.
Poor rent collection and unable to evict occupants for non- Bad behaviour from tenants.
payment Policies approved but cannot be fully implemented due to
tenant or union interference.
Historical sociopolitical issues relating to the stock make
these issues challenging to address.
Eviction is costly and still requires occupants to be housed by
government.
Provincial management arrangements and staffing not set
up to be responsive to tenant management.
Disposals
Transfers are not taking place for all saleable properties due Tenants do not pay anything now so do not want to take
to the challenges above transfer as then they will have to pay for maintenance and
municipal rates and services.
Policies approved but cannot be fully implemented due to
tenant or union interference.
Historical sociopolitical issues relating to the stock that make
it challenging to address.
Eviction is costly and still requires occupants to be housed by
government.
Provincial management arrangements and staffing are not
set up to be responsive to tenant management.
Long approval process for both policy and disposal process Changes in costs and requirements means sales are not
concluded and the process is restarted.
Inability to manage unfair benefit to occupants or
government employees.
8 Expenditure analysis
The expenditure analysis was conducted by analysing data and reports provided by provincial
departments relating to their property portfolio, asset and leasing registers, and basic accounting system
income and expenditure. Data sourced from the government affordable rental housing programmes and
the private market via the Tenant Profile Network was used to develop benchmarks against which to
measure the portfolio under review.
8.1 Programme funding sources and flows
Public works receives an equitable share funding allocation annually. This equitable share is divided into
portions to cover existing infrastructure, immovable assets and maintenance. The residential rental
housing properties are funded (in most provinces) from their immovable assets budget allocation. The
average of about 30% of the overall budget allocation to provincial public works departments, as set out
in Table 4, is set aside for immovable assets.
Table 4: Provincial public works budget allocations
112013/14 Budget 2014/15 Budget 2015/16 Budget
Immovable Immovable Immovable
Provincial public works Overall (R assets (R Overall (R assets (R Overall (R assets (R
budget allocations thousands) thousands) thousands) thousands) thousands) thousands)
Eastern Cape (vote 5) R2 494 472 R545 113 R2 440 883 R567 861 R3 360 235 R623 642
Free State (vote 9) R830 243 R719 056 R866 286 R738 742 R893 674 R1 076 581
Gauteng (vote 15) R1 529 044 R643 477 R1 880 117 R799 959 R2 404 609 R984 445
KwaZulu-Natal (vote 14) R1 257 040 R467 064 R1 313,705 R512 586 R1 399 466 R538 832
Limpopo (vote 9) R851 264 R535 100 R1 894 656 R531 284 R1 755 054 R581 214
Mpumalanga (Vote 8) R1 975 200 R539 108 R2 081 000 R533 688 R2 135 144 R635 655
Northern Cape (vote 5) R576 520 R64 690 R570 540 R69 095 R637 710 R109 791
North West (vote 11) R1 934 034 R68 669 R2 283 253 R10 802 R1 804 664 R13 970
Western Cape (vote 10) R2 249 842 R758 918 R2 208 490 R766 613 R3 365 523 R850 189
Total R13 697 659 R4 341 195 R15 538 930 R4 530 630 R17 756 079 R5 414 319
% 31.7 29.2 30.5
As can be seen from the graph below, the share of provincial public works immovable assets budget
allocation spent on the housing stock ranges from about 26% to 36%.
Graph 1: Expenditure as a % of immovable assets budget
Rental income received from these properties forms part of the income of the provincial public works
departments and amounts to between just 1.4% and 2.1% of their immovable assets budget.
Graph 2: Rental income as % of immovable assets budget
With income representing only 1–2% and expenses representing 25-35% of the budget allocation, one
should expect the analysis of revenue and expenses to reveal big operating deficits. This indicates that the
12provincial budget allocation is being used to fund the operating deficit of the residential property
portfolio.
8.2 Income and expenses
8.2.1 Income
Rent collected is less than budgeted, noting that adjustments had to be made in cases where provinces
had not provided for rent raised and yet received rental income. In 2015/16 this difference was
significantly less due to rental adjustments made in the provinces resulting in a reduced collection rate.
Graph 3: Rental collections compared to rentals raised
No income from sales could be identified. A reason for this is that where sales are taking place properties
have been donated. Only two provinces provided disposal data – North West and Free State – and in both,
properties were donated to the existing indigent
occupants. Writing off debt owed to the state – The Public
Finance Management Act and Treasury regulations
Debtors age analysis could not be obtained from make provision for writing off debt if:
all provinces. An analysis of debt is provided in All reasonable steps have been taken to recover
the provincial analysis where this data was the debt.
provided. Where data was provided, the age The recovery of the debt would be uneconomical,
cause undue hardship to the debtor or would be
analysis tended to show long-term growing debt
to the advantage of the state to effect a
that was not being recovered by the provinces. settlement of its claim or to waive the claim.
8.2.2 Expenses In cases where public works properties are being
Maintenance and rates and taxes are the largest rented to government employees, the requirements
for the write off would not apply. In the case of private
direct expenditure items relating to the
and/or illegal/historical occupants, this could be
residential rental housing properties. considered.
Graph 4: Direct property expenditure items
13In terms of total expenditure, where staff costs are included they form the largest expenditure item. It
should, however, be noted that staff in provincial public works departments do not just work with these
residential properties. Not all provinces provided staff costs and it was therefore difficult to determine
the staff resources and costs specifically allocated to these properties.
A formula with assumptions was used to calculate staff costs. Some assumptions were based on
information from the provinces, but these would need further interrogation and testing, with considerably
more support from provinces before they can be used as reliable estimates. Therefore, except where
otherwise indicated, further analysis excludes staff costs and sets out direct expenditure. All results in this
analysis should be read with this in mind.
8.2.3 Net operating losses
When spread across the total number of leases (6 111 in 2013/14 and 2014/15, and 6 627 in 2015/16),
the operating deficit is R676 per unit per month in 2013/14 and R542 per unit per month in 2015/16. An
operating surplus of R141 per unit per month was recorded in 2015/16 before a proportion of staff costs
was deducted.
Graph 5: Net position per unit of the properties per financial year
Net Position - per unit per month (Excl. Staff)
R2 000
R1 648
R1 523 R1 471
R1 500 R1 330
R1 106
R1 000 R847
R500
R141
R0
2013/14 2014/15 2015/16
-R500
-R542
-R1 000 -R676
Total Income Total Expenditure excl. Staff Costs Net Surplus / (Deficit) excl. Staff Costs
14Although there appears to be an improving trend in results over the three years under review, closer
examination of costs indicates big fluctuations from one year to the next in individual cost components.
Care must therefore be taken in interpreting operating surplus and deficit. In addition, the inclusion of a
proportion of staff costs would increase deficits and turn the surplus in 2015/16 into a deficit.
Graph 6: Overall net position of the properties per financial year
Net Position - Total (Excl staff)
R140 000 000 R120 848 323 R116 968 000
R120 000 000 R111 672 380
R105 737 567
R100 000 000 R81 125 000
R80 000 000 R62 119 100
R60 000 000
R40 000 000
R20 000 000 R11 230 433
R0
-R20 000 000 2013/14 2014/15 2015/16
-R40 000 000
-R39 723 323
-R60 000 000 -R49 553 280
Total Income Total Expenditure excl. Staff Costs Net Surplus / (Deficit) excl. Staff Costs
9 Benchmarking analysis
9.1 Cost-to-income ratios
The cost-to-income ratio (based on direct expenditure) indicates a ratio above the benchmark of 50%
applied by financially sustainable landlords with financing obligations. Even allowing for the fact that the
government would not have financing obligations on this portfolio, operating costs when the share of
staff costs are included would still be less than the income generated via rentals. This indicates that this
portfolio of properties is not financially sustainable.
Graph 7: Cost-to-income ratio
9.2 Comparative analysis
Maintenance cost per unit over the three financial years under review exceed the average rentals charged
on the properties, as shown in Graph 8.
15Graph 8: Maintenance cost per unit
Maintenance cost per unit per month - all provinces
R800
R714
R684
R700
R600
R500 R438
R400
R300
R200
R100
R0
2013/14 2014/15 2015/16
Operating costs per unit per month far exceed the market averages as well as the affordable rental
housing market costs, even when staff costs are excluded from the operating costs. If a fair allocation of
Public Works staff costs are included in the total operating costs, the difference becomes even larger, as
evident in Graph 9.
Graph 9: Total operating costs per unit per month for 2015/16
Summary Operating Costs p.u.p.m - 2015/16
R4 500
R3 911
R4 000
R3 500
R3 000
R2 500
R2 000
R1 500 R1 350
R950
R1 000
R500
R0
PW - Adjusted Social Housing Market
Average rentals charged by provincial public works departments are 75% lower than the going market
rate. This serves as a benefit or subsidy to occupants of the properties. Even against average affordable
rental housing or social housing rentals, public works rentals are 34% lower than affordable rental housing
rentals. Again, this serves as an unintended benefit to the occupants. The benefit to the occupants of
public works properties is set out in Table 5.
16Table 5: Comparison of average monthly residential rentals
2015/16
Average rentals Eastern Free KwaZulu- Western Northern North
compared Cape State Gauteng Natal Cape Limpopo Mpumalanga Cape West Total
PW average
rental R1 780 R1 352 R3 173 R900 R1 533 R800 R900 R1 832 R1 124 R1 488
Social housing
average rental R2 250 R2 250 R2 250 R2 250 R2 250 R2 250 R2 250 R2 250 R2 250 R2 250
Market average
rental R5 127 R4 790 R6 223 R5 914 R6 271 R6 020 R6 070 R7 432 R4 803 R5 850
PW unintended
benefit compared
to social housing R470 R898 -R923 R1 350 R717 R1 450 R1 350 R418 R1 126 R762
PW unintended
benefit compared
to market R3 347 R3 438 R3 050 R5 014 R4 738 R5 220 R5 170 R5 600 R3 679 R4 362
PW unintended
benefit compared
to social housing
% 21% 40% -41% 60% 32% 64% 60% 19% 50% 34%
PW unintended
benefit compared
to market % 65% 72% 49% 85% 76% 87% 85% 75% 77% 75%
9.3 Key findings
Provincial public works departments are providing rental accommodation at low monthly rentals for
occupants who are also mostly government employees earning an income. The occupants therefore ought
to be able to afford to pay for their accommodation on terms that are not highly subsidised. Moreover,
government provides its employees with a housing allowance to cover the cost of the monthly rental
accommodation.
Operational shortfalls in the provincial public works portfolio are covered by provincial governments’
budget allocations and represents a significant subsidy to the occupants. The occupants effectively enjoy
a better arrangement than tenants in the affordable rental housing sector. The arrangement is not
sustainable or equitable.
The provincial public works portfolio of properties is not considered a core component of these
departments and they largely no longer fulfil their original purpose. The properties are highly subsidised
by government in the form of operating costs and a housing allowance for employees who can afford to
pay for the accommodation. However, any attempt to change these arrangements is met with opposition
from government employees, placing provincial public works departments in a difficult position. The
portfolio needs to be refocused to meet the intentions of government employee rental accommodation.
1710 Financial modelling
The financial modelling set out below uses information collected about the properties forming part of this
study. The base case or existing position projects the outcome should the current situation continue
without further intervention. Three additional scenarios, using different assumptions, are modelled and
their outcomes projected.
Figure 6: Financial model design
Inputs
BAS data – income &
expenditure
Provincial asset registers
Forecast results
Provincial property
management data Based on cash flow
(asset management and
property management included)
Scenarios
A Base Case – Operations continue as is
B Scenario 1 – Disposal of all stock (either
via market, donation or mun/user dept)
C Scenario 2 – Improved management of
all stock (by province, using national PW
agency, outsourced)
D Scenario 3 – Manage some stock and
dispose non-core stock (+options for
outsourcing)
E Scenario 4 - User Creates Own Scenario
10.1 Assumptions underlying different scenarios
Table 6: Description of base case and scenarios
Scenario Assumptions Outcomes
Base case: No disposal Increasing debt
Operations continue as Low rentals High cost
is No rent increases Funded from equitable share of province
Existing low rent collection Model shows cost to government/province of
continuing to manage the stock as is over
time/per year and the related deficit and
unintended subsidy vs market and affordable
rental market
Scenario 1: Existing rental income during Disposal costs: conveyancing and related
Disposal of all stock disposal process costs
(either via market, Disposal of all stock (100% non- Rental debtors remain the same; new debt
donation or mun/user core): 1/3 donated to indigent will continue to accumulate. No sales debtors.
dept) occupants; 1/3 to middle-income Reducing in-house management cost and
occupants/employees at sale below overhead linked to unit disposal
market value; and 1/3 to high-
income occupants/employees at
market value
18Scenario 2: Increased rentals: staggered over 5 Rental debtors remain the same; new debt
Improved management years on the basis of tenant incomes will continue to accumulate. No sales debtors
of all stock (by province, Rental increases: 1/3 for low-income Reduced management costs:
using national PW earners at the inflation rate, 1/3 for outsourced/national property management
agency, outsource) middle-income earners to recover agency
operating costs, and 1/3 for high- Phase out staff costs: over 5 years, staff to be
income earners to reach market transferred
rentals Improved/reduced management/overhead
Increased rent collection rates: cost, reduced/no debt, improved rent
staggered using the base rate collection, rent increases linked to market
adjusted upwards progressively
Scenario 3: Disposal of non-core stock (70%): Rental debtors remain the same; new debt
Manage some stock and 1/3 donations to indigent occupants, will continue to accumulate. No sales debtors
dispose non-core stock 1/3 to middle-income Disposal costs: conveyancing and related
occupants/employees at sale below costs
market value, and 1/3 to high- Reduced management costs:
income occupants/employees at outsourced/national property management
market value agency
Rental increases for core stock Phase out staff costs: over 5 years, staff to be
(30%): 1/3 for low-income earners at transferred
the inflation rate, 1/3 for middle- Ratio/percentage of core vs non-core to be
income earners to recover operating disposed per province. Improved
costs, and 1/3 for high-income management required
earners to reach market rentals
1910.2 Projected fiscal implications
Table 7: Summary of fiscal projections per scenario
Total over 20 years Average loss per unit (Sales and Debtors)
Summary of Fixed Scenarios and Scenario Description
Years to Close Net Cash Flow
Outsourced Net Cash Flow 2017-
the PW Ave Rent Rental % Below Debtors Balance Net Cash Flow + Debt 2017-2037 Debtors Balance Net Cash Flow +
Scenario Rent Increase management 2037 (Equitable Share
Programme Collection % Market Value remaining w/o (Equitable Share remaining Debt w/o
from 2019/20 Utilised)
(from 2018/19) Utilised)
Total Spent From Equitable Share
Projected Scenario (Select Scenario): BC 20 Existing None 0% No -R9 121 049 764 -R625 514 807 -R9 746 564 571 -R1 489 881 -R102 175 -R1 592 056
Base Case: Operations continue as is BC 20 Existing None 0% No -R9 121 049 764 -R625 514 807 -R9 746 564 571 -R1 489 881 -R102 175 -R1 592 056
Scenario 1: Disposal of all stock (either via market, donation or mun/user dept) Sc1 5 Existing None 0% No -R1 067 501 135 -R207 624 037 -R1 275 125 173 -R174 371 -R33 914 -R208 286
Scenario 2 - Improved management of all stock (using national PW agency or outsourcing) Sc2 20 Target Increase 50% Yes -R5 094 157 432 -R1 738 471 269 -R6 832 628 701 -R832 107 -R283 971 -R1 116 078
Scenario 3: Manage some stock and dispose non-core stock Sc3 5 Target Increase 50% No -R3 457 809 034 -R593 739 837 -R4 051 548 871 -R564 817 -R96 985 -R661 802
Scenario 3: Manage some stock and dispose non-core stock Outsource Sc3 5 Target Increase 50% Yes -R2 249 741 335 -R593 739 837 -R2 843 481 172 -R367 485 -R96 985 -R464 469
Graph 10: Equitable share required to cover losses per scenario Graph 11: Annual surplus/deficit per scenario per financial year
2010.3 Evaluation of the scenarios
Table 8 provides a summary of the evaluation of the base case and three scenarios tested in the cost
modelling.
Table 8: Evaluation of scenarios
Scenario Financial and implementation implications Recommendation
Base case Significant equitable share is required to cover the operating losses on the Not recommended
portfolio. An annual deficit per financial year is also shown. The arrangement is
therefore not sustainable for the province.
Scenario 1 The disposal of all the stock relieves the equitable share funding required to Not recommended
cover operating losses and generates the most annual revenue from sale of
stock. However, employee accommodation will still be required in remote
locations and for essential services of government, which this scenario does not
address.
Scenario 2 This still requires operating losses to be covered on the portfolio but less than in Not recommended
the base case. This scenario has a smaller annual deficit per financial year than
the base case. Changes in monitoring and oversight would be required to ensure
improved management is maintained.
Scenario 3 While the equitable share funding is still required in this scenario, there is an Recommended
annual surplus for some financial years from the sale of properties. Employee
accommodation can still be offered in remote locations and for essential
government services. This is therefore the recommended scenario. The
outsourced option shows better results than continued in-house management,
but there is not a significant difference.
The scenario evaluation does not provide a clear-cut solution for the stock, as in all the scenarios modelled
a continued equitable share of operating funding will be required. Table 9 provides another way to analyse
the options: it summarises the total cost to government of providing employee accommodation (all
operating costs added together with the housing allowance provided) and compares this to market and
affordable/social housing options for employee housing. Table 9 shows that Scenario 3, especially with
outsourced management, would be 18% cheaper than putting employees in market rental
accommodation.
Table 9: Analysis of overall cost to government of existing employee accommodation
Results Scenarios
summary Total BC Total Sc1 Total Sc2 Total Sc3 Total Sc3
outsourced
Premium to government of providing employee accommodation (operating costs/funding and employee allowance)
Total cost to govt R10 509 519 364 R1 958 780 168 R6 482 627 032 R4 524 001 927 R3 113 895 649
for employee
housing over 20
years
Average units 6 122 1 224 6 122 2 694 2 694
over 20 years
Monthly cost to R7 108 R19 369 R4 367 R6 896 R4 714
govt for employee
housing over 20
years per unit per
month
21Comparison to other rental options
Cost of 20 years R8 595 385 952 R515 723 157 R8 595 385 952 R3 781 969 819 R3 781 969 819
of market rental
for all the units
Comparative 18% 74% -25% 16% -18%
(savings)/cost to
govt
Cost of 20 years R3 305 880 000 R198 352 800 R3 305 880 000 R1 454 587 200 R1 454 587 200
of social housing
rental for all the
units
Comparative 69% 90% 49% 68% 53%
(savings)/cost to
govt
It is of concern is that the current continued provision of provincial rental accommodation for government
employees (Base case) is providing a subsidy to government employees that is 69% more than the support
provided to affordable rental housing or social housing. Government employees get greater government
support for rental accommodation than low- to middle-income earners accessing affordable rental
accommodation.
11 Conclusions and recommendations
Table 11 sets out recommendations based on the above expenditure analysis, financial cost projections,
current context and programme objectives. They are largely derived from Scenario 3 – disposals of non-
core stock and continued management of core stock modelled above.
Table 10: Summary of conclusions and recommendations
Conclusion Recommendation
Policy and programme
Focus on programme intention and purpose Accommodation for essential services and employees in remote locations
only. All other user needs for residential rental accommodation can be
addressed by private rental market.
Policies too general and do not capture specifics National directives or regulations for the management of residential
required for proper residential property properties required from Treasury and/or Auditor-General to encourage
management uniformity of data, information and property management performance.
Inadequate programme funding Programme funding should allow for completion of asset and occupant
audits and proper management of the stock to comply with legislative
requirements. Separate stock from other assets managed by the
province.
Lack of uniform, efficient and effective National directives from Treasury are required to provide for uniform
programme oversight and monitoring management and provision of information on the residential rental
housing programme. Notably, operating costs as well as rental revenue
need to be captured and tracked for this portfolio as a start, preferably in
a common property management system linked to BAS and GEHS
databases.
Government employee benefits need to be Government employee rental benefits are significantly higher than the
aligned with and benchmarked against other affordable rental housing sector and this needs to be addressed via GEHS
government programmes and policies and and national/ provincial negotiating structure.
comparative sectors Regular benchmarking is required with market-related rental housing
provision.
Consider alignment between province and municipal employee rental
housing benefits.
22Compare benefits with private employee housing benefits for
benchmarking purposes.
Asset planning
Improved asset planning and budgeting required Asset and occupant audits need to be completed to identify core and non-
core stock and residential rental housing asset management strategy per
province.
Improved budgeting for operating and revenue Operating costs and rental revenue need to be captured and tracked for
this portfolio as a start, preferably in a common property management
system linked to BAS and GEHS databases.
Separate stock from other assets managed by the province.
Review overall efficiency and effectiveness of Review overhead costs, staffing allocated to the stock, and outsourcing
systems, processes and management costs and options.
arrangements for the stock
Enrolment and information sharing with GEHS This will provide a proper indication of demand for rental accommodation
to inform supply from Public Works.
Improved rental setting and rental increases Implementation of policies using market rental assessments for rent
setting and rent increases.
Ensure rentals cover at least operating costs of properties.
Asset management
Focus on government employees only in terms of No private tenants should be included in the core stock.
policy intentions Outsource non-core functions with performance requirements.
Uniformity in property management systems and Review overhead costs, staffing allocated to the stock and outsourcing
processes costs and options.
Encourage a common property management system linked to BAS and
GEHS databases.
Separate stock from other assets managed by the province.
Improved property and lease management Set targets for key rental indicators such as rental collection rates and
debtor collection. Monitor indicators regularly.
Guidelines and directives on property and lease management from
province or National Treasury.
Asset disposal
Uniform approach to disposals in line with policy No undue benefit to employees who can afford to purchase non-core
and legislation stock at market rates.
Encourage disposal of non-core historical stock – dependent on
completion of asset and occupancy audits.
Manage extent of interference by unions in the process through GEHS,
national and provincial structures.
Oversight and monitoring of disposals Once audits are completed, medium-term targets can be set to monitor
disposal of non-core properties.
The study recognises that implementing any of the scenarios will require careful planning covering a range
of issues in policy development, asset planning, asset management and asset disposal. Political support in
the face of resistance will be needed. In order to effect the necessary changes, it should be made clear
that the focus of the public works rental accommodation is to only provide employee accommodation for
essential services and in remote locations.
Significant improvements in the planning and management of the residential rental properties will require
specific directives from the National Treasury and/or the Auditor-General. These must be directed
specifically at facilitating uniformity in the information reported, oversight and monitoring of the property
management and property disposals of the stock. It also needs to be recognised that while guidelines
support the directives, they cannot on their own effect the necessary changes.
The influence of tenants and employees on the stock needs to be managed via GEHS processes and
employee/employer negotiations. Comparative information on the cost to government of providing
23residential rentals, as outlined in this analysis, can assist government to focus its efforts and gain
acceptance for the need to effect change and curb interference in asset and property management
practices in provinces.
2412 Appendices
1. Logical framework
2. Expenditure analysis
3. Cost model
4. National and provincial maps
5. Rental housing market report
6. Reference materials and information
7. Data reliability and validity
25You can also read