Property Market Report Queensland - Q2 2019 - Preston Rowe Paterson
←
→
Page content transcription
If your browser does not render page correctly, please read the page content below
IN THIS ISSUE
Economic Snapshot 3
Office Market 4
Brisbane CBD 4
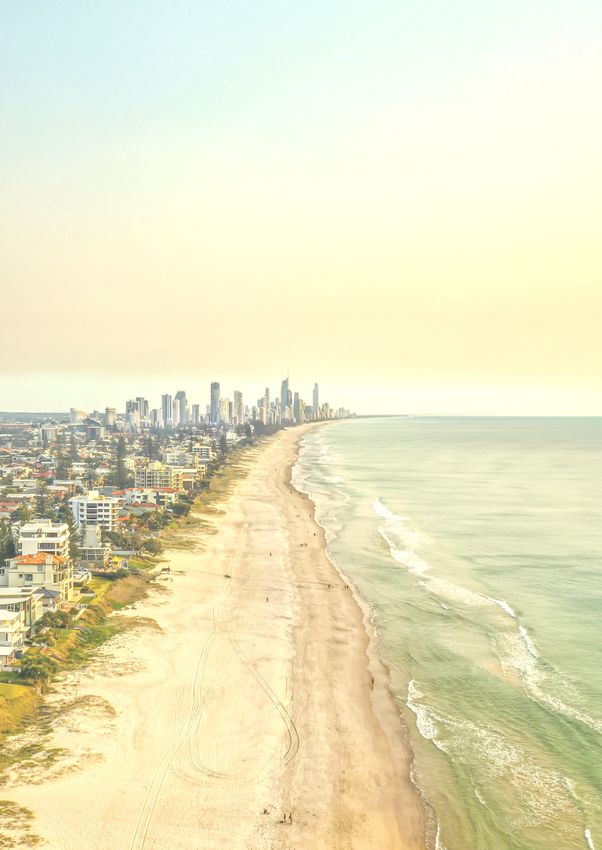
Gold Coast 5
Retail Market 6
Industrial Market 7
Residential Market 8
Greater Brisbane 8
Regional Queensland 10
Rural 11
Hotel and Leisure Market 11
Property Market Report Q2 2019
Queensland
Queensland’s industrial
  market continues to
 perform considerably
 well over the quarter                                     Brisbane’s CBD office
   supported by it’s                                       market vacancy rates
geographic exposure to                                    contracted by –0.7% to
   export industries.                                         11.3%, showing a
                                                           tightening trend over
                                                             the last 24 months.

                              The Greater Brisbane
                           residential median prices
                           decreased –1.5% over Q2
                          2019 but still up 1.3% YoY,
                             supported by affordable
                          housing and the highest rate
                            of net migration of all the
                              states (24,700 people).     Highlights

                                                                                 Queensland’s retail
                                                                                market recorded it’s
                                                                               highest ever sale of a
                                                                                    freestanding
                                                                                    supermarket,
                                                                               commanding a low 5%
                                                                                  yield helped by a
                                                                               growing global demand
                                                                                  for secure assets.
Economic Snapshot
Cash Rates % Interest Rates E change Rates per
4.00% ¥94.0 0.800
90 Day Bank Bill Rate Australian 10 Yr Bond NSW Treasury 10 Yr Bond
¥92.0 0.750
1.0 1.5 1.5
Cash Rate 5 Yr Swap Rates
3.50% ¥90.0 0.700
¥88.0 0.650
3.00%
¥86.0 0.600
2.50% ¥84.0 0.550
ul 2019 Mar 2019 ul 2018 ¥82.0 0.500
2.00% ¥80.0 0.450
¥78.0 0.400
Consumer Price Inde 1.50%
¥76.0
A$1=JPY (lhs)
0.350
ustralian ll Groups
A$1=USD (rhs)
¥74.0 0.300
1.00% A$1=GBP (rhs)
¥72.0 0.250
A$1=EUR (rhs)
0.50% ¥70.0 0.200
un 2019
Jul-18
Jan-19
May-19
Jul-19
Sep-18
Nov-18
Mar-19
May-2019
Oct-2018
Dec-2018
Apr-2019
Aug-2018
Sep-2018
Jul-2018
Nov-2018
Jun-2019
Jul-2019
Jan-2019
Feb-2019
Mar-2019
114.8
0.6%^
estpac - Melbourne Institute N ob Series Newspaper N B Business
Consumer Sentiment Inde and Internet ob ds Confidence Inde
Mar 2019 108 185,000 8.0
114.1 106 180,000 7.0
7.0
106.1
7.0
7.0
175,000
178,322
104 6.0
177,241
0.0%
175,905
175,726
175,555
175,428
104.4
104.3
170,000
103.8
103.6
102 5.0
171,392
169,568
165,000
5.0
5.0
101.5
100 4.0
101.3
166,509
166,464
100.7
100.66
100.5
160,000
4.0
99.6
98
161427.00
3.0
159717.00
98.8
Dec 2018 155,000
3.0
3.0
3.0
96 2.0
114.1
150,000
96.5
152,689
2.0
2.0
94 1.0
145,000
-0.1
92
0.5%^ 140,000 0.0
-0.1
90 135,000 -1.0
Jul-2018
Jan-2019
Apr-2019
Jul-2019
Oct-2018
Apr-2019
Jul-2018
Jan-2019
Jul-2019
Oct-2018
Jul-2018
Apr-2019
Jul-2019
Jan-2019
Oct-2018
Housing Loan
Lending Rates Indicator Share Prices and Indices
6.5%
6.0%
5.5% 5.20%
5.0% -0.22
4.94%
Mortgage Managers
-0.42
4.5%
Banks – St andard
4.0% Banks – 3 year fi ed
3.5% -0.58
3.41%
3.0%
Business Loan Private Sector
Lending Rates Indicator Dwelling pprovals Investment
Dwelling pprovals monthly Non-Residential pprovals m monthly Dwelling Investment m quart erly
7.5%
Jun-2019 13,946 Jun-2019 3272 Mar-2019 25,887
7.07% May-2019 14,244 May-2019 3,113
7.0%
-0.27 Apr-2019 13,991 Apr-2019 2,394
6.5% Small Business - Mar-2019 14,603 Mar-2019 2,389 Dec-2018 26,548
Other
6.20% Feb-2019 16,996 Feb-2019 2,803
6.0%
-0.27 Jan-2019 14,279 Jan-2019 2,538
Small Business - Dec-2018 13,907 Dec-2018 Sep-2018 27,335
5.5% Small Business - 2,306
Residential Secur ed
3 Year i ed Rate Nov-2018 15,055 Nov-2018 2,984
5.0% -0.44 Oct-2018 16,727 Oct-2018 2,839
Sep-2018 16,849 Sep-2018 2,174 Jun-2018 27,153
4.5% 4.66%
Aug-2018 16,155 Aug-2018 2,868
4.0% Jul-2018 18,038 Jul-2018 4,061
Jun-2018 18,696 Jun-2018 2,545 Mar-2018 26,711
Banks - Standard Banks - 3 Year Fixed Mortage Managers
0 5,000 10,000 15,000 20,000 500 1,500 2,500 3,500 4,500 15,000 20,000 25,000
^ percentage change from previous quarter
* Based on ABS CPI released 31 July 2019
** Based on ANZ Job Advertisement Series released 6 August 2019
*** Based on NAB Monthly Business Survey released 13 August 2019
# Date of Publication figures based on those available at 14 August 2019
N.B. This data is compiled using publicly available publications which are produced in arrears to the current month.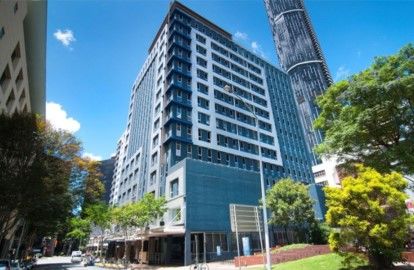
Office Market
Brisbane CBD
Supply and ithdrawals
Brisbane CBD Additional Supply and Withdrawals
120,000 Over the six months to July 2019, Brisbane CBD office market
115,134
Supply Additions Withdrawals
experienced a stock withdrawal of 15,417 sqm due to the
100,000
demolition of both the Brisbane Transit Centre on 151-171
Roma Street and the State Service House on 96 Albert St.
80,000
Stock (sqm)
115,134
No supply additions were recorded over the last 18 months,
57,676
60,000
resulting in a net decreased stock of 0.63% to 2,211,600
36,096
40,000
sqm. However, moving forward we’re expecting to see over
42,642
150,000 sqm come online over the next coming years.
47,700 sqm of office space will soon come online in Q3 this
10,596
20,000
9,979
9,118
8,910
36,096
18,303
year due to the completion of 300 George Street, followed
16,306
16,306
3,613
57,676
75,853
2,800
42,642
583
0
0
0 0 by Dexus’ Annex Building on 12 Creek Street, which will add
Jan-15
Jan-16
Jan-17
Jan-18
Jan-19
Jul-14
Jul-15
Jul-16
Jul-17
Jul-18
Jul-19
7,200 sqm to the market in early 2020. An additional 72,540
Source: PCA/Preston Rowe Paterson Research
Chart 1— Brisbane CBD Office Supply and Withdrawals
sqm is also estimated to complete in 2021 from Mirvac’s 80
Source: PCA / Preston Rowe Paterson Research
Ann Street, while 50,000 sqm is mooted for 205 North Quay.
The total 164,540 sqm new supply over the long term will
Tenant Demand Vacancy Rates
Brisbane CBD Vacancy Rate likely test the strength of the Brisbane CBD office market.
27.5
Premium Grade A Grade B Grade C Grade D Grade Although, demand may increase to absorb supply, according
25.0
to Oxford Economics; Queensland’s economic growth is
22.5
20.0
expected to outpace Victoria and NSW over the next 5 years,
driven by population growth, infrastructure investment and
Vacancy Rate (%)
17.5
15.0 export industries.
12.5
10.0 Total vacancy contracted by –0.7% to 11.3% over the six
7.5 months to July 2019, showing a tightening trend over the
5.0 last 24 months. Primary office vacancy continues to
Jan-15
Jan-16
Jan-17
Jan-18
Jan-19
Jul-14
Jul-15
Jul-16
Jul-17
Jul-18
Jul-19
outperform secondary offices with vacancy rates about 8.7-
9.9% while secondary vacancies remain elevated between
Chart 2— Brisbane CBD Office Vacancy Rates by Grade
Source: PCA / Preston Rowe Paterson Research
14.5-18.8%.
Stock by Grade Source: PCA/Preston Rowe Paterson Research
Investment ctivity
Brisbane CBD Office Stock by Grade as at January
2019 30 Makerston Street, Brisbane QLD 4000
Sydney CBD Office Stock by Grade
2.4% $103 million
3.6%
8.6% 15.2%
9.0% 7.85% Net Yield
23.1%
Premium
Premium $6,726 per sqm lettable area
A-Grade
A-Grade
7.7% B-Grade B-Grade $6,547 per sqm lettable area
31.4% C-Grade C-Grade
D-Grade Sentinel Property Group has bought the Makerston House office tower in the Brisbane CBD’s
D-Grade
36.6% ‘north quarter’ from ASX listed Challenger. The property, which will be held within Sentinels
42.4%
Regional Office Trust comprises of almost 15,000 sqm of lettable area spread over 13 levels of
Source: PCA/Preston Rowe Paterson Research
office space. At the time of sale the property was fully leased to tenants including the
Queensland Government and Queensland Rail with a weighted average lease expiry of 4.63
Source: PCA/Preston Rowe Paterson Research years. The deal follows Brisbane recording the largest drop in office vacancy compared to any
Chart 3— Brisbane CBD Stock by Grade
Source: PCA / Preston Rowe Paterson Research other state capital in the six months to February. The property is located in close proximity Cross
River Rail Network, which is currently under construction and the Roma Street Train Station.
Queensland Property Market Report | Q2 2019 4Gold Coast Gold Coast Supply Additions and Withdrawals
Supply and ithdrawals 14,000
Supply Additions
13,422
Withdrawals
12,000
The supply of new office space in Gold Coast remains low
11,305
throughout the first half of 2019, with no additions over the 10,000
10,015
year to July 2019. However, additional supply outlook is
Stock (sqm)
8,867
8,000
expected to pick up in the medium term. The Property
6,000
Council of Australia's (PCA) Office Market Review July 2019
reported an additional 9404 sqm to be completed by the end 4,000
4,548
of 2020. Stemming mainly from Acuity Business Park—
2,824
2,000
2,800
2,744
2,741
Building 1 (5,937 sqm) due to be complete Q3 2020 and the
1,428
1,200
800
969
892
635
0
0
0
0
0
0
0
0
full refurb of 33 Scarborough St (2,832 sqm) due to be
Jan-17
Jan-15
Jan-16
Jan-18
Jan-19
Jul-14
Jul-15
Jul-16
Jul-17
Jul-18
Jul-19
complete the same time. As well, an additional 8,727 sqms is
mooted for down the road. Chart 4— Gold Coast Total Office Supply and Withdrawals
Source: PCA / Preston Rowe Paterson Research
Gold Coast Commercial Vacancy Rates
Tenant Demand Vacancy Rates 30.0
A Grade B Grade C Grade D Grade
27.5
The total vacancy in Gold Coast's office market increased by 25.0
Vacancy Rate (%)
1.4% to 12.9% over the six months to July 2019, driven by an 22.5
increase in A Grade (2.4%) and C Grade (2.8%) vacancies. 20.0
While there is an expected increase in vacancy rates in the 17.5
medium term as new office stock comes online, over the 15.0
12.5
long term the Queensland Government indicates an average
10.0
2.0% annual growth in population over the next 25 years
7.5
and continued infrastructure investment will likely boost
Jan-15
Jan-16
Jan-17
Jan-18
Jan-19
Jul-14
Jul-15
Jul-16
Jul-17
Jul-18
Jul-19
demand.
Chart 5— Gold Coast Vacancy Rates by Grade
Source: PCA / Preston Rowe Paterson Research
New Developments Investment ctivity
Stage of Net Lettable Completion
Project Market Owner
Development rea SQM Date
201 Charlotte Street,
Shayher Group / Bao Jia
300 George Street Brisbane CBD Construction
Development
47,700 Q3 2019 Brisbane QLD 4000
nne Building Brisbane CBD Construction Dexus Property Group 7,200 Q1 2020
$126.7 million
80 nn Street Brisbane CBD Construction M&G Asia Property Fund 72,540 2021+
205 North Quay Brisbane CBD Early Feasibility Neilson Properties 50,000 2021+ 5.94% Yield
cuity Business Park Gold Coast Construction Robina Land Corporation 5937 Q3 2020
$4,205 per sqm lettable area
cuity Business Park Gold Coast Early Feasibility Robina Land Corporation 3627 Mooted
Fortius Funds Management and two
The Base Gold Coast Early Feasibility Robina Land Corporation 5,100 Mooted
private funds managed by Blackrock
Chart 6— Brisbane CBD and Gold Coast New Developments
Source: PCA / Preston Rowe Paterson Research have sold the A-Grade Charlotte’s street
office tower to Sydney based property
280 Elizabeth Street, Telstra has offloaded its telephone exchange development and investment group
Brisbane QLD 4000 building in Brisbane’s ‘Golden Triangle’ precinct to Kyko Group. The property transacted on
Singaporean investment group Firmus Capital. The an initial yield of 5.94%, 87% occupancy
10,600 sqm property is fully leased by Telstra. The and a WALE of five years. Major tenants
$57 million
net annual income for the property is $3.18 million, in the 13,291 sqm office tower include
5.57% Yield equating to a yield of 5.57%. Situated on an 11,670 nglo merican Metallurgical Coal.
$5,377 per sqm lettable area sqm site the property lends itself to potential The recently refurbished property
redevelopment. The site can be redeveloped to the comprises an F45 gym, childcare
6,547 per sqm lettable area
Brisbane CBD’s maximum height limit of 274 metres. facilities, café and a valet car service.
Queensland Property Market Report | Q2 2019 5Retail Market
Over the quarter to June 2019, Queensland's seasonally adjusted retail turnover increased by
+0.67 per cent (or +5.53% YoY) to $5.506 billion. The largest increase in retail turnover is seen in
the Café, restaurants & takeaway foods category (+10.06%). The year on year growth in
Queensland’s retail turnover continues to be driven by consistent interstate migration and
improving tourism arrivals into the state.
Queensland neighbourhood shopping centres are becoming popular for investment as we see a
global trend of investors seeking higher yields. Preston Rowe Paterson recorded the sale of 346
Gympie Rd, Kedron by Coles Group for $34.24mil, a record for the highest sale of a freestanding
supermarket in Queensland.
Queensland Year on Year Retail Turnover by Sector
2750.0 12.0%
Jun-2019 % Change over the Year
2500.0
Monthly Turnover ($million)
2250.0 10.0%
% Change Over the Year
2000.0
8.0%
1750.0
1500.0
6.0%
1250.0
1000.0
4.0%
750.0
500.0 2.0%
250.0
0.0 0.0%
Food Retailing Household goods Clothing, Footwear Department Stores Other Retailing Cafe, Restaurants &
& Personal Takeaway Food
Accessories Services
Chart 7— Queensland Year on Year Retail Turnover by Sector
Source: ABS / Preston Rowe Paterson Research
Investment ctivity
Source: ABS/Preston Rowe Paterson Research
97 lockton Street, 346 Gympie Road,
Everton Park QLD 4053 Kedron QLD 4031
$34.24 million
$42.5 million
Low 5% yield
8.4% yield
$8,368 per sqm lettable area
$4,479 per sqm lettable area
The Coles Group has continued their sell
A private West Australian syndicate of down of retail assets to redirect capital
investors has purchased a in to further investment into its
neighbourhood shopping centre in operating business. This has led to the
Brisbane’s north. The North West Plaza sale and leaseback of a 4,092 sqm
comprises 9,489sqm of lettable area on property comprising a Coles
a 30,800sqm site. In addition to re- Supermarket, Liqourland and a Coles
structuring the tenancy mix. EG invested E press service station. Combined, the
$2.4 million worth of capital upgrades fully leased centre sold on a yield in the
including a new entrance, paving and low 5% range and with a weighted
new machinery. average lease expiry of 14.7 years.
Queensland Property Market Report | Q2 2019 6Industrial Market
Queensland’s industrial market continues to perform considerably well over the quarter
99 Sandstone Place,
supported by it’s geographic exposure to export industries. The devaluation of the Australian Parkinson QLD 4115
dollar has elevated exports out of Queensland by 17% year on year to $86.98 billion, largely
driven by coal, natural gas and agricultural products. As of June 2019, yields continue to
compress to between 6.0% - 6.9% for prime and 7.05% - 7.85% for secondary, with the largest
core assets like 99 Sandstone Place, commanding yields of 5.6%, due to the high demand from
offshore investors.
Investment ctivity
$134.2 million (50% stake)
168 nton Road, 425-479 reeman Road,
Hemmant QLD 4174 Richlands QLD 4077 5.6% Yield
$37.75 million
Singapore’s Frasers Logistics and
8.08% Yield Industrial Trust have sold a 50% stake
in the Coles cold storage and
$1,198 per sqm wet lease area
distribution centre in Parkinson,
$592 per sqm land area Queensland. Global investment
manager DWS, acquired the property
Sentinel Property Group has acquired a $26.5 million
on a yield of about 5.6%, representing
63,811 sqm industrial site on the
$1,313 per sqm lettable area the largest individual sale by value for
Brisbane River with an exclusive
a cold storage facility domestically –
31,501sqm of wet lease area. The Dexus, through the Dexus Australian
assuming the sale was taken at 100%.
property is anchored by tenancies to Logistics Trust (DALT), has settled on a 9.5
The distribution centre was built for
Boral, Hanson and Holcim and Yamba hectare industrial infill development site in
Coles in 2008 and is the businesses
Shipping and Monadelphous, who Richlands industrial precinct. The property
only such facility in Queensland. The
currently use the site and wet lease area comprises five adjoining, separately titled
Parkinson facility is located within the
to hold and distribute sand dredged lots, with areas ranging from 8,800 sqm to
Southlink Business Park and 29 km
form Morton Bay as well as concrete 54,000 sqm. The fund is planning to
south of Brisbane’s CBD.
batching. The deal between Sentinel and construct a 55,000 sqm industrial facility,
the private seller reflected a passing with a flexible design to suit varying
yield of 8.08%. tenancy sizes.
Queensland Property Market Report | Q2 2019 7Residential Market
Building pprovals Brisbane Dwelling Approvals
The Australian Bureau of Statistics (ABS) recorded a 2.93% increase 40,000
Brisbane Houses Brisbane Other Dwellings
from March to June quarter (to 10,088) in total building approvals in 35,000
the Greater Brisbane region in 2019.
30,000
Dwelling Approvals
From the recorded 10,088 approvals in Greater Brisbane, approvals for 25,000
houses increased close to 5,394 approvals while approvals for units
20,000
increased by 53.24% to 3,651 approvals since the last quarter.
However, overall year to year approvals are still down -48.04%, relative 15,000
to same time last year. 10,000
The total dwelling approvals in 2018 marked a record 4-year low in 5,000
Greater Brisbane. Though there are early signs there could be a pick- 0
up in demand due mainly to recent interest rate cuts, continued 2014 2015 2016 2017 2018 YTD 2019
interstate migration and infrastructure development. Chart 8— Brisbane Dwelling Approvals
Source: ABS / Preston Rowe Paterson Research
Greater Brisbane
Market ffordability
oning
Map
The Real Estate Institute of Australia (REIA) reported that over the June 2019 quarter, Brisbane’s
residential
Source: market
ABS / Preston has softened.
Rowe Paterson Research Overall, Brisbane's median house prices recorded a -1.5%
decrease to $527,000, while still up 1.3% year on year despite the softening residential market
nationally. In part, Brisbane remains more affordable compared the other Australian capital
cities, such as Sydney and Melbourne, and according to the ABS had the highest rate of net
interstate migration (at 24,700 people).
Inner and Middle Brisbane saw median house price decrease by –3.6% (to $780,000) and –1.2%
(to $620,000) respectively over the quarter to June 2019. While, on the contrary, Outer Brisbane
median house price increased by 1.1% to $414,500 although all recorded a marginal increase
year on year besides Inner Brisbane at –3.4% YoY.
The sales of unit dwellings, on the other hand, saw overall median unit price in Brisbane decline
-3.0% to $402,500 over the same period with Inner and Middle Brisbane recording –0.1% and –
1.3% decline to $459,500 and $375,000 respectively. Outer Brisbane fell the most, decreasing by
Chart 9— Greater Brisbane Zoning Map
Source: Preston Rowe Paterson Research –4.2% to $300,000.
Median House Price by Zone over Jun Quarter 2019 Median Unit Price by Zone over Jun Quarter 2019
$900,000 2.5% $500,000 2.0%
Median House Price Quarterly % Change Median Unit Price Quarterly % Change
$800,000 $450,000
1.1% 1.5% 1.0%
Quarterly Percentage Change (%)
$400,000
Quarterly Percentage Change (%)
$700,000
-0.1%
0.5% 0.0%
$350,000
$600,000
Median Price
Price
$300,000
-0.5% -1.3% -1.0%
$500,000 -1.2%
$250,000
Median
$400,000 -1.5% -2.0%
$200,000
$300,000
-2.5% $150,000 -3.0%
$200,000
$100,000
-3.6% -4.2%
-3.5% -4.0%
$100,000 $50,000
$0 -4.5% $0 -5.0%
Brisbane Inner Brisbane Middle Brisbane Outer Brisbane Inner Brisbane Middle Brisbane Outer
Source: REIA/Preston Rowe Paterson Research Source: REIA/Preston Rowe Paterson Research
Chart 10— Greater Brisbane Median House Price by Zone Chart 11— Greater Brisbane Median Unit Price by Zone
Source: REIA / Preston Rowe Paterson Research Source: REIA / Preston Rowe Paterson Research
Queensland Property Market Report | Q2 2019 8Rental Market
Median Weekly Rents for Houses by Zone as at Jun 2019
In terms of rent, houses in Brisbane had a mixed performance but $800
overall better than units. Median unit rents in Brisbane remained 2 Bed House 3 Bed House 4 Bed House
$700
relatively unchanged over the quarter to June 2019.
$600
Median Weekly Rent
Inner Brisbane houses experienced varied quarterly rental growth.
$500
Median rent for 3 bedroom declined by –3.8% to $510 weekly while 2
$400
bedroom and 4 bedroom increased 2.3% (to $450 per week) and 2.8%
(to $740 per week) respectively. 4 bedroom houses in this zone $300
performed best year on year as well, recording a 5.7% increase. $200
All median rents in Middle Brisbane decreased over the quarter, 2 $100
bedroom –2.6% (to $375 per week), 3 bedroom –1.2% (to $420 per $0
Brisbane Inner Brisbane Middle Brisbane Outer
week) and 4 bedroom –3.8% (to $500 per week).
Chart 12— Greater Brisbane Median House Rent by Zone
Source: REIA / Preston Rowe Paterson Research
On the contrary, house rents in Outer Brisbane has remained the same
from the last quarter, with 2, 3 and 4 bedrooms remaining at $295,
$345 and $400 respectively. Median Weekly Rents for Units by Zone as at Jun 2019
$700
1 Bed Unit 2 Bed Unit 3 Bed Unit
Median weekly rents for units in Brisbane saw an overall decline. Inner $600
Brisbane's had a mixed result with 2 bedroom rents declining by –
$500
Median Weekly Rent
2.1% to $470, while 1 bedroom rents increasing 2.8% to $370 and 3
bedroom remaining at $600 per week. Rents in Middle Brisbane $400
declined with 1 and 2 bedroom rents declining over the quarter to
$300
June 2019 by -1.7% and -2.6% to $260 and $370 weekly, while 3
bedrooms remained at $420 per week. $200
Finally, 1 and 3 bedroom rents in Outer Brisbane declined –4.2% to $100
$230 and –1.5% to $335 weekly, while remaining resilient is 2 $0
bedroom rents remaining at $285 weekly. Brisbane Inner Brisbane Middle Brisbane Outer
Chart 13— Greater Brisbane Median Unit Rent by Zone
Source: REIA / Preston Rowe Paterson Research
Queensland Property Market Report | Q2 2019 9Regional Queensland
Gold Coast
Gold Coast’s residential market continues a soft landing
relative to other major cities, recording declines over the Median Price Median Rents
quarter to June 2019. Median unit prices declined by –4.5%
to $425,000, while houses improved marginally at 0.8% to 2 3 4
$625,000. 625,000
0.8%
320 380 445
Median rents in Gold Coast continued a similar path, with -3.0% -1.3% -1.1%
all house and unit rents falling. Median house rents
decreased for 2, 3 and 4 bedroom houses by –3.0% to
$320, -1.3% to $380 and –1.1% to $445 respectively. 1 2 3
Meanwhile, median unit rents decreased for 1, 2 and 3
425,000
-4.5%
230 298 370
bedroom units by –4.2% to $230, -0.7% to $298 and –2.6%
-4.2% -0.7% -2.6%
to $370 respectively.
Chart 14— Gold Coast Median Price and Rents
Source: REIA / Preston Rowe Paterson Research
* % Change over the quarter
Townsville
Townsville’s residential market experienced an overall
decline over the quarter to June 2019 for both investment Median Price Median Rents
and rental properties, with the only exception being house
values. Median house price in Townsville increase by 1.6%
to $320,000, while median unit price in the area declined 2 3 4
further, falling by –3.5% to $250,000 over the same period.
320,000
1.6%
380 460 475
-13.1% -14.8% -18.8%
All three median house weekly rent categories of 2, 3 and 4
bedrooms saw dramatic declines of -13.1%, -14.8% and -
18.8% to $380, $460 and $475 respectively. Meanwhile,
weekly rents for units remained more resilient, 1 and 3 1 2 3
bedroom unit weekly rents remained at $340 and $440
250,000
-3.5%
340 410 440
respectively over the June 2019 quarter. 0.0% -2.4% 0.0%
In contrast, 2 bedroom units recorded a quarterly decrease
Chart 15— Townsville Median Price and Rents
in median weekly rent of –2.4% to $410 weekly. Source: REIA / Preston Rowe Paterson Research
* % Change over the quarter
Cairns
By contrast, Cairns experienced a more resilient quarter,
median unit prices experienced an increase of 2.4% to Median Price Median Rents
$237,500 over the June 2019 quarter, while the median
price for houses remained the same $410,000.
2 3 4
Median rents, however, experienced more mixed results 410,000
0.0%
over the period, with only 2 bedroom house median weekly 280 315 365
5.7% 1.6% -1.4%
rent increasing by 5.7% to $280 and 3 bedroom house rent
increasing at 1.6% to $370. On the other hand, 4 bedroom
houses rent, experienced a decline of –1.4% to $365 weekly.
1 2 3
All three unit rental categories saw a decline in weekly rents
237,500
2.4%
200 252 330
over the period with 1, 2 and 3 bedroom unit weekly rents -4.8% -8.4% -10.8%
decreasing by –4.8%, -8.4% and –10.8% to $200, $252 and
$330 respectively. Chart 16— Cairns Median Price and Rents
Source: REIA / Preston Rowe Paterson Research
* % Change over the quarter
Queensland Property Market Report | Q2 2019 10Rural
“Illuka” Taroom, QLD 4420
$13.9 million
$4,364 per hectare
A 3,185 hectare freehold cattle breeding and fattening property in Central Queensland
has sold to well-known livestock farmers the Finger Family. The fully developed,
undulating Brigalow and softwood country property comprises fertile creek flats and
500 acres presently under cultivation. The property sold bare of livestock but included a
five-bedroom homestead, worker’ quarters and extensive farming infrastructure
including a large undercover equine complex, steel and timber stock yards and seven
dams. The auction attracted 11 bidders – most of which were local producers. Illuka is
situated in Central Queensland’s Brigalow Belt and is located 380 km north-west of the
Brisbane CBD.
Hotels Leisure
Rydges Esplanade Resort Cairns, 72 Queen Street,
Cairns City QLD 4870 Brisbane QLD 4000
$65 million
$150 million
$268,595 per room
$493,421 per room
Mulpha has sold the Rydges Esplanade
hotel in Cairns to a company co-directed The Ne t Hotel has been snapped up by
by Chinese oil boss Huo Zhenxiang. The hotel tycoons Paul and Robert Salter from
recently upgraded 4-star hotel is investment manager company
managed by Rydges and consists of 242 Challenger. The luxury hotel is managed
guest rooms. The property was put up by Singapore’s Next Story Group. The
for sale in July of last year for more than hotel originally opened in 2014 following
$70 million amid the strongest operating a $50 million refurbishment of the former
conditions seen in the Port Douglas and Chifley and Lennons Hotel. The hotel
Cairns hotel market. The resort comprises 304 hotel rooms and two
comprises three swimming pools, two floors of retail along the Queen Street
tennis courts, a health and fitness centre Mall precinct in Brisbane’s CBD.
and a spa and sauna.
Queensland Property Market Report | Q2 2019 11Our Research We have asset, plant and machinery covered
At Preston Rowe Paterson we take pride in the extensive research We regularly undertake valuations of all forms of asset, plant and
we prepare for the market sectors within which we operate in. machinery, including:
These include Commercial, Retail, Industrial, Hotel and Leisure and
Mining & earth moving equipment/road plant
Residential property markets, as well as Infrastructure, Capital,
Resort & accommodation, hotel furniture, fittings & equipment
Asset, Plant and Machinery markets.
Office fit outs & equipment
Farming equipment
We have property covered. Transport equipment
Industrial/factory equipment
We have clients covered Licensed club furniture, fittings & equipment
Building services equipment (lifts, air conditioning, fire services &
Preston Rowe Paterson acts for a diverse range of clients with all building maintenance equipment)
types of property needs, covering real estate, infrastructure, asset,
plant and machinery interests, these include: We have your needs covered
Accountants, auditors & insolvency practitioners Our clients seek our property (real estate, infrastructure, asset,
Banks, finance companies & lending institutions plant and machinery) services for a multitude of reasons, including:
Commercial & residential non-bank lenders
Co-operatives Acquisitions & Disposals
Developers Alternative use & highest and best use analysis
Finance & mortgage brokers Asset Management
Hotel owners & operators Asset Valuations for financial reporting to meet ASIC, AASB, IFRS &
Institutional investors IVSC guidelines
Insurance brokers & companies Compulsory acquisition and resumption
Investment advisors Corporate merger & acquisition real estate due diligence
Lessors & lessees Due Diligence management for acquisitions and sales
Listed & private companies & corporations Facilities management
Listed & unlisted property trusts Feasibility studies
Local, state & federal government departments Funds management advice & portfolio analysis
& agencies Income & outgoings projections and analysis
Mining companies Insurance valuations (replacement & reinstatement costs)
Mortgage trusts Leasing vacant space within managed properties
Overseas clients Listed property trust & investment fund valuations & revaluations
Private investors Litigation support
Property syndication managers Marketing & development strategies
Real Estate Investment Trusts (REITS) Mortgage valuations
Rural landholders Property Management
Solicitors & barristers Property syndicate valuations & re-valuations
Sovereign wealth funds Rating and taxing objections
Stockbrokers Receivership, Insolvency & liquidation valuations & support/advice
Superannuation funds Relocation advice, strategies and consultancy
Trustee & custodial companies Rental assessments & determinations
Sensitivity analysis
We have real estate covered Strategic property planning
We regularly provide valuation, advisory, research, acquisition, due We have all locations covered
diligence management, asset and property management,
consultancy and leasing services for all types of Real Estate, From our capital city and regional office locations we serve our
including: client’s needs throughout Australia. Globally, we have three offices
located in New Zealand, as well as associated office networks
Metropolitan & CBD commercial office buildings located in the Asia-Pacific region.
Retail shopping centres & shops
Industrial, office/warehouses & factories
Business parks
Hotels (accommodation) & resorts
Hotels (pubs), motels & caravan parks
Residential developments projects
Residential dwellings (houses/apartments/units)
Property Management
Rural properties
Hospitals & aged care
Special purpose properties
Extractive industries & resource based enterprises
Infrastructure including airports & port facilitiesPRP Headquarters Sydney Regional Offices Newcastle
Robert Dupont
lbury odonga
Level 7, 1 Market Street M: 0418 681 874
Daniel Hogg E: bob.dupont@prp.com.au
Sydney NS 2000
M: 0428 235 588
P: 61 0 2 9292 7400 daniel.hogg@prp.com.au David Rich
: 61 0 2 9292 7404 M: 0413 052 166
research@prpsydney.com.au Michael Redfern E: david.rich@prp.com.au
M: 0428 235 588
michael.redfern@prp.com.au Shepparton
National Directors es Ridd
Gregory Preston Ballarat M: 0418 334 453
M: 0408 622 400 Darren Evans E: wes.ridd@prp.com.au
greg.preston@prp.com.au M: 0417 380 324
darren.evans@prp.com.au Southport
Gregory Rowe Ian Hawley
M: 0411 191 179 Peter Murphy M: 0458 700 272
greg.rowe@prp.com.au M: 0402 058 775 E: ian.hawley@prp.com.au
peter.murphy@prp.com.au
Greg Sugars Troy Chaplin
M: 0435 911 465 Bendigo M: 0419 029 045
greg.sugars@prp.com.au E: troy.chaplin@prp.com.au
Damien erinic
Neal Ellis M: 0409 820 623
damien.jerinic@prp.com.au Swan Hill
M: 0417 053 116
neal.ellis@prp.com.au Ian Boyd-Law
Central Coast/Gosford M: 0418 5980232
Damian Kininmonth Collin Pugsley E: ian.boyd-law@prp.com.au
M: 0417 059 836 M: 0435 376 630
damion.kininmonth@prp.com.au collin.pugsley@prp.com.au Tamworth
Bruce Sharrock
Dubbo M: 0429 465 012
Capital City Offices E: bruce.sharrock@prp.com.au
ames Skulthorp
delaide M: 0409 466 779
james.skuthorp@prp.com.au Matt Spencer
Rob Simmons M: 0447 227 002
M: 0418 857 555 E: matt.spencer@prp.com.au
adelaide@prp.com.au Tom Needham
M: 0412 740 093
tom.needham@prp.com.au agga agga
Brisbane
Dan Hogg
Troy Chaplin Geelong M: 0408 585 119
M: 0419 029 045 E: daniel.hogg@prp.com.au
troy.chaplin@prp.com.au Gareth Kent
M: 0413 407 820
gareth.kent@prp.com.au arrnambool
Hobart
Stuart McDonald
Damien Taplin Stuart Mcdonald M: 0405 266 783
M: 0418 513 003 M: 0405 266 783 E: stuart.mcdonald@prp.com.au
damien.taplin@prp.com.au stuart.mcdonald@prp.com.au
Shelley Taplin Gippsland New ealand Offices
M: 0413 309 895
Tim Barlow Head Office uckland
shelley.taplin@prp.com.au
M: 0400 724 444 le Haden
Melbourne tim.barlow@prp.com.au M: +64 (0)21 833 118
Neal Ellis E: alex.haden@prpnz.nz
le andra Ellis
M: 0417 053 116 M: 0407 724 444 Greymouth
neal.ellis@prp.com.au alex.ellis@prp.com.au
Mark Bollard
Damian Kininmonth Griffith M: +64 (0)27 694 7041
M: 0417 053 116 E: mark.bollard@prpnz.nz
Daniel Hogg
damian.kininmonth@prp.com.au M: 0408 585 119 Tauranga
daniel.hogg@prp.com.au
Perth le Haden
Cameron Sharp Horsham M: +64 (0)21 833 118
M: 0438 069 103 E: alex.haden@prpnz.nz
Ben Sawyer
cameron.sharp@prp.com.au M: 0429 826 541
ben.sawyer@prp.com.au
Sydney sia-Pacific Region
Gregory Preston Launceston
M: 0408 622 400 ssociated office networks throughout:
Damien Taplin
greg.preston@prp.com.au M: 0418 513 003 China via China Appraisal
E: damien.taplin@prp.com.au http://www.appraisalchina.com/
Gregory Rowe
M: 0411 191 179 Moreton Sunshine Coast apan via Daiwa Realty Appraisal
greg.rowe@prp.com.au
ohn alvey http://daiwakantei.co.jp/eng/about
M: 0422 140 764
E: john.falvey@prp.com.au Thailand via Capital and Co.
http://www.cpmcapital.co.th/
Mornington
Neal Ellis Philippines via Cuervo Appraisal Incorporated
M: 0417 053 116 http://cuervoappraisers.com.ph/
E: neal.ellis@prp.com.au
Damian Kininmonth
M: 0417 059 836
E: damian.kininmonth@prp.com.au
Mount Gambier
Stuart McDonald
M: 0405 2660783
E: stuart.mcdonald@prp.com.au
Preston Rowe Paterson ustralasia Pty Ltd The information provided within this publication should be regarded solely as a general guide. We believe that the information herein is accurate however no warranty of
accuracy or reliability is given in relation to any information contained in this publication. Nor is any responsibility for any loss or damage whatsoever arising in any way for any representation, act or omission, whether
expressed or implied (including responsibility to any person or entity by reason of negligence) accepted by Preston Rowe Paterson Australasia Pty Ltd or any of its associated offices or any officer, agent or employee of
Preston Rowe Paterson Australasia Pty Limited. Liability limited by a scheme approved under Professional Standards Legislation.We have property covered.
www.prp.com.au
© Copyright 2019 Preston Rowe Paterson Australasia Pty LimitedYou can also read