Full Year 2017 Results Presentation - 28 February 2018 - City Developments ...

Page created by Tommy Page
 
CONTINUE READING
Full Year 2017 Results Presentation - 28 February 2018 - City Developments ...
Full Year 2017
Results Presentation
28 February 2018
Full Year 2017 Results Presentation - 28 February 2018 - City Developments ...
Agenda

 General Overview & Strategic Initiatives  Fund Management
   Financial Highlights                Innovation
   Singapore Operations                Hospitality
   International Operations
Full Year 2017 Results Presentation - 28 February 2018 - City Developments ...
General
Overview
Full Year 2017 Results Presentation - 28 February 2018 - City Developments ...
Key Highlights
   Resilient PATMI achieved despite absence of a new project launch in 2017:
     –   $187 million for Q4 2017 (Q4 2016: $244 million)
     –   $538 million for FY 2017 (FY 2016: $653 million)

   Stable revenue maintained:
     -   $1.33 billion for Q4 2017 (Q4 2016: $1.17 billion)
     -   $3.83 billion for FY 2017 (FY 2016: $3.91 billion)

   Strong performance by property development segment:
     –   81% of Q4 and 57% of FY 2017 pre-tax profits respectively
     –   Entire revenue and profit booked in for The Brownstone EC, completed in Oct 2017
     –   Steady contribution from property development projects in Singapore and China
     –   Partial divestment of two Chongqing projects realising a pre-tax gain of $56 million
     –   1,171 units with sales value of $1.93 billion for FY 2017 in Singapore
     –   Well-positioned for upcycle with around 2,750 units in the pipeline

   Robust balance sheet for deployment:
     - $4.0 billion of cash and cash equivalents, with net gearing ratio of 9%^ as at 31 Dec 2017

   Special final dividend of 6.0 cents per share, in addition to the ordinary dividend of 8.0
    cents per share. Total dividends for 2017: 18.0 cents^^ (2016: 16.0 cents)

                            ^ Without factoring in fair value gains on investment properties   ^^ Includes special interim dividend of 4.0 cents paid in Sep 2017

                                                                                                                                                                    4
Full Year 2017 Results Presentation - 28 February 2018 - City Developments ...
Key Financial Highlights – Q4 2017

Revenue                          EBITDA                              PATMI                                Basic EPS

$1.328 billion                   $308.1 million                      $186.7 million                       19.8 cents
     13.8% YoY                          26.3% YoY                           23.4% YoY                             24.1% YoY

Q4 2016:
$1.167 billion                   $417.8 million                      $243.8 million                       26.1 cents

   Revenue increase boosted by steady property sales for Gramercy Park and recognition
    of 100% profit contribution from The Brownstone Executive Condominium (EC).
   Excluding divestment gains, Q4 2017 PATMI would have decreased by 7%.

      No fair values adopted on investment properties.
      Investment properties are stated at cost less accumulated depreciation and accumulated impairment losses.

      Q4 2016 PATMI included contribution from divestures such as sale of Exchange Tower and PPS 3. Q4 2017 PATMI included a gain
      from the divestment of Eling Residences and Huang Huayuan.

                                                                                                                                    5
Full Year 2017 Results Presentation - 28 February 2018 - City Developments ...
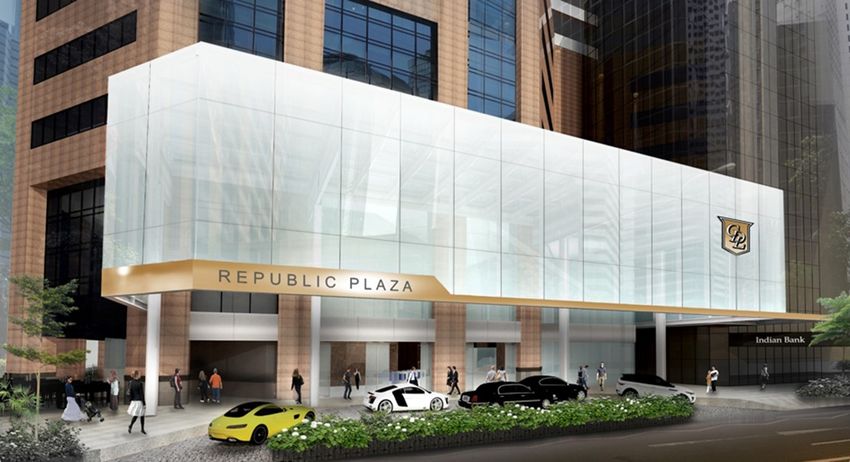
Key Financial Highlights – FY 2017

Revenue                         EBITDA                              PATMI                                Basic EPS

$3.829 billion                  $1.061 billion                      $538.2 million                       57.8 cents
     2.0% YoY                          12.7% YoY                           17.6% YoY                               17.9% YoY

FY 2016:
$3.905 billion                  $1.216 billion                      $653.2 million                       70.4 cents

   Excluding divestment gains, PATMI would have decreased by 11%.

       No fair values adopted on investment properties.
       Investment properties are stated at cost less accumulated depreciation and accumulated impairment losses.

       FY 2016 PATMI included contribution from divestitures such as sale of Exchange Tower and City e-Solutions Limited (CES) and PPS 3.
       FY 2017 PATMI included gains from the divestment of Eling Residences, Huang Huayuan and an office building in Osaka.

                                                                                                                                            6
Full Year 2017 Results Presentation - 28 February 2018 - City Developments ...
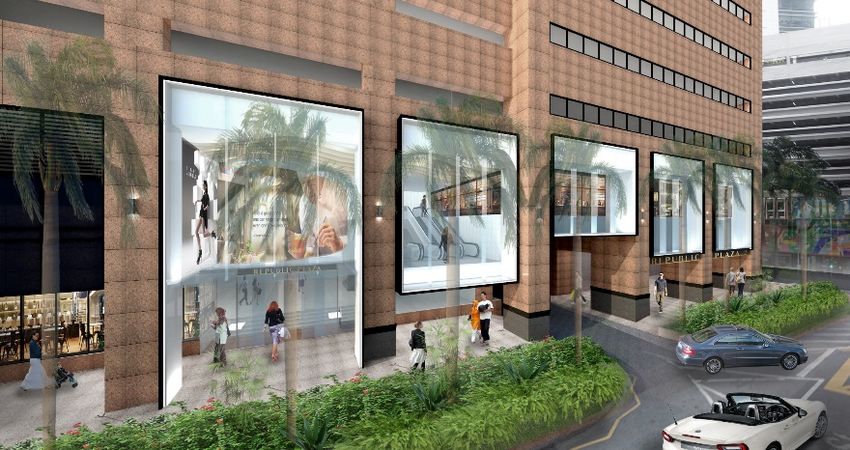
Key Highlights – FY 2017

NAV per share ROE                              Share Price Performance

$10.54            5.62%                        $12.49*                                  YTD 2018’s Highest Close:
                                                                                        $13.48 (16 Jan)

    3.13% YoY           1.41 pts YoY               50.3% in 2017

FY 2016:                                                       2017 HIGHEST - $13.00 (19 Oct)

$10.22            7.03%

Proposed Dividend
                  Comprises:                      Despite a lower reported PATMI, the Group is
18.0              • Special Final Dividend
                      – 6.0 cents                  proposing a special final dividend of 6.0 cents
cents per share   • Final Dividend                 and a final dividend of 8.0 cents
   12.5%             – 8.0 cents
                  • Special Interim Dividend
                     – 4.0 cents                  Total dividend for 2017 will amount to 18.0
FY 2016:            (paid out in Sep 2017)         cents
16.0 cents

                                                                                                * As of 29 Dec 2017

                                                                                                                      7
Full Year 2017 Results Presentation - 28 February 2018 - City Developments ...
Diversified Global Portfolio
Deepening Presence in Key Markets
 Geographical diversification allows flexibility to capitalise on opportunities

                       2017                                     2016
                 Others                                     Others
                  19%             Singapore                  17%          Singapore
                                     52%                                     48%
                       Total Revenue                      US     Total Revenue
               US
                       by Geography                      14%     by Geography
              14%

                China                                     China
                 6% UK                                     11% UK
                       9%                                       10%

                 Others                                        Others
                  19%           Singapore                       17%
                                   48%                                      Singapore
                                                                               55%
               US                                         US
                        Total Assets                      9%      Total Assets
               8%      by Geography                              by Geography
               China                                     China
                10%                                       9%
                                                              UK
                        UK                                   10%
                       15%

                                                                                        8
Full Year 2017 Results Presentation - 28 February 2018 - City Developments ...
Diversified Land Bank
Land Area (as of 31 Dec 2017) – CDL’s Attributable Share
  Type of Development                                                  Land Area (sq ft)
                                        Singapore             International                  Total                    %

Residential                                   954,777                1,817,032               2,771,809                93

Commercial / Hotel                              20,886                 187,862                  208,748               7

Total                                         975,663                2,004,894               2,980,556               100

Total Proposed GFA – 6.4 million sq ft

                 China                                                      Commercial /
                  27%                           China                          Hotel
                                                 27%
                                              Singapore **                        25%
                                                   36%
                             Composition                                                 Composition
                              By Region                                                  By Segment
                                                                                                              Residential
                                                                                                                   75%

                        UK               Others*
                        27%             UK 10%
                                        27%

        * Includes Japan and Malaysia                                                                                                 9
        ** Includes Amber Park collective sale site, but does not include West Coast Vale and Handy Road GLS sites acquired in 2018
Full Year 2017 Results Presentation - 28 February 2018 - City Developments ...
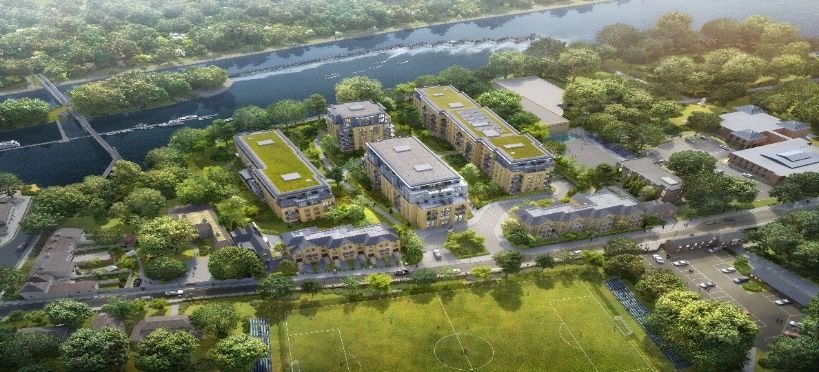
Extensive Global Network
Strategic Investments and Diversifications in FY 2017
UK & EUROPE
>> Acquired Ransomes Wharf mixed                                                          CHINA
   development site in Battersea for £58 million                                          >> Acquired Hong Leong Plaza Hongqiao
>> Acquired The Lowry Hotel in Manchester for                                                in Shanghai for RMB 900 million
   £52.5 million*                                                                         >> RMB 102 million investment in Distrii
>> Strategic hotel acquisitions: Pullman Hotel                                               & participation in Series A Funding
   Munich & Le Meridien Frankfurt for a total of                                          >> Strategic collaboration with China
   €178.3 million*                                                                           Vanke with partial divestment of two
                                                                                             Chongqing projects

                                                                                                           SINGAPORE
                    FY 2017:                                                                               >> Acquired Tampines Ave
                                                                                                              10 GLS and Amber Park

       $1.8 billion*                                                                                          collective sale sites for
                                                                                                              $1.3 billion*

  Acquisitions & investments

             Key Markets:
  Singapore, China, UK & Europe,
        Japan & Australia
                                                   AUSTRALIA
                                                   >> Collaboration with Waterbrook
                                                      Lifestyle Resorts on 2 Luxury
                                                      Retirement Housing Projects in
                                                      NSW and Sydney for A$57 million

                                                                                        * Includes JV partners / associates share         10
Profit Participation Securities (PPS)
The Group currently acts as Asset Manager for 3 PPS with short-term fund life:

PPS 1 – Dec 2014                                                 PPS 3 – Oct 2016

$1.5 billion comprising the Quayside Collection in Sentosa:
 The Residences at W Singapore – Sentosa Cove
 The 5-star 240-room hotel W Singapore – Sentosa Cove
 Quayside Isle, a waterfront F&B and retail property

PPS 2 – Dec 2015
                                                                 $1.0 billion comprising Nouvel 18, a
                                                                 156-unit luxury residential
                                                                 development at Anderson Road

           $1.1 billion comprising three office properties:
            Manulife Centre
            7 & 9 Tampines Grande
            Central Mall (Office Tower)

                                                                                                        11
Strategic
Initiatives
Strategic Focus for 2018
Renewal and Transformation

 #1                          #2                         #3
 GROWTH                      ENHANCEMENT                TRANSFORMATION

  Property                   Asset Enhancement         Fund Management
   Development                 Initiatives (AEI)         Innovation
  Recurring Income           Repositioning /           New Platforms
   Streams                     Redevelopment
                              Operational Efficiency

                                                                            13
GROWTH

#1 Grow Property Development
Build Land Bank for Future Development Income

   Location               Tenure      Total      Site Area       Gross Floor    Land Price              Land Cost
                                      Units       (sq ft)        Area (sq ft)
Amber Road                Freehold    Est 600     213,675            598,290    $906.7 million          $1,515 psf ppr

Tampines Ave 10            99-year      861       233,767            654,553    $370.1 million          $565 psf ppr
                          leasehold
Handy Road                 99-year    Est 200     51,626             123,205    $212.2 million          $1,722 psf ppr
                          leasehold
West Coast Vale            99-year    Est 730     210,883            590,481    $472.4 million          $800 psf ppr
                          leasehold

Ransomes Wharf            Freehold    118 resi    69,965             240,899      £58 million              £829 psf
(UK)                                  8 comm                                    ($103.2 million)         ($1,475 psf)

                                                                                Artist’s Impression –
             Amber Park                                      The Tapestry       Subject to changes

                                                                                                                         14
GROWTH

Grow Property Development
Highest Bidder for Waterfront EC site at Sumang Walk
  Location      Tenure     Equity    Total     Maximum Gross      Site Information
                           Stake     Units     Floor Area (sqm)
                                                                  Site Area                           27,056.4 sqm
                99-year
 Sumang Walk                60%     Est. 820    81,169.2 sqm      Maximum GFA                         81,169.2 sqm
               leasehold
                                                                  Land Price                         $509.37 million
                                                                                                      / $583 psf ppr

                                                                  Top Bid Placed for Government Land
                                                                  Sales (GLS) programme site, which closed
                                                                  on 27 Feb 2018:

                                                                      Strategic top bid of $509.37 million placed
                                                                       by CDL and JV partner (TID Pte. Ltd.)
                                                                          Hotly contested tender with 16 other
                                                                             bidders
                                                                          4.8% margin versus the second highest
                                                                             bid

                                                                      Proposed scheme: 13 blocks of 10- to 17-
                                                                       storeys with around 820 units

                                                                      Excellent connectivity: within 100m of
                                                                       Sumang LRT station and 550m of Punggol
                                                                       MRT station and bus interchange

                                                                      Within 2km radius of over 10 primary
                                                                       schools

                                                                                                                       15
GROWTH

Grow Recurring Income Streams
Strengthen Recurring Income from Asset Base

                        Recurring                               Recurring
                         EBITDA                                  EBITDA
                           56%                                     55%

    Property                                Property
  Development                             Development
  $462 million, 44%                       $550 million, 45%

                         2017                                    2016

                        Recurring                               Recurring
                         Income                                  Income
                      $599 million, 56%                       $666 million, 55%

                                                                                       16
ENHANCEMENT

#2 Asset Repositioning
Unlocking Value in Existing Asset Portfolio
                                                                                        Republic Plaza – $70 million AEI
                                                                                         Phased AEI works to commence in 1H
                                                                                          2018
                                                                                         Expected completion by 1H 2019
                                                                                         Includes creation of new retail cluster at
                                                                                          Level 2
                                                                                         Total NLA (Post AEI): 785,000 sq ft

Republic Plaza – Revamped Driveway                                Artist’s Impression

                                                                                                                       Artist’s Impression

                                                     Le Grove Serviced Apartments – $30 million AEI
                                                      On track for completion in Q2 2018
                                                      Unit reconfiguration: Increases to 173 apartment units
                                                       (from 97 units)
Le Grove Serviced Apartments                          Approx. NLA: 89,340 sq ft (excluding common areas and amenities)
                               Artist’s Impression

                                                                                                                                             17
ENHANCEMENT

Operational Efficiency
Priorities to Enhance Operational Efficiency and Product Offerings

                            • Improve customer experience through better product quality
      Customer Centric

                            • Create greater value through ESG integration
        Sustainability

                            • Strengthen asset management to maximise yields
     Asset Optimisation

                            • Optimise balance sheet
     Capital Deployment

                            • Quick turnaround to capitalise on cyclical trends
      Speed to Market

       Organisational       • Improve teamwork and execution
        Realignment

                                                                                            18
TRANSFORMATION

#3 Establish Fund Management Platform
Create New Recurring Income Streams & Raise 3rd Party Capital for Additional Acquisitions

                          Group Chief Investment Officer

                   • Generate new streams of recurring income
                   • Diversify earnings and expand investor base
                   • Enhance capital recycling strategy

                                      AUM Target
                                 US$5 billion
                                         by 2023

             To be Top 15 Fund Managers in Asia by 2023 (5th Year)

                                                                                            19
TRANSFORMATION

Innovation & New Platforms
Two-Pronged Approach: Strategic Investments & Enterprise-Driven Initiatives

                Investments in                                            Internal Innovation
           New Economy Businesses                                              Initiatives
             & Potential Disruptors

                                                                           Enterprise Innovation Committee
   China’s Fast-Growing       China’s Leading Operator                                   (EIC)
  Online Apartment Rental       of Co-working Space
          Platform

                                                             Business
                            Distrii Suhe Center, Shanghai   Performance

                                                                                                             20
Financial
Highlights
Financial Highlights
Revenue by Segment for 4th Quarter (2015 – 2017)

            900                   $1,328m                          $1,167m                         $855m
            800             760
            700
                                                             598
            600
            500                   450                              444                             463
$ million

            400
            300                                                                              242
            200
                                         86                              89                              105
            100                               32                               36                              45
              0
                               Q4 2017                         Q4 2016                         Q4 2015
                           Property Development    Hotel Operations      Rental Properties   Others

                                                   Q4 2017                    Q4 2016              Q4 2015
                  Property Development              57%                        51%                    28%
                  Hotel Operations                  34%                        38%                    54%
                  Rental Properties                  6%                         8%                    12%
                  Others                             3%                         3%                    6%

                                                                                                                    22
Financial Highlights
Profit Before Tax by Segment for 4th Quarter (2015 – 2017)
            450                    $239m                        $332m                           $471m
            400                                                                                       349
            350
            300
                                                          243
            250
$ million

                         193
            200
            150                                                       101                 116
            100
                                       40
             50                    1        5                                                   9
              0
            (50)                                                (9)          (3)                            (3)
                            Q4 2017                         Q4 2016                         Q4 2015
                        Property Development    Hotel Operations      Rental Properties   Others

                                                Q4 2017                     Q4 2016             Q4 2015
               Property Development              81%                         73%                   25%
               Hotel Operations                    -                         (3%)                   2%
               Rental Properties                 17%                         31%                   74%
               Others                             2%                         (1%)                  (1%)

                                                                                                                  23
Financial Highlights
Revenue by Segment for Full Year (2015 – 2017)

                              $3,829m                           $3,905m                             $3,304m
      2,000
                                                        1,745                                        1,698
      1,800            1,653 1,694                              1,633
      1,600
      1,400
      1,200                                                                                 1,037
$ million

      1,000
        800
        600                                                                                                   406
                                     347                                367
        400
                                           135                                 160                                  163
        200
          0
                           FY 2017                          FY 2016                                 FY 2015
                       Property Development      Hotel Operations       Rental Properties     Others
                                                 FY 2017                      FY 2016                 FY 2015
              Property Development                43%                          45%                      32%
              Hotel Operations                    44%                          42%                      51%
              Rental Properties                    9%                           9%                      12%
              Others                               4%                           4%                      5%

                                                                                                                          24
Financial Highlights
Profit Before Tax by Segment for Full Year (2015 – 2017)

            700                       $780m                              $914m                               $985m
            600                                                  520
            500             445                                                                                        460

            400                                                                                      356
$ million

            300
                                                                                 207
            200                     148     168                                                              171
                                                                         116
            100                                                                         71
                                                  19
              0
                                                                                                                             (2)
        (100)
                                  FY 2017                              FY 2016                             FY 2015
                           Property Development        Hotel Operations          Rental Properties   Others

                                                       FY 2017                         FY 2016               FY 2015
                  Property Development                  57%                             57%                    36%
                  Hotel Operations                      19%                             13%                    17%
                  Rental Properties                     22%                             23%                    47%
                  Others                                 2%                              7%                        -

                                                                                                                                   25
Financial Highlights
EBITDA by Segment for Full Year (2015 – 2017)

            700                     $1,061m                             $1,216m                            $1,272m
                                                                                                                     587
            600                                                  550

            500             462

            400                                                                                      364
$ million

                                                                                 324                         304
                                    298     277
            300                                                          264

            200
            100                                                                         78
                                                  24                                                                       17
              0
                                  FY 2017                              FY 2016                             FY 2015
                           Property Development        Hotel Operations          Rental Properties   Others

                                                       FY 2017                         FY 2016               FY 2015
                  Property Development                  44%                             45%                    29%
                  Hotel Operations                      28%                             22%                    24%
                  Rental Properties                     26%                             27%                    46%
                  Others                                 2%                              6%                    1%

                                                                                                                                26
Financial Highlights
Capital Management
                                                        As at 31/12/17   As at 31/12/16

Gross borrowings                                          $5,036m          $5,752m

Cash and cash equivalents (include restricted
 deposits of $214m classified in other non-current        $3,989m          $3,887m
 assets)

Net borrowings                                            $1,047m          $1,865m

Net gearing ratio without taking in fair value gains
                                                             9%              16%
 on investment properties

Net gearing ratio after taking in fair value gains on
                                                             7%              12%
 investment properties

Interest cover ratio                                        13.6 x           12.5 x

                                                                                          27
Financial Highlights
Prudent Capital Management
  Debt Expiry Profile                                                                  Debt Maturity

                                                                                                        Within 1 year
                 2,000
Debt $ million

                                                      Bond     Bank Loan                    25%
                                                                               35%                      1 to 2 years
                 1,500

                         320                                                                            2 to 3 years
                 1,000                    421                                               15%
                                                    249                                                 More than 3
                                 384                                                 25%                years
                  500    947              839       684                540
                                 353                         100
                                                             199
                    0
                         2018   2019      2020      2021     2022     2023
                                                                     onwards
                                                                                      Debt Currency Mix

                                                                                       6%                   SGD
                                                 31/12/2016 31/12/2017               4%
                                                                                                            GBP
                                                                                11%
                                                                                                            USD
                   Average Borrowing Cost          2.2%             2.2%                          48%
                                                                               14%                          JPY
                                                                                                            RMB
                   % Secured Borrowings             16%             12%
                                                                                                            Others
                                                                                     17%

                                                                                                                        28
Singapore
Operations
 Project Development
Singapore Property Market
Property Price Index – Residential (2013 – 2017)

                                               All Residential
                                                                             Beginning of
180                                                                           Residential
                                                                            Market Recovery

160

                                                                                                    Q3 17 Q4 17
                                                                                                    137.6 138.7
140

120
      Q1   Q2   Q3   Q4   Q1   Q2   Q3   Q4   Q1   Q2   Q3   Q4   Q1   Q2   Q3   Q4     Q1     Q2    Q3       Q4
      13   13   13   13   14   14   14   14   15   15   15   15   16   16   16   16     17     17    17       17

                                                                                      Source : URA, Q4 2017
                                                                                      Based on Revised PPI

                                                                                                                   30
Singapore Property Market
Developers’ Sales came in at 10,566 units – Far exceeding the annual average
demand of 7,600 new homes from 2014 - 2016
                                                               Strong developers’ sales
                                                                of 10,566 units in 2017
                                             22,197
                                                                but still far from peak
                                                                of 22,197 units in 2012

                           16,292   15,904
                                                      14,948
                  14,688

          4,264

                                                                               Source : URA and CBRE
                                                                                                       31
Singapore Property Development
Residential Units Sold
  FY 2017          FY 2016
                                            1,269,641
   1,171
                     $1,928,112
                                                   974,666
           1,017
                                                                               Sales Value
                             $1,245,726                                             55%         yoy

                                                                                 Units Sold
                                                                                    15%          yoy

   No. of Units*      Sales Value*        Total Floor Area*
                         ($'000)                (sq ft)
                                                              * Includes share of JV partners

                                                                                                       32
Singapore Property Development
New Futura – Private Preview commenced on 18 Jan 2018
    Project       Location        Tenure     Equity      Total   Total Units    %       Total Saleable
                                             Stake       Units     Sold*       Sold*     Area (sq ft)
New Futura     Leonie Hill Road   Freehold    100%       124         48         39         248,199

Strong Response for Private Preview:

    Private preview of South Tower started on 18 Jan

    To date*, 48 units sold (or 75% of 64-unit South Tower)

    Achieved average selling price of over $3,200 psf

    4-bedroom apartments in South Tower are fully sold

    Remaining units in South Tower comprise 2-, 3-bedroom
     apartments and a penthouse

                                                                           New Futura

                                                                                                 *As of 22 Feb 2018

                                                                                                                  33
Singapore Property Development
Continued Healthy Uptake for Launched Projects
     Project              Location      Tenure     Equity     Total       Total Units      %              Total Saleable
                                                   Stake      Units         Sold*         Sold*            Area (sq ft)
Gramercy Park         Grange Road       Freehold    100%       174           168            97                  368,743

    97% sold to date
          Phase 1 (North Tower) – 100% sold
          Phase 2 (South Tower) – 93% sold

    Achieved average selling price: over $2,800 psf

                                                                                    Gramercy Park

Project    Location          Tenure      Equity    Total    Total Units      %          Total Saleable            % Completed          Expected
                                         Stake     Units      Sold*         Sold*        Area (sq ft)              (as of 31 Dec         TOP
                                                                                                                       2017)

Forest          Lorong       99-year      50%      519         482            93           431,265                    16.1              Q4 2020
Woods          Lew Lian     leasehold

   Final choice units available

   Average selling price of about $1,414 psf (on project basis)

   All 1-bedroom+study, 2-bedroom and penthouses fully sold;
    Remaining units comprise of 3-bedroom to 4-bedroom unit types

                                                                                          Artist’s Impression                      Forest Woods

                                                                                                                                         *As of 22 Feb 2018

                                                                                                                                                          34
Singapore Property Development
Completed Residential Projects in 2017 – Total of 2,785 apartments
             Project                  Location              Equity     Total          % Sold*         TOP Obtained
                                                            Stake      Units
The Venue Residences              Tai Thong Crescent         60%         266              99               Apr 2017

D’Nest                              Pasir Ris Grove          51%         912              100        Phase 1 – Jul 2017
                                                                                                     Phase 2 – Oct 2017

New Futura                         Leonie Hill Road         100%         124              39              Aug 2017

The Brownstone Exec Condo (EC)      Canberra Drive           70%         638              99               Oct 2017

Commonwealth Towers              Commonwealth Avenue         30%         845              100             Nov 2017

D’Nest                                  The Brownstone EC

                                                                     *As of 22 Feb 2018    The Venue Residences

                                                                                                                          35
Singapore Property Development
Residential Projects Available for Launch – Pipeline of around 2,750 units
               Project                               Location     Tenure      Equity   Total       Gross Floor     Expected
                                                                              Stake    Units       Area (sq ft)     Launch
                                                                   99-year
The Tapestry                                   Tampines Ave 10                100%      861           654,553      Mar 2018
                                                                  leasehold
                                                                   99-year
South Beach Residences                              Beach Road                50.1%     190           391,161     Q2 / Q3 2018
                                                                  leasehold
                                                                   99-year                                         Q4 2018 /
West Coast Vale site                           West Coast Vale                100%     Est 730        590,481
                                                                  leasehold                                        Q1 2019

Amber Park site                                     Amber Road    Freehold     80%     Est 600        598,290       1H 2019

                                                                   99-year
Handy Road site                                     Handy Road                100%     Est 200        123,205       1H 2019
                                                                  leasehold
                                              Cuscaden Road /
Boulevard Hotel site                                              Freehold     40%      154           345,405             *
                                              Orchard Boulevard

* Launch timing TBC, subject to market conditions

                                                                                                                  Artist’s Impression –
                                                                                           The Tapestry           Subject to changes

                                                                                                                                          36
Singapore Property Development
The Tapestry – Upcoming Project Launch in March 2018

       Location          Tenure        Equity      Total   Gross Floor
                                       Stake       Units   Area (sq ft)
                         99-year
    Tampines Ave 10                    100%         861      654,553
                        leasehold

     Located minutes to the established Tampines Regional Centre and
      newly-completed Our Tampines Hub

     Site is well-connected islandwide via two MRT lines: Tampines East
      West Line and new Downtown Line, as well as the Tampines Bus
                                                                                                             Artist’s Impression –
      interchange                                                          The Tapestry                      Subject to changes

     Development offers over 50 facilities spread across 10 zones,
      including a childcare centre and exclusive residential services

     All units are fitted with smart home technologies

     Wide selection of one to five-bedroom units with efficient layouts
      available

                                                                                          Artist’s Impression – Subject to changes

                                                                                                                                     37
Singapore Property Development
 Inventory of Launched Residential Projects – As of 31 Dec 2017
                                                                                           Total Unsold CDL’s Share of
              Project                   Equity Stake Total Units   Units Sold     % Sold
                                                                                            Inventory   Unsold Inventory
St. Regis Residences                        33%          173          161          93%         12             4.0
The Oceanfront @ Sentosa Cove               50%          264          263          99%          1             0.5
One Shenton                                 100%         341          327          96%         14              14
Cliveden at Grange**                        100%         110          43           39%         67              67
UP@Robertson Quay                           100%         70           58           83%         12              12
Echelon                                     50%          508          506          99%          2              1
D'Nest                                      51%          912          912          100%         0              0
The Venue Shoppes                           60%          28           16           57%         12             7.2
The Venue Residences                        60%          266          265          99%          1             0.6
Coco Palms                                  51%          944          931          99%         13             6.6
The Brownstone Executive Condo              70%          638          631          99%          7             4.9
The Criterion Executive Condo               70%          505          472          93%         33             23.1
Gramercy Park                               100%         174          158          91%         16              16
Forest Woods                                50%          519          477          92%         42              21
Commonwealth Towers                         30%          845          845          100%         0              0

                             TOTAL:                     6,297        6,065                     232            178

          ** Leasing strategy implemented
                                                                                Limited Inventory of Launched Projects

                                                                                                                           38
Singapore
Operations
  Asset Management
Singapore Commercial Market
Property Price Index – Commercial (2013– 2017)

 150

                                 Office        Retail
 140                                                                                                   Q4 17
                                                                                            Q3 17      131.4
                                                                                            128.0
 130

 120                                                                                        Q3 17 Q4 17
                                                                                            112.9 111.8
 110

 100

  90

  80
       Q1   Q2   Q3   Q4   Q1   Q2   Q3   Q4   Q1   Q2   Q3   Q4   Q1   Q2   Q3   Q4   Q1   Q2    Q3   Q4
       13   13   13   13   14   14   14   14   15   15   15   15   16   16   16   16   17   17    17   17

                                                                                            Source : URA, Q4 2017

                                                                                                                    40
Singapore Commercial Market
Property Rental Index – Commercial (2013– 2017)

 250

                                 Office        Retail

 200
                                                                                                       Q4 17
                                                                                            Q3 17
                                                                                                       163.4
                                                                                            159.3
 150

                                                                                            Q3 17      Q4 17
                                                                                            99.7       99.2
 100

  50

   0
       Q1   Q2   Q3   Q4   Q1   Q2   Q3   Q4   Q1   Q2   Q3   Q4   Q1   Q2   Q3   Q4   Q1   Q2    Q3    Q4
       13   13   13   13   14   14   14   14   15   15   15   15   16   16   16   16   17   17    17    17

                                                                                            Source : URA, Q4 2017

                                                                                                                    41
Rental Properties
Office Portfolio – Lease Expiry 2018 – 2020
As of 31 Dec 2017

                     NLA:                 16        94.8%
         ~2,344,000 sq ft              Properties   Occupancy*

       % of NLA
       Expiring

                  28.5%               30.5%
                                                     16.5%

                    2018               2019           2020

                                                                 *National Average: 87.4%

                                                                                       42
Rental Properties
Retail Portfolio – Lease Expiry 2018 – 2020
As of 31 Dec 2017

          Retail Portfolio NLA:               19    97.4%
           844,000 sq ft               Properties   Occupancy*

       % of NLA
       Expiring

                  34.5%               35.4%
                                                     18.6%

                    2018               2019           2020

                                                                 *National Average: 92.6%

                                                                                       43
Rental Properties
Revenue by Sector for Full Year (2015 – 2017)
                                        $347m                               $367m                      $406m
                 200                                                                             187
                 180
                 160                                              152
                             133                                                                                             Office
                 140
    S$ million

                                      116                                  110                         113
                 120                                                                                                         Retail
                 100
                                                  73                                   74                          75        Industrial
                  80
                  60                                                                                                         REIT/Hotel
                  40                                                                        24                          23
                                                         18                                                                  Others ^
                  20                        7                                    7                           7
                   0
                                      FY 2017                               FY 2016                    FY 2015
                                                       FY 2017                       FY 2016             FY 2015
                 Office                                 38%                           41%                    46%
                 Retail                                 34%                           30%                    28%
                 Industrial                              2%                            2%                    2%
                 REIT/Hotel                             21%                           20%                    18%
                 Others ^                                5%                            7%                    6%
                 ^   Including car park, serviced apartments and residential.

                                                                                                                                          44
Republic Plaza Asset Enhancement Initiative (AEI)
Expected Completion by 1H 2019

$70 million AEI Plan
   Phased AEI works to commence in 1H 2018
   Includes creation of new retail cluster at Level 2
   Total NLA (Post AEI): 785,000 sq ft

       Revamped Main Lobby                 Artist’s Impression   Republic Plaza – Revamped Driveway                             Artist’s Impression

                     New Access to Basement F&B & MRT              Artist’s Impression   Revamped Facade along Malacca Street   Artist’s Impression

                                                                                                                                                      45
International
  Operations
International Property Development
Australia & Japan – Good Progress on Launched Projects
                                                           Brisbane – Ivy and Eve
                                                                Tenure     Equity       Total       Total Units        %        Expected
                                                                           Stake        Units         Sold*           Sold     Completion
                                                               Freehold    33%#          476            463             97       1H 2018

                                                                  Approx. 97% of project sold to date

Ivy and Eve, Brisbane
                                     Artist’s Impression
                                                                  Completion in early 2018

                                                           Tokyo – Park Court Aoyama The Tower
                                                                Tenure      Equity        Total         Total Units           Expected
                                                                            Stake         Units           Sold*              Completion
                                                                Freehold     20%           160           Over 80%            March 2018

                                                                Over 80% of units sold since its launch in Oct 2016
                                                                On-track for completion in Mar 2018

                                                           Tokyo – Shirokane
                                                                 Prime freehold site to be land banked for value appreciation
Park Court Aoyama The Tower, Tokyo

                                                                                    # Effective economic interest is ~49%     *As of 22 Feb 2018

                                                                                                                                                   47
International Property Development
China – Good Progress for Launched Projects in Suzhou
Suzhou – Hong Leong City Center (丰隆城市中心)
        Tenure        Equity      Total     Total Units % Sold Expected Completion
                      Stake       Units       Sold*
     70 years         100%        1,804       1,560       86    Completed (Phase 1)
    (Residential) /                                             Q2 2018 (Phase 2)^
     40 years
    (Commercial)
        Continued healthy uptake:
                Phase 1 – 86% sold with sales value of RMB 2.6 billion
                Phase 2 – 87% sold with sales value of RMB 928 million

        Phase 1: Tower 1 (462-unit residential) & Tower 3 (912-unit SOHO)                                                          Hong Leong City Center,
         Phase 2: Tower 2 (430-unit residential), 30,000 sqm office tower, 56,000 sqm      Artist’s Impression                      Suzhou
         retail mall & hotel                                                                  Artist’s Impression                             *As of 22 Feb 2018
        Phase 2 of Mixed-use waterfront project to be completed by Q2 2018                                         ^Phase 2 completion excludes hotel component

    Strategic Partnership with China Vanke
    Chongqing – Huang Huayuan and Eling Residences
               Project             Tenure        Equity        Total       Expected
                                                 Stake         Units      Completion
     Huang Huayuan                                30%          >700         2020
                                  50-year-
     Eling Residences              lease          50%           126       Completed

          Strategic partnership was formed with China Vanke (No. 1 Chinese developer by
           market capitalisation)                                                                                                        Eling Residences,
                                                                                            Artist’s Impression                          Chongqing

                                                                                                                                                                   48
International Rental Properties
China – Good Progress in Tier 1 City Shanghai
                                                        Hong Leong Plaza Hongqiao
                                                               Tenure             Equity       Est. Total GFA         Completion
                                                                                  Stake             (sqm)

                                                             50-year lease        100%               32,182              Q4 2017

                                                             The project was completed in Q4 2017, comprising five office towers
                                                              with two levels of basement carparks

                                                             The project is in strategic location within Shanghai’s Hongqiao CBD,
                                                              well positioned to benefit from the fast growth prospects of the
Hong Leong Plaza Hongqiao,                                    upcoming area
                                  Artist’s Impression
Shanghai

                                                            Shanghai – Hongqiao Royal Lake (御湖)
                                                             Tenure      Equity   Total       Sold and Booked Units         Completion
                                                                         Stake    Units
                                                                                               Sold             Booked

                                                             70 years    100%      85           38               16          Completed

                                                                             Sales Value     RMB 810          RMB 346
                                                                                              million          million
                         Hongqiao Royal Lake,
 For Illustration Only   Shanghai

                                                                                                                                         49
International Property Development
UK – Projects under Construction
Teddington Riverside, Teddington TW11
      Tenure        Equity    Total   Est. Total Saleable        Expected
                    Stake     Units       Area (sq ft)          Completion
     Freehold       100%      240          233,552                 Q4 2019

     Completion of phase 1 expected to be Q4 2018
     On-site sales centre opened in Oct 2017

                                                                                   Teddington Riverside, London                  Artist’s Impression
Projects to be Completed in 2018 & 2019
       Project          Tenure        Equity Stake      Total Units        Est. Total Saleable Area (sq ft)       Expected Completion
    Belgravia           Freehold         100%                  6                        12,375                              Q2 2018
    Knightsbridge       Freehold         100%                  3                         5,193                             Q2 2018
    Chelsea             Freehold         100%                  9                        16,143                             Q1 2019

                 Belgravia                                         Knightsbridge           Chelsea                Artist’s Impression

                                                     Artist’s Impression

                                                                                                                                                       50
International Property Development
UK – Good Progress on Planning Applications

Stag Brewery, Mortlake, London SW14
                                                    Tenure        Equity Stake       Est. Total Saleable Area (sq ft)

                                                   Freehold            100%                      1,000,000

                                              £1.25 billion Mixed-use Scheme Site Plan:
                                               Planning application submitted in Feb 18. Determination targeted   forImpression
                                                                                                              Artist’s  Q4 2018.
                                                   Designed by architects Squire & Partners, the project will include:
                                                      Residential: 667 units (one, two, three and four-bedroom private and affordable
                                                       units with underground parking); Care village with up to 150 assisted living units
                                                       and an additional dementia care home
 Stag Brewery, London   Artist’s Impression
                                                      Commercial: 20 units for shops, bars, restaurants, a gym, together with a hotel,
                                                       cinema and rowing club
                                                      Offices: 3,000 sqm of office space
                                                      Community amenities: Nine-acre green space and a new green link connecting
                                                       the existing Mortlake Green with the River Thames; New secondary school for
                                                       1,200 pupils, with a full-sized football pitch and sports facilities
                                              Ransomes Wharf, Battersea, SW11
                                                  Tenure        Equity             Total Units               Est. GFA       Expected
                                                                Stake                                         (sq ft)      Completion
                                                  Freehold      100%          Residential:118 units          240,899           2020
 Ransomes Wharf         Artist’s Impression                                   Commercial: 8 units
                                                   Existing 2015 planning consent being implemented with planning improvements
                                                    to the scheme
                                                   Site demolition on target to commence in Q1 2018
                                                                                                                                            51
International Property Development
UK – Good Progress on Planning Applications
Development House, Leonard Street, Shoreditch
       Project           Tenure         Equity Stake        Est. Total Saleable Area (sq ft)

    Leonard Street      Freehold           100%                         90,000

    Planning application for redevelopment submitted in Dec 2017; outcome
     expected in Q2 2018

    Existing 28,000 sq ft building is fully leased; vacant possession expected from
     Q3 2018                                                                                   Development House   Artist’s Impression

28 Pavilion Road, Knightsbridge, London SW1
       Tenure            Equity Stake             Total Units            Est. GFA (sq ft)

      Freehold              100%                       34                    135,000

    Two new applications submitted all within the existing mass and envelope of the
     care home consent

    Demolition works expected to commence in 2019, to be synchronized with
     planned refurbishment works at Millennium Hotel London Knightsbridge as both
     properties share the same access roads

    Property continues to operate as a car park currently

                                                                                               Pavilion Road       Artist’s Impression

                                                                                                                                         52
International Property Development
Residential Projects Launched To Date*
            Project        City      Equity    Total          Total         % Sold/         Est. Total            Expected
                                     Stake     Units      Units Sold        Booked          Saleable             Completion
                                                           / Booked                        Area (sq ft)

Australia
Ivy and Eve              Brisbane    33%#       476           463               97            348,678               1H 2018

China
Hong Leong City Center    Suzhou     100%      1,374         1,185              86           1,378,891             Completed
(Phase 1)

Hong Leong City Center    Suzhou     100%       430           375               87            439,716               Q2 2018
(Phase 2 – T2)

Hongqiao Royal Lake      Shanghai    100%        85        Sold: 38         Sold: 45          385,394              Completed
                                                          Booked: 16       Booked: 19
Eling Residences         Chongqing    50%       126             ^               ^             325,854              Completed

Japan
Park Court Aoyama The     Tokyo       20%       160             -              >80            184,959               Q1 2018
Tower

                                                                                                                       *As of 22 Feb 2018
                                              # Effective economic interest is ~49%     ^ JV entity will manage project sales & marketing

                                                                                                                                            53
International Property Development
Unlaunched Residential Projects
        Project            City        Tenure        Equity   Total   Est. Total Saleable Area /               Expected
                                                     Stake    Units   GFA^ / Site Area+ (sq ft)               Completion
China
Huang Huayuan            Chongqing   50-year lease    30%     >700               1,041,589                         2020
UK
Belgravia                 London       Freehold      100%       6                 12,375                         Q2 2018
Knightsbridge             London       Freehold      100%       3                  5,193                         Q2 2018
Chelsea                   London       Freehold      100%       9                 16,143                         Q1 2019
Knightsbridge             London       Freehold      100%      34                135,000^                          TBC
(Pavilion Road)
Teddington Riverside*     London       Freehold      100%     240                 233,552                        Q4 2019

Stag Brewery, Mortlake    London       Freehold      100%     TBC                1,000,000                         TBC
Ransomes Wharf,           London       Freehold      100%     118                240,899^                          2020
Battersea
Japan
Shirokane                 Tokyo        Freehold      100%     TBC                180,995+                          TBC

                                                                      * Soft launched in Oct 2017, full launch slated for Q4 2018

                                                                                                                                    54
Fund
Management
How Big is the Real Estate Industry?
A Total Market of US$13.5 trillion, Comprising Mostly of Unlisted Vehicles

               Private Debt                                               Public Debt
                   45%                                                       11%

                                 US$6 trillion
                                                        US$1.5 trillion

                                                 US$5 trillion
                                US$1 trillion
                                                                              Direct
                                                                           Investment/
              Listco/ REIT
                                                                           Private fund
                   7%
                                                                               37%

    CDL Fund Management platform will allow CDL to play in both the listed and unlisted side of Real
     Estate. As you can see the unlisted side is a lot bigger than the listed side.
    On the unlisted side, most of the clients/investors are institutional investors like Pension Funds,
     Insurance Co and Sovereign Wealth Fund.

                                                                                                           56
Differentiating Real Estate Investment Classes
RETURN

                                                             x
         Core+
         Good Asset @ Good Location,                        Opportunistic
         with good rental income                            Asset that might need to
         • 7 & 9 Tampines Grande         x                  redevelop or undergo major
                                                            renovation/ improvements
                       x                Value-Add
                                        Relatively Good Asset @ Good
           x                            Location, with potential rental
                                        improvement after renovation
                                        • Central Mall
      Core
      Quality Asset @ Prime Location,
      with stable rental income
      • Republic Plaza
                                                                            RISK

                                                                                         57
Route Map to AUM Target – US$5 billion by 2023

                                      Barbell Strategy

              CDL will create real estate vehicles with different risk return profile.
              This is translated on delivering performance to our clients and at the
              same time generating a stable, constant income stream

              CORE / CORE+                                VALUE ADD / OPPORTUNISTIC
Stable and constant income stream with    60%       40%     Higher risk returns through formation of joint
strong cash on cash return and less                         ventures and club deal initiatives focused
reliance on capital appreciation                            on bigger development projects.

                                         AUM Target
                                   US$5 billion
                                           by 2023

                                                                                                             58
Impact to CDL
1. Generate a new business division which will help to provide a stable
   income stream

2. Diversify and expand CDL customer base to include institutional
   investors

3. Adopting a balance sheet and asset light strategy which will improve
   ROE

4. Allows CDL to establish a capital recycling strategy while providing
   more flexibility and greater access to capital

                                                                          59
Innovation
Investments into New Economy Businesses

mamahome – China’s Fast-Growing Online Apartment Rental Platform
   Invested RMB 110 million to date
       Acquired 20% equity stake for RMB 100 million in Sep 2016
       Followed Series A round in Dec 2017 which includes new investor Futureland, dual-listed Chinese
        developer

   Apartment listings grew from 177,000 to 230,000 from across 30 cities in China

Distrii – China’s Leading Operator of Co-working Space
   Invested RMB 102 million to date
       Acquired 24% equity stake for RMB 72 million in Jan 2017
       In Sep 2017, participated in its Series A Funding of RMB 200 million, which
        includes new investors, i.e. Jingrui Holdings’ investment platform and Junzi
        Capital
       CDL is Distrii’s second largest shareholder after its founder

   First international center at Republic Plaza is expected to open in
    Q2 2018
                                                                                       Distrii Suhe Center, Shanghai
   Currently 26 locations with 29 in the pipeline across Shanghai,
    Beijing and Hangzhou

                                                                                                                       61
Inculcate Culture of Innovation to Achieve Growth
Innovation is a strategic lever for change and business transformation, and also a lever that
engage, empower and enable business breakthroughs

      Set up the Enterprise Innovation Committee as an anchor platform comprising of
      multi-disciplinary team members to:
       • explore new paradigms to increase value-add
       • assess problems and explore creative solutions to turn them into opportunities
       • explore new way of working for better efficiency and effectiveness

                 Business
                Performance

            Empower employees          Create competitive edge      Quicken business growth

                                                                                                62
Hospitality
M&C – Lapsed Final Cash Offer
Final Cash Offer of 620 pence for each M&C Share lapsed on 26 Jan 2018, 1300 GMT

Valid Acceptances of 47.14% as of Final Closing –
Did not meet threshold for offer to turn unconditional
Lapsed: Recommended Final Cash Offer
Cash Consideration     620 pence
                       Comprising 600 pence (cash) +
                       20 pence (special dividend)
                       per M&C share
Valuation              Approx. £2,014 million for M&C’s entire issued
                       ordinary share capital
CDL’s Equity           65.2% (211,749,487 shares)
Interest in M&C
                       As at 9 Oct 2017

 The Group respects the decision by M&C’s minority shareholders in       Millennium Broadway Hotel New York
  the lapsed offer and remains committed to maintaining its controlling
  shareholding in M&C, supporting M&C’s strategy as a hotel owner
  and operator

 Moving forward, the Group is fully prepared for M&C to address the
  operating challenges and with all M&C shareholders, share the
  burden of the significant capital expenditure required to improve the
  hotels’ performance, in line with its competitors

                                                                                                               64
M&C Hotel Operations
Trading Performance
                                                        Reported                      Constant
                                                        Currency                      Currency
                                     FY 2017             FY 2016       Change         FY 2016          Change

    Revenue                             £1,008m              £926m         8.9%            £972m        3.7%
    Revenue (hotel)                       £880m              £814m         8.1%            £853m        3.2%
    Profit before tax                     £147m              £108m        36.1%            £114m       28.9%
    PATMI                                 £124m                £78m       59.0%
     In constant currency, Group RevPAR increased by 1.2% and 3.2% for Q4 and FY 2017.
     Increase in revenue is driven by full year contribution from Millennium Hilton New York One UN Plaza
      (previously known as ONE UN New York) which was re-opened in September 2016 after refurbishment
      and Grand Millennium Auckland (joined the Group in September 2016), as well as higher land sales in
      New Zealand.
     PATMI surged 59% due to a release of £17m tax provision in relation to exposures in Singapore that are
      finalised, reversal of impairment of shareholder loan to Fena Estate Co Ltd of £12m and lower impairment
      losses in 2017.

                             Millennium Hilton New York One UN Plaza       Grand Millennium Auckland

                                                                                                                 65
M&C Hotel Operations
Trading Performance

     RevPAR in reported currency and constant currency were up by 7.9% and 3.2% respectively for FY 2017
      as compared to the same period last year:

                             FY 2017          Reported Currency Constant Currency
     New York                £164.84              ↑ 13.2%            ↑ 7.7%
     Regional US             £61.90                ↑ 7.7%            ↑ 2.5%
     Total US                £95.79               ↑ 10.7%            ↑ 5.4%
     London                  £109.98               ↑ 2.6%            ↑ 2.6%
     Rest of Europe          £53.66                ↑ 2.0%            ↓ 0.3%                               Millennium Seoul Hilton

     Total Europe            £82.35               ↑ 2.6%             ↑ 1.9%
     Singapore               £83.83                ↑ 4.5%            ↓ 0.9%
     Rest of Asia            £64.39                ↑ 6.2%            ↓ 1.0%
     Total Asia              £71.91               ↑ 5.4%             ↓ 1.0%
     Australasia *           £73.06               ↑ 25.1%           ↑ 16.3%
     Total Group             £82.78               ↑ 7.9%             ↑ 3.2%                               Grand Hyatt Taipei

         *   Stellar performance for Grand Millennium Auckland, which joined the hotel portfolio in Sep 2016. This hotel is a major contributor to
             the 16.3% increase in RevPAR for FY 2017.

                                                                                                                                                     66
M&C Hotel Operations
Group RevPAR Up 3.2% at Constant Rates                                                                                  * Restated at FY 2017 rates

                     New York: Excl One UN, the                             Singapore: RevPAR down
  £
                                                                                                                 Rest of Asia: RevPAR down in
                     RevPAR increase is only 0.2%.                          due to reduced room rates.           most hotels. Seoul 7.5% down
 180                                                                        Higher     occupancy partly          compensated by 5.5% growth in
                                                    7.7%                    offsets the decline.                 Taipei
          London: All London hotels except
 160      Chelsea Harbour experienced
          RevPAR        growth.     Recently
 140      refurbished     Bailey’s   enjoyed                                                                                    FY 2016*
          double digit growth in RevPAR.
                                                                                                                                FY 2017
 120          2.6%

 100
                                                                                              (0.9%)
  80                                                    164.84                                                                         16.3%
                                               153.03
                                                                                                                   (1.0%)
                                                                        2.5%
  60                            (0.3%)
          107.18 109.98

  40                                                                                       84.58     83.83
                                                                                                                                            73.06
                                                                    60.41     61.9                              65.05   64.39       62.84
                             53.83   53.66
  20

   0
             London        Rest of Europe         New York         Regional US             Singapore           Rest of Asia        Australasia

      Rest of Europe: RevPAR declined largely           Regional US: RevPAR up in                  Australasia: Excl Grand Millennium Auckland
      due to Rome experiencing lower occupancy.         recently refurbished properties.           and recently opened M Social, the RevPAR
                                                        Mix results else where. Overall            increase is 7.7%. Growth is driven by increased
                                                        positive RevPAR growth.                    overseas visitors

                                                                                                                                                      67
M&C Hotel Operations
Asset Enhancement
                                                                                     M Social Auckland
                                                                                     (former Copthorne Hotel Auckland Harbourcity)
                                                                                            Soft opened in Oct 2017

                                                                                         Hua Ting (Orchard Hotel Singapore) –
                                                                                         Chairman’s Room
                                                                                             Renovation works at Hua Ting completed;
M Social Auckland – Lifestyle hotel with 190 guest rooms
                                                                                              restaurant reopened in Dec 2017

       Millennium Hotel London Mayfair                Millennium Hotel London Knightsbridge            Grand Millennium Kuala Lumpur

          Commence refurbishment in Q4 2017;             Refurbishment to commence in 2019             Final phase of refurbishment works
           scheduled completion in Q2 2019                                                                (guestrooms at levels 7 & 8) under review

                                                                                                                                                      68
M&C Hotel Operations
 Hotel Room Count and Pipeline
                                      Hotels                  Rooms
                                31 Dec       31 Dec       31 Dec    31 Dec
Hotel and Room Count             2017         2016         2017      2016
By region:
● New York                             4              4     2,238    2,238
● Regional US                         15             15     4,559    4,559
● London                               8              8     2,649    2,651
● Rest of Europe                      21             19     3,528    3,081
● Middle East *                       31             26    10,346    7,805
● Singapore                            7              7     3,011    3,011    The Lakefront Anchorage
● Rest of Asia                        25             27     9,240   10,036
● Australasia                         25             25     3,831    3,641
Total:                               136            131    39,402   37,022

Pipeline
By region:
● Middle East *                       10            17      3,239     5,465
● Asia                                 4             4      1,594     1,608
● Regional US
  Artist’s Impression
                                       1             1        263       263
● Artist’s
   Rest Impression
           of Europe                   1             1        184       153
● Australasia                          1             -         42       -     Millennium Biltmore Hotel Los Angeles

Total:                                17            23      5,322     7,489
          *   Mainly franchise contracts for 2017

                                                                                                                      69
CDL Hospitality Trusts
Trading Performance

S$’000               FY 2017    FY 2016     Change

Gross Revenue        204,315    180,857       13.0%

Net Property
                     151,760    137,560       10.3%
Income (NPI)

                                                       The Lowry Hotel

 Gross revenue and NPI increased mainly due to :
      Inorganic contribution from both The Lowry Hotel and Pullman Hotel Munich which
         were acquired in 2017
      Stellar performance from New Zealand Hotel as a result of higher variable rent
      Stable performance of Singapore hotels while there was higher contribution from
         Claymore Connect

 This was partially offset by :
       Lower contributions from the Japan and Maldives market due to competitive trading
         environment
       Lower contribution from Hilton Cambridge City Centre, United Kingdom due to
         weaker GBP

                                                                                            70
Disclaimer:

This document may contain forward-looking statements that involve
assumptions, risks and uncertainties. Actual future performance, outcomes
and results may differ materially from those expressed in forward-looking
statements as a result of a number of risks, uncertainties and assumptions.
Representative examples of these factors include (without limitation) general
industry and economic conditions, interest rate trends, cost of capital and
capital availability, availability of real estate properties, competition from other
developments or companies, shifts in customer demands, customers and
partners, expected levels of occupancy rate, property rental income, charge
out collections, changes in operating expenses (including employee wages,
benefits and training costs), governmental and public policy changes and the
continued availability of financing in the amounts and the terms necessary to
support future business. You are cautioned not to place undue reliance on
these forward-looking statements, which are based on the current view of
management on future events. Numbers in tables and charts may not add up
due to rounding.
New Futura, Singapore
www.cdl.com.sg
You can also read