NEINOR RENTAL Non-Deal Roadshow - April 2021
←
→
Page content transcription
If your browser does not render page correctly, please read the page content below

NEINOR RENTAL
   Non-Deal Roadshow

       April 2021

IBEX MID CAP®
DISCLAIMER
 This Presentation has been prepared by Neinor Homes, S.A. (“Neinor”) for information purposes only and it is not regulated information or           other companies operating in the same sector and industry. This information has been derived from publicly-available sources and Neinor
 information which has been subject to prior registration or control by the Spanish Securities Market Commission. “Presentation” means this          accepts no responsibility whatsoever and makes no representation or warranty expressed or implied for the fairness, accuracy, completeness or
 document, its contents or any part of it, as well as any oral presentation, any question or answer session and any written or oral material         verification of such information.
 discussed or distributed during meetings carried out in connection with this document This Presentation may not be reproduced in any form,          Certain financial and statistical information contained in this Presentation is subject to rounding adjustments. Accordingly, any discrepancies
 used or further distributed to any other person or published, in whole or in part, for any purpose without the express and prior written            between the totals and the sums of the amounts listed are due to rounding. Certain management financial and operating measures included in
 consent of Neinor. Failure to comply with this obligation may constitute a violation of applicable securities laws and/or may result in civil,      this Presentation have not been subject to a financial audit or have been independently verified by a third party. In addition, certain figures
 administrative or criminal penalties.                                                                                                               contained in this Presentation, which have also not been subject to financial audit, may be combined and pro forma figures.
 Neither Neinor nor any of its employees, officers, directors, advisers, representatives, agents or affiliates shall have any liability whatsoever   The financial information contained herein may include items which are not defined under the International Financial Reporting Standards as
 (in negligence or otherwise, whether direct or indirect, in contract, tort or otherwise) for any loss howsoever arising from any use of this        adopted by the European Union (IFRS-EU) and which are considered to be “alternative performance measures”. Other companies may calculate
 Presentation or its contents or otherwise arising in connection with this Presentation.                                                             such financial information differently or may use such measures for different purposes, limiting the usefulness of such measures as comparative
 Neither this Presentation nor any part of it constitutes a contract, nor may it be used for incorporation into or construction of any contract or   measures. Such financial information must be considered only in addition to, and not as a substitute for or superior to, financial information
 agreement.                                                                                                                                          prepared in accordance with IFRS-EU.
 This Presentation may include forward-looking statements about revenue and earnings of Neinor and about matters such as its industry,
 business strategy, goals and expectations concerning its market position, future operations, margins, profitability, capital expenditures,          IMPORTANT INFORMATION: This Presentation does not constitute or form part of any purchase, sales or exchange offer, nor is it an invitation to
 capital resources and other financial and operating information. The words “believe”, “expect”, “anticipate”, “intends”, “estimate”,                draw up a purchase, sales or exchange offer, or advice on any stock issued by Neinor. In particular, this Presentation and the information
 “forecast”, “project”, “will”, “may”, “should” and similar expressions may identify forward-looking statements. Other forward looking               contained herein do not form part of or constitute (i) an offer to acquire or subscribe shares, in accordance with the Spanish Securities Market
 statements can be identified from the context in which they are made. These forward-looking statements are based on numerous                        Act and its implementing regulation or (ii) an offer to purchase, sell or exchange securities, a solicitation of any offer to purchase, sell or
 assumptions regarding the present and future business strategies of Neinor and the environment in which Neinor expects to operate in the            exchange securities or a solicitation of any kind of voting rights in the United States or any other jurisdiction.
 future. These forward-looking statements involve known and unknown risks, uncertainties and other factors, which may cause the actual               The securities of Neinor have not been and will not be registered under the U.S. Securities Act of 1933, as amended (the “US Securities Act") or
 results, performance or achievements of Neinor, or industry results, to be materially different from those expressed or implied by these            the laws of any state or other jurisdictions of the United States. Such securities may not be offered or sold in the United States except on a
 forward-looking statements. Forward-looking statements should not be taken as forecasts or promises and they should not be taken as                 limited basis, if at all, to Qualified Institutional Buyers (as defined in Rule 144A under the US Securities Act, as amended) in reliance on an
 implying any indication, assurance or guarantee that the assumptions on which such forward-looking statements have been prepared are                exemption from, or transaction not subject to, the registration requirements of the US Securities Act. The securities of Neinor have not been
 correct or exhaustive or, in the case of the assumptions, fully stated in the Presentation. As a result, you should not place undue reliance on     and will not be registered under the applicable securities laws of any state or jurisdiction of Australia, Canada, Japan or Switzerland and, subject
 these forward-looking statements as a prediction of actual results or otherwise.                                                                    to certain exceptions, may not be offered or sold within Australia, Canada, Japan or Switzerland or to or for the benefit of any national, resident
 The information in this Presentation, which does not purport to be comprehensive, has not been independently verified and will not be               or citizen of Australia, Canada, Japan or Switzerland.
 updated. The information in this Presentation, including but not limited to forward-looking statements, applies only as of the date of this         The information contained in this Presentation does not constitute investment, legal, accounting, regulatory, taxation or other advice and the
 Presentation and is not intended to give any assurances as to future results. Neinor expressly disclaims any obligation or undertaking to           information does not take into account your investment objectives or legal, accounting, regulatory, taxation or financial situation or particular
 disseminate any updates or revisions to the information, including any financial data and any forward-looking statements contained in this          needs. You are solely responsible for forming your own opinion and conclusions on such matters and the market and for making your own
 Presentation, and will not publicly release any revisions that may affect the information contained in this Presentation and that may result        independent assessment of the information included in this Presentation. You are solely responsible for seeking independent professional
 from any change in its expectations, or any change in events, conditions or circumstances on which these forward-looking statements are             advice in relation to the information contained herein and any action taken on the basis of the information contained herein. No responsibility
 based or any change in whichever other events or circumstances arising on or after the date of this Presentation.                                   or liability is accepted by any person for any of the information or for any action taken by you or any of your officers, employees, agents or
 Market data and competitive position used in this Presentation not attributed to a specific source are estimates of Neinor and have not been        associates on the basis of the information included in this Presentation.
 independently verified. In addition this Presentation may contain certain information in relation to

                                                                                                                                                                                                                                                                                                            2
NEINOR RENTAL
    KEY INVESTMENT HIGHLIGHTS

                           Strong PRS fundamentals in Spain supported by demographic trends and a lack of rental supply

                               Unique capabilities to develop new multifamily rental product at ~6% Gross Yield-on-Cost

                                 100% Value-Add and NAV growth strategy underpinned by 100-150bps yield compression

                                Prudent Leverage (20% Pro-Forma1 LTV FY20) providing headroom to grow the rental business

                           Attractive entry point at a discount to the liquidation value of the development business

                                                       The Spanish leading fully integrated residential platform
1. Net debt pro-forma post merger by absorption with Quabit.
                                                                                                                          33
                                                                                                                          3
Contents

 01             02             03              04               05
NEINOR HOMES:   SPANISH PRS   NEINOR RENTAL:   NEINOR RENTAL:   APPENDIX
AT A GLANCE     MARKET        PORTFOLIO        FINANCIALS
                              OVERVIEW

                                                                           4
01
NEINOR HOMES:
AT A GLANCE

Plaza Europa 14 HOMES I

NEINOR HOMES: AT A GLANCE
THE SPANISH LEADING FULLY INTEGRATED RESIDENTIAL PLATFORM

                         PRIVATE COMPANY                                                               PUBLIC    COMPANY

    S TAGE 1: L AND BANK AND INDUSTRIALIZATION           PROCESS     S TAGE 2: D EVELOPMENT RAMP- UP                   S TAGE 3: R ENTAL EXPANSION

                          2016                     2017                                                                                  2021
  ▪ Lone Star acquires   ▪ Major land           ▪ IPO March 2017   ▪ A profitable           ▪ +1.3k units         ▪ Execution in spite   ▪ First PRS Acquisition
    Neinor from            acquisitions                              company, +1k             delivered             COVID: +€110mn         (€58mn)
                                                ▪ Expansion into
    Kutxabank                                                        deliveries and                                 EBITDA
                         ▪ Process                Málaga and                                ▪ EBITDA +€100mn                             ▪ Merger by
                                                                     +50mn EBITDA
  ▪ Basque developer       industrialization      Valencia                                                        ▪ Launch Neinor          absorption with
                                                                                            ▪ New business
    with 30 years of                                               ▪ First strategic land                           Rental with 1.2k       Quabit
                         ▪ Regional presence:                        acquisitions
                                                                                              plan, management
                                                                                                                    units
    history and a
                           Madrid, Bilbao,                                                    reshuffle                                  ▪ To reach run-rate
    4,000-unit land
                           Barcelona and                                                                          ▪ Acquisition of         target: c2.5k
    bank
                           Cordoba                                                                                  OpCo (Renta            deliveries and
                                                                                                                    Garantizada)           €150mn EBITDA
                                                                                                                                                                   6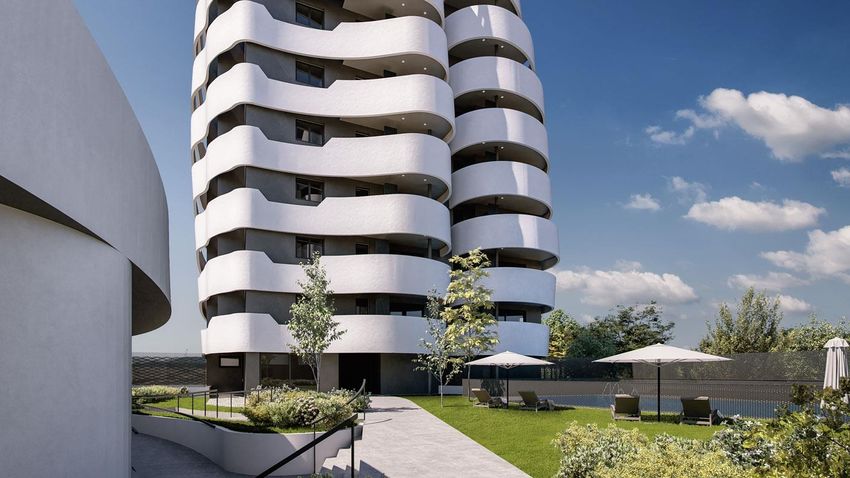
NEINOR HOMES: AT A GLANCE
THE SPANISH LEADING FULLY INTEGRATED RESIDENTIAL PLATFORM

                                    LAND BANK                                                                                 RESIDENTIAL DEVELOPMENT
                                  C16,500 UNITS
                              +€2BN GAV AND +€1.4BN NAV                                                                   GAV: 1,760MN      UNITS: C13,000

                                                                     SOLID RESI.
          ESG                                                     FUNDAMENTALS
    LEADERSHIP                      COMPANY                             IN THE TOP-6                                             RENTAL PLATFORM
                                                                      REGIONS OF SPAIN
    TOP 4% IN GLOBAL
      REAL ESTATE1                  STRATEGY                                                                              GAV: 280MN        UNITS: Up to c3,500

           PRUDENT LEVERAGE                        GOOD BP VISIBILITY
            AND SH. RETURNS                           +6,500 UNITS UNDER                                                       RESIDENTIAL SERVICES
                                                         CONSTRUCTION
                 PF NET LTV AT 20%                                                                      AUMS: ~1,300MN (KUTXABANK) AUMS: ~2,500# (RENTA GARANTIZADA)
                     & 6% DY

1. According to Sustainalytics Risk Rating assessment. 2. 6% Dividend Yield computed with share price as of 21/04/2021.
                                                                                                                                                                       7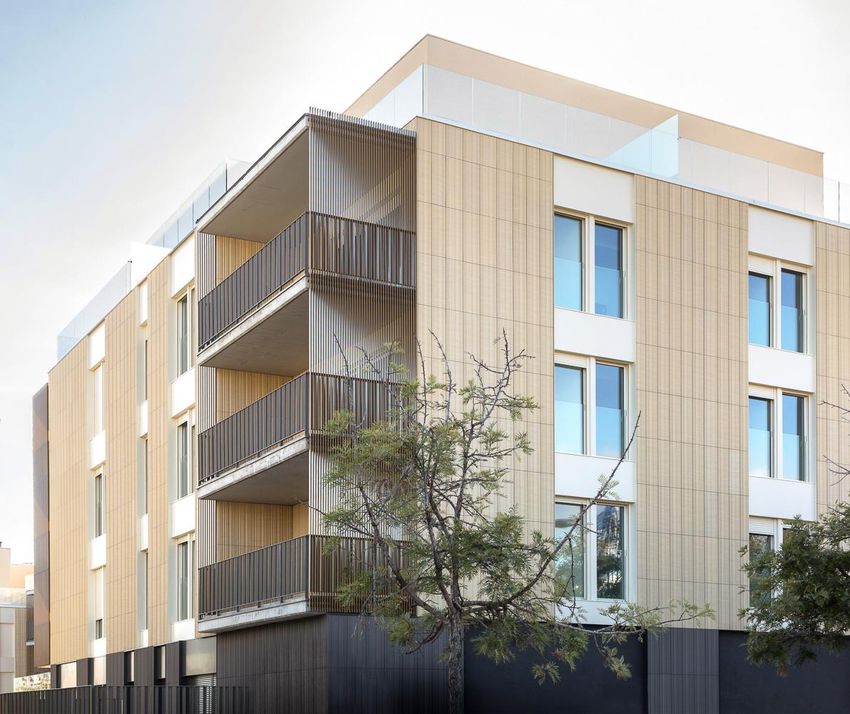
NEINOR HOMES: AT A GLANCE
LAND PORTFOLIO CONCENTRATED ON THE TOP-6 REGIONS OF SPAIN
                     LAND BANK BREAKDOWN                                                               GEOGRAPHICAL FOOTPRINT
            GAV by Type             GAV by Urban Status
                                           Strategic                      Total GAV: +2,000MN                                          (As a % of Total GAV)
   Rental                                     4%
    14%                                                                     The residential services                  NORTH
                                                                           business is excluded from
                                                                                GAV appraisal
                                                                                                                        13%

                                                                                                                                            EAST
                                                                                                                                      13%
               Development                                                                                             32%
                   86%                                  Fully Permitted
                                                              94%
                                                                                                                     CENTRE     LEVANTE
Development GAV by Type              Rental GAV by Type
                                                                                                                                10%
                                                       Rented                                                  6%
                                                        21%
                  Land                                                                                 SOUTH
                  28%               Land                                                               WEST
                                    55%                    WIP                                                          SOUTH
 WIP & FP                                                  24%                                                      26% EAST
   65%                   Launched
                            7%

                                                                                                                                                          8
NEINOR HOMES: AT A GLANCE
100% VALUE-ADD AND NAV GROWTH STRATEGY
                    NEINOR RENTAL STRATEGY                                                              NEINOR RENTAL VALUE PROPOSITION
                ▪ Develop new multifamily product in a undersupplied market
  STRATEGY         with strong growth fundamentals
                                                                                    % Yield     ~6%                             ~5%                   ~4.7%
                                                                                    on Cost
   RENTAL       ▪ Up to 3,500 units portfolio, overweight in Madrid (approx. 66%)
  PORTFOLIO        with stabilized GRI of €36mn

                ▪ Land is equity financed and construction capex through
  FINANCING        development loans. We have financing secured for c1,500 units    % Yield
                   (c50% of portfolio)                                              on GAV
                                                                                              5.0%            (1.1%)

                ▪ Target 100-150bps yield compression leading to ~20-30%                                                        3.9%         (0.3%)
   TARGET          valuation upside                                                                                                                    3.6%
   RETURNS      ▪ ~10% FFO Yield, similar to what we target at the development
                   business
                ▪ Proven land acquisition track record that is key to deliver on
  GROWTH           yield on cost expectations
OPPORTUNITIES   ▪ Analysing organic and inorganic options to accelerate growth
                   and reach 5,000 units target
                                                                                          Gross   Rental
                                                                                            Gross Rental     Property
                                                                                                            Property opex    NetOperating
                                                                                                                             Net   Rental    SG&A     EBITDA
                                                                                                                                             SG&A     EBITDA
                                                                                              Income
                                                                                          Income    (GRI)   expenses            Income
                                                                                                                            Income   (NRI)
    TAX         ▪ EDAV: 3.75% CIT and only 4% on VAT for asset transfers

MANAGEMENT      ▪ Internally managed through RG acquisition in 2020
                                                                                                                                                               9
02
SPANISH PRS MARKET

Plaza Europa 14 HOMES I
SPANISH PRS MARKET
FAVOURABLE MACRO BACKDROP OVER THE NEXT THREE YEARS
▪ Spanish economy to outperform other European economies over the next 3Ys ▪ Spanish economy is expected to create 3mn jobs until 2023
REAL GDP GROWTH (ANNUAL % CHANGE) UNEMPLOYMENT RATE (IN %)
4.6% 4.1% 3.9% 3.7% 3.1% 2.9% 3.5%
6.4
5.8
-2.4%
5.3
5.1
4.8
26%
4.7
4.2
4.4
4.2
3.9
3.9
3.6
3.6
CAGR 11-21
3.4
25%
2.8
2.5
24%
2.3
1.7
1.6
1.6
2
21% 22%
(4.9)
20%
(6.1)
(7.6)
(8.2)
(8.9)
(11.0)
(9.9)
17% 17%
15% 16% 16% 15%
14% 15% 14% 15%
2020A 2021E 2022E 2023E 2011 2013 2015 2017 2019 2021 2023 2025
▪ The Consumer Confidence Index is recovering from the ongoing pandemic ▪ Net Debt to GDP is expected to remain relatively stable
2021
CONSUMER CONFIDENCE INDEX (IN %)(1) NET DEBT (% OF GDP)
110 144.2
150
105 104.5
100 106.1
100
100 97.2
Covid19
98 50 52.5
95 impact
0
90 2011 2013 2015 2017 2019 2021 2023 2025
2011 2012 2013 2014 2015 2016 2017 2018 2019 2020 2021
Spain Portugal France United Kingdom Germany Italy
Source: IMF (2021), OECD (2021); Note: (1) Long-term average = 100 (03/2011 – 03/2021) 11SPANISH PRS MARKET
STRONG FUNDAMENTALS SUPPORTED BY DEMOGRAPHIC TRENDS AND LACK OF RENTAL SUPPLY
▪ Spain has the 3rd (MADRID) and 5th (BARCELONA) largest metropolitan ▪ …that will outpace in absolute and relative all the other Top-10 metropolitan
areas in Europe… areas throughout the next decade
Paris 10.8
16%
London 10.3 14%
MADRID
RELATIVE GROWTH (000’S)
Madrid 6.3 12%
OTHER CITIES IN SPAIN BARCELONA
10%
Berlin 6.0 LONDON
2.6 Valencia 8%
PARIS
Barcelona 5.2 6%
2.0 Sevilla
Rome 4% BERLIN
3.7 1.8 Alicante
2% MILAN
Milan 3.1 1.6 Málaga ROMA
0%
Athens 3.0 1.2 Bilbao 100 200 300 400 500 600 700 800
ABSOLUTE GROWTH (000’S)
▪ JLL estimates that the rental should represent 35-40% of the housing ▪ …but Spain has one of the lowest finished houses per 1k inhabitants in Europe
market: Each +1pp implies c180k new rental homes.
12
▪ New housing starts in 2020 have decreased
(2019 completed units
per 1k/inhabitant)
9 by c21% (75k units = 2017 levels)
49% 3.85x
+9pp 35% 36% 34% 6 EU avg.
28%
24%
20%
15% 3
1.52
Spa i n Ital y Un it ed Kin gd om Fran ce Ge rma ny EU
0
2001 2008 2019 2019 BG BA PT SP LV HU UK DK CZ DE SK NL IE BE PL IL NO FR LU
Source: Eurostat and INE 12SPANISH PRS MARKET
STRONG FUNDAMENTALS SUPPORTED BY DEMOGRAPHIC TRENDS AND LACK OF RENTAL SUPPLY
▪ Demographic trends underpin housing demand growth especially ▪ Rental market share for the younger cohorts of the population has
for smaller units and for rent doubled
60%
120 +462k rental 52%
households 50%
115 116
+381k 1-person 40% 28%
households 32%
110 30%
109 +408k total
105 households 20%
102 15%
100 +209k 10%
100 7%
inhabitants
0%
95
2004 2007 2010 2013 2016 2019
2013 2014 2015 2016 2017 2018 2019
16-29 30-44 45-64 >65
Population Households One-person households Rental households
▪ Rents grew 43% on average since the trough of the market in 2014 with
▪ Average Rents have outperformed average house prices since 2015 no material distinction in growth rates COVID19 IMPACT FELT MORE
IN MADRID AND BCN
16
BARCELONA – 7% CAGR
130 13 MADRID – 6% CAGR
120
110 10 MALAGA – 7% CAGR
100 VALENCIA – 8% CAGR
90 7 ALICANTE – 5% CAGR
80 CORDOBA – 5% CAGR
70 4
1Q06
4Q06
3Q07
2Q08
1Q09
4Q09
3Q10
2Q11
1Q12
4Q12
3Q13
2Q14
1Q15
4Q15
3Q16
2Q17
1Q18
4Q18
3Q19
2Q20
1Q21
House Prices (€/sqm) Rents (€/sqm/m)
MADRID BARCELONA VALENCIA ALICANTE MALAGA CORDOBA
Source: INE and Idealista. 1303 NEINOR RENTAL: PORTFOLIO OVERVIEW Marina Badalona HOMES I
NEINOR RENTAL: PORTFOLIO OVERVIEW
PRODUCT CHARACTERISTICS AND GEOGRAPHICAL FOOTPRINT
            RENTAL PRODUCT CHARACTERISTICS                                                      GEOGRAPHICAL FOOTPRINT
      AVG. SIZE          MONTHLY RENT              EFFORT RATE                 % over number
                                                                        #%        of units
 80-100/sqm, 1-2beds       €800-1,000                  ~30%                                                           7%

    RENT REGIME         100% MULTIFAMILY         TENANT PROFILE
   100% FREE RENT       And 100% ownership                                                                       NORTH                   6%
                                                    26-35 YEARS       Total GAV: 280MN
                                                                         (14% OF TOTAL GAV)
  AMENITIES OFFER         RECENTLY BUILT       ATTRACTIVE LOCATIONS
  Gym, pool, common     100% portfolio built
                                                 For rental assets
                                                                         Units: c2,350                          54%
  areas, 24h security       after 2007
                                                                           GLA 228K SQM                                           EAST

                    OPERATING PORTFOLIO
                                                                                                            CENTRE          13%
                                                                                                                           LEVANTE

                                                                      Total GAV: +700MN
                                                                       (20%-30% OF TOTAL GAV)

                                                                          Units: c3,500              21%
                                                                             GLA 361K SQM

                                                                                                        SOUTH

                                                                                                                                              15
NEINOR RENTAL: PORTFOLIO OVERVIEW
DELIVERY SCHEDULE BY PROJECT
21YE OPERATIONAL TARGETS
ACQUISITION OF SARDES 537 units 996 units 815 units
PORTFOLIO (FEB21) operating under design/ +1,127 units from
WIP by YE
(10 assets) licensing Quabit Portfolio 2
(6 projects)
(5 projects)
DELIVERY OF SKY DELIVERY OF PARLA DELIVERY OF ZORROZAURE AND
HOMES (2H22) DELIVERY OF EUROPA QUABIT JOAQUIN LORENZO (2024)
HOMES (2H23)
NEW HOMES (1H23) PORTFOLIO 1
ACQUISITIONS (2024)
391 UNITS 213 UNITS 402 UNITS
146 UNITS 147 UNITS
559 UNITS
2020 2021 2022 2023 DELIVERY OF DELIVERY OF
2024
DELIVERY OF HACIENDA
ACQUISITION OF HOMES (1H21)
NEW GRAN CAPITAN SERENA HOMES DELIVERY OF
ACQUISITIONS (1H23) DUAL HOMES
OPCO (OCT20) (2H23) (2H23)
146 UNITS
138 UNITS 66 UNITS 140 UNITS
16NEINOR RENTAL: PORTFOLIO OVERVIEW
WIPS PORTFOLIO
ASSET DESCRIPTION
HACIENDA HOMES (MALAGA)
Hacienda Homes is a singular project, which
LOCATION Málaga stands out because of its innovative
architecture, its careful design and its elegance
GLA (SQM) 14,339 at the service of comfort. The residential
UNITS (#) 146 complex is made up of 146 units which benefit
from a garden area, a community pool and a
GAV (€MN) 23 gourmet space.
DELIVERY Hacienda Homes is located in the Teatinos
1H21
neighbourhood of the city of Malaga. It has
excellent connections by road and public
transports (metro and bus) and is located in a
big expansion area that is surrounded by the
University, Hospitals, Health Centers, primary
and secondary educational centers, sports
centers, supermarkets, etc.
Hacienda Homes has BREEAM Good
certification which translates into important
economical benefits for its users with a decrease
of energy consumption between 50-70% and
40% lower water usage.
17NEINOR RENTAL: PORTFOLIO OVERVIEW
WIPS PORTFOLIO
SKY HOMES (VALENCIA) ASSET DESCRIPTION
Sky Homes is an attractive and singular four
LOCATION tower project with modern and avant garde
Valencia
architecture. Each of the four buildings is 20
GLA (SQM) 25,062 stories high with pure and sophisticated lines
that shape the landscape over its influence area.
UNITS (#) 213
Sky Homes is located in the Malilla
GAV (€MN) 27 neighbourhood in front of the most important
Hospital in the autonomous community of
DELIVERY 2H22 Valencia with 6,000 daily workers and 300,000
patients per year.
The building has several amenities service with
heated swimming pools, gym, solarium,
children’s playground as well as a gastro bar in
the rooftop.
Sky Homes has BREEAM Good certification
which translates into important economical
benefits for its users with a decrease of energy
consumption between 50-70% and 40% lower
water usage.
18NEINOR RENTAL: PORTFOLIO OVERVIEW
WIPS PORTFOLIO
ASSET DESCRIPTION
EUROPA HOMES (MADRID)
San Sebastian de los Reyes Europa Homes is a two buildings complex in the
LOCATION (Madrid) municipality of San Sebastian de los Reyes. A
highly dynamic area that benefits from good
GLA (SQM) 16,245
communication infrastructure to the centre of
UNITS (#) 146 Madrid and has enjoyed a strong population
growth over the last decades.
GAV (€MN) 23
In addition in Europa Homes has a wide range of
DELIVERY 1H23 services available with schools, hospitals, sport
facilities as well as leisure and retail areas
nearby.
Inside the condominium Europa Homes has
common areas with a swimming pool, children
playground peacefully complemented by green
surroundings.
Europa Homes has BREEAM Good certification
which translated into important economical
benefits for its users with a decrease of energy
consumption between 50-70% and 40% lower
water usage.
19NEINOR RENTAL: PORTFOLIO OVERVIEW
WIPS PORTFOLIO
SERENA HOMES (MALAGA) ASSET DESCRIPTION
Serena Homes s a project located in the
LOCATION prestigious urbanization "Colinas del Limonar",
Málaga
in a specially cared environment and perfectly
GLA (SQM) 6,261 communicated with the rest of the city.
UNITS (#) 66 The homes of this residential are distributed
throughout the perimeter of the plot, generating
GAV (€MN) 8.8 a large interior area of open spaces and gardens,
recreation and relaxation areas, an indoor gym
DELIVERY 2H23 and a multipurpose room, large children's play
areas, a gourmet space and, finally, cascading
pools with a careful design in tune with the
vegetation. In addition, it has a water play area
for the little ones.
Serena Homes has BREEAM Very Good
certification which translated into important
economical benefits for its users with a decrease
of energy consumption between 50-70% and
40% lower water usage.
20NEINOR RENTAL: PORTFOLIO OVERVIEW
WIPS PORTFOLIO
ASSET DESCRIPTION
DUAL HOMES (MADRID)
Dual Homes is a singular project with two
LOCATION Cañaveral (Madrid) towers and is characterized by its circular
shaped lines and balconies which give the façade
GLA (SQM) 8,229 a unique and distinctive look. Between the two
UNITS (#) 140 buildings there is a wide common area with
leisure spaces and a swimming pool.
GAV (€MN) 9
Dual Homes is located in one of the most
DELIVERY important expansion areas of the city of Madrid.
2H23
It benefits greatly from the dynamism of a new
neighbourhood and it is perfect for those that
look for a peaceful residential area without
being far away from the city centre – 20min
drive by car.
Most of the new developments on this area are
build-to-sell and there isn’t practically any rental
supply. Currently there are only 30 vacant rental
units (source: Idealista).
21NEINOR RENTAL: PORTFOLIO OVERVIEW
WIPS PORTFOLIO
ASSET DESCRIPTION
PARLA HOMES (MADRID)
Parla Homes is a singular project made up by
LOCATION Parla (Madrid) three low rise buildings close to each other in
which each apartment has its own private
GLA (SQM) 13,200 terrace area.
UNITS (#) 147 In addition Parla Homes has big common areas
between the buildings with two swimming pools,
GAV (€MN) 9
children playground and is surrounded by green
spaces in a private condominium area.
DELIVERY 2H23
Parla is a dormitory city 30min south of Madrid
with excellent communications by car and train.
Over the last two decades Parla’s population
increased by +70% to 128k inhabitants showing
a strong demographic dynamism.
Currently the vacant rental stock in Parla is
extremely low with only 54 units available of
which none is new built (source: Idealista).
2204 NEINOR RENTAL: FINANCIALS Iturribarri HOMES I
NEINOR RENTAL: FINANCIALS
PROPCO KEY ASSUMPTIONS
                                                                                                  EVOLUTION OF RENTAL PORTFOLIO
                                                                            Operating Units YE                                                       3,477
              ▪   Target Occupancy: Assuming 95% occupancy                  Deliveries
                  for the whole portfolio with a conservative ~2            Launch date not defined
                                                                                                                                 2,348
                  year ramp-up period                                                              63%
                                                                                                  CAGR       1,946
              ▪   Average monthly rent: of +€900/unit or
                                                                                                                     1,196                                   1,127
                  +€8.80/sqm with Neinor portfolio clearly at a                             750
                  premium to these levels                                   537                                                           402
                                                                                   146              213
              ▪   Margins at target occupancy:
                                                                               2021            2022               2023                2024              >2024
                  ▪    NRI of +75% with up to 25% leakage
                  ▪    EBITDA of +72% with 3% SG&A expenses                                 STABILIZED GROSS RENTAL INCOME (€MN)
   KEY
ASSUMPTIONS       ▪    FFO at +50% with c50% LTV%
                                                                    Units         391          1,398                559               1,127             3,477
                  ▪    AFFO = FFO since refurbishment capex
                       needs will be limited
                                                                                                                                                        36.5
              ▪   Pending Construction Capex for Neinor and
                  Quabit 1 portfolio of €265m. Quabit portfolio 2                                 18.0
                  would require an additional investment of                                                                           10.0
                  c€140mn                                                          3.5                               5.0
                  ▪    By year 2021/22/23: €40/104/115mn
                                                                                  Sardes    Neinor Portfolio Quabit Portfolio 1 Quabit Portfolio 2      Total

                                                                                                                                                                     24
NEINOR RENTAL: FINANCIALS
RATIONALE FOR THE OPCO
RENTA GARANTIZADA GEOGRAPHICAL FOOTPRINT
COMPANY ▪ Accelerate transition to a mixed company by adding #% % over number of
units
DESCRIPTION Rental market DNA to Neinor’s existing platform
NORTH
Expansion Areas
▪ ~40 FTEs in a company with 25 years track record fully
covering asset and property management services to
both institutional investors and private owners EAST
CLEAR ▪ Control 100% of PRS value-chain from land
SYNERGIES acquisitions, tailor made rental project design,
AUMs: ~2,500#
construction, leasing and asset/property management
FOR NEINOR CENTRE LEVANTE
RENTAL ▪ Commercial synergies from the know-how collected
on second-hand rental market
PLATFORM
▪ Cost synergies from savings on Asset & Property
management services on Neinor’s rental platform and AUMs: +10,000#
contributing with extra €1-2mn EBITDA/year
SOUTH
SCALABLE ▪ RG is expanding its regional footprint to North, East,
Levante and South to multiply by +4x the size of its
BUSINESS platform in a business with clear economies of scale.
2505 APPENDIX Medina HOMES I
APPENDIX
     MAIN SPANISH PRS AND BTR PLAYERS
                                         MAIN PRS PLAYERS                                                                     MAIN BTR PLAYERS
     ▪        Highly fragmented market: These companies own c44,000 rental units                  ▪   Shortage of finalized residential multifamily product is triggering a high
              which represent c1% of the Spanish PRS market                                           demand for new specialized build-to-rent product by institutional investors.

                                                                                                            SELLERS                                          BUYERS

          29,2951

                           6,475
                                          3,200          2,379           2,564         c3,500
               1               2              3              4               5                6

1.       Testa and other subsidiaries controlled by Blackstone: Albirana Properties, Torbel
         Investment, Fidere, Euripo. Source: Colliers
                                                                                                                                                                                     27
APPENDIX
NEINOR RENTAL BALANCE SHEET AND CASH FLOW CASH CYCLE
~1.5 YEARS ~1.6 YEARS ~0.1 YEARS ~1 YEAR
LICENSING, DESIGN AND DELIVERY LEASED
LAND ACQUISITION CONSTRUCTION (UNDER PROPCO)
PROCUREMENT (TRANSFER TO PROPCO)
CASH FLOW As a % of Sales Price As a % of market value
OPERATING (100% CASH - - - 3.6%
-
CASH FLOWS FUNDED)
CAPEX (28%) (2%) (45%) - -
70-100% CAPEX
FINANCING, 100%
UNLEVERED NET (28%) 3.6%
(2%) (45%) ASSUMED FOR -
CASH FLOW
ILLUSTRATIVE PURPOSES
FINANCING - - (1.1%)
47% -
CASH FLOW 25% ASSET REVALUATION AT
LEVERED NET EBITDA LEVEL AND CHANGE
(28%) (2%) 2% - RISK-RETURN
ASSET 2.5%
CASH FLOW
BALANCE SHEET
INVESTMENT - - 125%
- 125%
PROPERTY
INVENTORY 28% 30% 100% - -
BANK
- - 47% (47%) (47%)
FINANCING
28APPENDIX
EFFICIENT TAX STRATEGY THROUGHOUT THE LIFE CYCLE OF THE RENTAL ASSETS
ORGANIZATION CHART KEY TAX CONSIDERATIONS
TAX REGIME EDAV SOCIMI
100%
INTERNAL TRANSFER VAT: 4% VAT: 10%
RENTAL INCOME CIT: 3.75% CIT: 0%
100%
ASSET DISPOSALS CIT: 12.5% CIT: 0%
Spanish Non Spanish Non
DIVIDENDS Corporate. Resident Corporate. Resident
CIT: 12.5% WHT: 0%-19% CIT: 12.5% WHT: 0%-19%
PROPCO TRANSFER FINISHED ASSETS AT
(EDAV) REDUCED RATE OF 4% VAT DEVCOS ▪ Minimum 8 units. In lease or ▪ >80% of assets are properties
offer for lease each FY for rent, land to develop rental
properties or stakes in other
▪ Minimum 3 years of lease REITs
ASSET MANAGEMENT AND OTHER activity ▪ Minimum holding period of 3
PROPERTY MANAGEMENT years
REQUIREMENTS ▪ Minimum 55% of activities of
OPCO PropCo subject to Rental leases ▪ Minimum free-float of €2mn on
ASSET & PROPERTY MANAGER official or alternative exchanges
▪ No listing or dividend
requirement ▪ Distribute at least 80% of Net
75% Income as dividends
29APPENDIX
ILLUSTRATIVE BUILD-TO-RENT AND PRS TRANSACTIONS
BUILD-TO-RENT: MAIN TRANSACTIONS
MENDEZ ALVARO SAN LUIS VALDEBEBAS
▪ AREA: 11,200 sqm ▪ AREA: 15,000 sqm ▪ AREA: 31,774 sqm
▪ UNITS: 135 ▪ UNITS: 146 ▪ UNITS: 391
▪ BUYER/SELLER: AXA ▪ BUYER/SELLER: ▪ BUYER/SELLER:
IM/Acciona Vivenio/Naropa Hines/Acciona
PRICE/NIY: €60MN / 3.75% PRICE/NIY*: €62MN / 2.8% PRICE/NIY*: €142MN / 3.5-4%
VALDEBEBAS PORTFOLIO MADRID - SKYLINE
▪ AREA: 22,700 sqm ▪ LOCATION: Madrid & BCN ▪ AREA: 36,390 sqm
▪ UNITS: 400 ▪ UNITS: 504 ▪ UNITS: 300
▪ BUYER/SELLER: ▪ BUYER/SELLER: Vivenio/Fidere ▪ BUYER/SELLER:
Ares/Amenabar (Blackstone) M&G/Stoneweg
PRICE/NIY: €110MN / 3.5-4.0% PRICE/NIY: €86MN / 3.1% PRICE/NIY**: €125MN / 2.4%
Source: Colliers
* Estimated Yield. ** Year 1
30APPENDIX
ILLUSTRATIVE BUILD-TO-RENT AND PRS TRANSACTIONS
BUILD-TO-RENT: MAIN TRANSACTIONS
MADRID MADRID MADRID/BCN
▪ LOCATION:
Cañaveral/Torrejon/Alcala ▪ LOCATION: Madrid Region ▪ AREA: 28 buildings
▪ UNITS: 500 ▪ UNITS: 1,000 ▪ UNITS: 850
▪ BUYER/SELLER: Ares/Aedas ▪ BUYER/SELLER: AXA ▪ BUYER/SELLER: AXA IM/GS
Homes IM/Tectum & BCapital
PRICE/NIY: €70MN / N.A. PRICE/NIY: €150MN / N.A. PRICE/NIY: €150MN / N.A.
BADALONA MADRID MALLORCA
▪ AREA: 28,000 sqm ▪ LOCATION: Madrid & ▪ LOCATION: City of Mallorca
Arganda del Rey
▪ UNITS: 215 ▪ UNITS: 200
▪ UNITS: 121
▪ BUYER/SELLER: AXA ▪ BUYER/SELLER: ▪ BUYER/SELLER:
IM/Stoneweg Ares/Metrovacesa AEW/Metrovacesa
PRICE/NIY: €77MN PRICE/NIY: €29MN / N.A. PRICE/NIY: N.A. / N.A.
Source: Colliers
* Estimated Yield. ** Year 1
31APPENDIX
SPANISH RENTAL MARKET REGULATION
KEY CONSIDERATIONS ON THE NEW LAU1 PUBLISHED AS OF 2019
▪ The lease agreement is automatically renewed yearly until it reaches a minimum term of 5 years, or unless the tenant
rejects the renewal under specific conditions
LEASE TERM
▪ The lease term is agreed by the parties. Unless stated otherwise, the lease agreement is entered into a term of one year
▪ Increase in annual rents linked to Consumer Price Index unless otherwise agreed by the parties
RENT UPDATES
▪ Once the lease is terminated, the company may increase the rent to adjust to market level
▪ After 6 months, the tenant can terminate the contract with a mandatory notice period of 2 months and 1 month penalty
TERMINATION OF CONTRACT for each pending year
▪ Recent regulation changes reduce the timing and complexity of the eviction procedure in case of delinquency (APPENDIX
SPANISH RENTAL MARKET REGULATION – BARCELONA CASE STUDY
RENTAL MARKET IMPACT
▪ The rule aims to limit rent increases: new contracts ▪ -10.2% decrease in stock in Barcelona, vs +1.7% in +1.7%
signed on properties that were already rented may not Madrid. The effect is more significant when
LAW exceed the price of the previous contract comparing regulated vs non-regulated stock
variations in Catalonia: -11.7% vs -1.2%
DESCRIPTION ▪ Furthermore, if the previous contract was set to a
RENT CONTROL START
higher rent than the reference index, the new contract -10.2%
must adjust downwards to the benchmark level
▪ The rent control has been applied only in tight areas
which have seen a 30% increase in rental prices over Jan-19 May-19 Sep-19 Jan-20 May-20 Sep-20 Jan-21
AREAS OF the last 5 years. This includes all 4 of Catalonia's main Madrid Barcelona
cities: Barcelona, Tarragona, Girona and Lleida
APPLICATION
▪ These areas are declared tight for a period of 5 years,
or until rent prices in the region decrease
-3%
RENT CONTROL START
▪ The constitutional Court is now looking into its legality, ▪ Since the implementation of the Rent
-3.4%
LEGALITY OF as many of the articles in the text are unconstitutional. Control, prices have decreased less in
THE LAW ▪ The move has been declared a way to obtain electoral Barcelona (-3%) than in Madrid (-3.4%).
benefit for the Catalan political parties.
Jan-19 May-19 Sep-19 Jan-20 May-20 Sep-20 Jan-21
Madrid Barcelona
Source: Idealista. 33The Leading Residential
Group
Video ENG / ESP
IBEX MID CAP®You can also read