Company Presentation - Option 1 - Peach Property Group

Page created by Alfredo Lowe
 
CONTINUE READING
Company Presentation - Option 1 - Peach Property Group
Option 1

Company Presentation
November 2019
Company Presentation - Option 1 - Peach Property Group
Disclaimer

These materials contain forward-looking statements
based on the currently held beliefs and
assumptions of the management of Peach
Property Group AG, which are expressed in good
faith and, in their opinion, reasonable. Forward-
looking statements involve known and unknown
risks, uncertainties and other factors, which may
cause the actual results, financial condition,
performance, or achievements of Peach Property
Group AG, or industry results, to differ materially
from the results, financial condition, performance or
achievements expressed or implied by such
forward-looking statements. Given these risks,
uncertainties and other factors, recipients of this
document are cautioned no to place undue reliance
on these forward-looking statements. Peach
Property Group AG disclaims any obligation to
update these forward-looking statements to reflect
future events or developments.

                                                        2
Company Presentation - Option 1 - Peach Property Group
1. Introduction to Peach Property
2. Company highlights
3. Financials
4. Appendix

                                    3
Company Presentation - Option 1 - Peach Property Group
German residential player in B-cities with market
value >EUR 1bn and unique tenant management

  About Peach Property Group                                                                             Key financial data
                                                                                                         CHF mm                                 30.06.2019         30.06.2019        31.12.2018
  •   Peach is a Swiss-listed company investing in real estate with
                                                                                                                                               PF GRANDE
      a focus on residential property in Germany (98% of
      residential units by market value)

                                                                                                        Number of residential units                    12,450             8,775            8,442
  •   Focus on strong B locations in the catchment area of larger
      urban regions with low/moderate vacancies and good
      rental upside.                                                                                    Total area in sqm (‘000)                         830.0            600.0            577.0

  •   Acquisition of GRANDE assets brings Peach’s portfolio from                                        Rental income (annualized)                       53.21             38.61            29.6
      ~CHF 0.8bn to a total ~12,450 units and ~CHF 1.1bn (~EUR
      1bn)                                                                                              Target rental income
                                                                                                                                                          63.5              46.4            43.9
                                                                                                        (annualized)2
  Stable shareholder structure (as of 30.09.2019)
                                                                                                        Adj. EBITDA3                                      28.3              18.8            16.3
                                                                 Thomas
                                                               Wolfensberger
         Strong capital commitment by                             13%
                                                                       LBBW Asset
                                                                                                        Vacancies (incl.
                                                                                                        redevelopment objects)
                                                                                                                                                        10.2%            10.7%                   -
          Peach management                                             Management
                                                                           8% 5
         High free float (>69%)                                            Val Global Inc
                                                                                                        Market value                                  1,117.6             793.3            747.2

                                                Other                           10%
                                                69%                                                     Gross rental return4                             5.2%              5.4%            5.6%

 Company to further diversify shareholder base after disposal
  of Swiss development (restricts share of foreign investors)                                           Number of employees (FTE)                           78                66             51

Source: Company information. FX EUR/CHF of 1.1104 per June 2019
(1) GRANDE portfolio metrics translated with average EUR/CHF FX for H1 2019 of 1.1292. Rental income for the six months ended 30.06.2019 annualized. Excluding heating
(2) Assumes no vacancy and no collection losses
(3) EBITDA adjusted for valuation result of investment properties and disposal of investment properties. Pro-forma adjusted EBITDA defined as pro-forma EBITDA as adjusted for pro-forma
valuation result of investment properties. Adjusted EBITDA for the six months ended 30.06.2019 annualized
(4) Excluding redevelopment objects                                                                                                                                                          4
(5) Kreissparkasse Biberach subscribed to 164k new shares through a subordinated mandatory convertible bond and will acquire another 11k shares directly from the holdings of the Group.
Following the conversion and the transfer of additional shares, its stake will increase to 10.96% (based on the current number of shares)
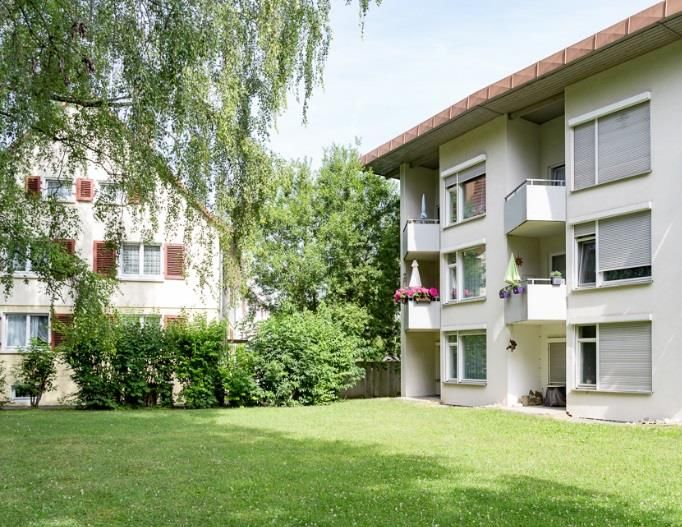
Company Presentation - Option 1 - Peach Property Group
Peach Properties

           German residential properties in carefully selected locations

                                                                           5
Company Presentation - Option 1 - Peach Property Group
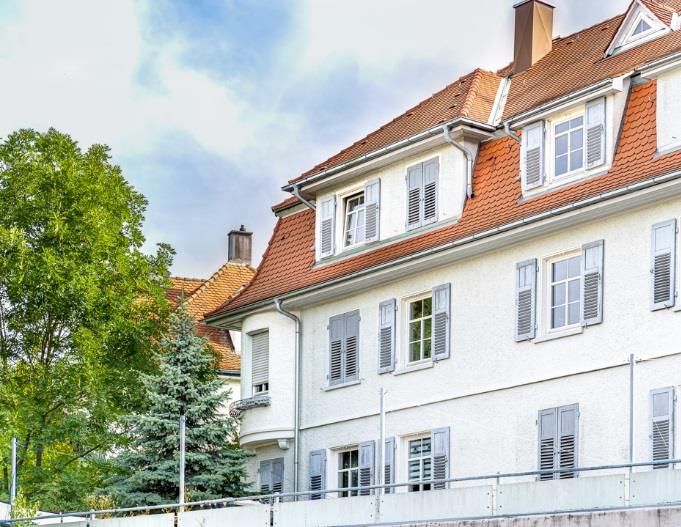
Strong track record and history as a German
residential player

                                                                          Evolution of Peach

Developer focus                                                 Gradual shift towards investment portfolios in German residential real estate              GRANDE acquisition

• 1999: Foundation through Wolfensberger family              • 2011: Acquisition of first investment portfolio in Munster                                  • First large-scale
                                                                                                                                                             acquisition that will
• 2005: First development project, Schooren Kilchberg        • Strategy shift towards cherry-picked residential real estate assets in Western Germany        increase total portfolio
• 2009/2010: Foundation of Peach Germany &                    Strong micro locations in German B-cities, sourced off-market                                 value to CHF 1.1bn
  acquisition of 5 development projects
                                                              Attractive cash-on-cash yield, through potential of rent increase and vacancy reduction

     2004                                 2010                         2012                         2014                       2016                       2018           2019

              Oct ‘10                                   Jul ‘11                            Dec ‘15 – Dec ‘18                                              Oct ‘19
                              IPO                        First German Bond                               Non-secured growth financing                       Planned bond
              • IPO at SIX Swiss Exchange          • Issuance of EUR 50mm                   • Up to EUR 60mm syndicated loan facility                     • Financing of
              • CHF 50mm primary and CHF           • Listed in Frankfurt                    • CHF 59mm 2017 convertible bond (total of CHF                  GRANDE
                10mm secondary proceeds                                                       27.8mm converted thereof per 18 October 2019)               • Further expansion
                                                                                            • CHF 59mm hybrid warrant bond
                                                                                                                                                           830.0

                                                                                                                            577.0        599.6

                                                                          CAGR:                           390.4
  Total area in 000 sqm
                                                                         +45% p.a.1                                                                         ~12,450
                                                                                        248.9                                                          residential units
                                                        117.6           163.8                                                                      PF 2019E (incl. GRANDE)
                                       88.0
       31.4              65.1

       2011             2012          2013              2014             2015            2016             2017              2018        H1 2019          PF Grande

  Continued growth of portfolio supported by strong development platform and active capital management
Source: Company information
(1) Since 2012
                                                                                                                                                                           6
Company Presentation - Option 1 - Peach Property Group
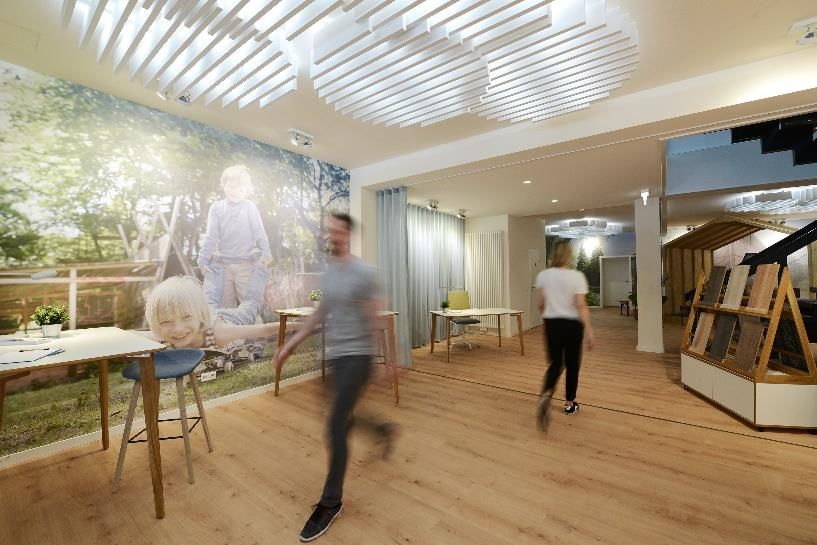
GRANDE acquisition bolsters Peach’s strong
portfolio to > CHF 1bn
                               Peach per 30.6.2019                                            PF GRANDE per 30.06.2019                                Acq. parameters

Apartments                     8,775 apartments                                                12,450 apartments (+42%)                               Peach made an
                                                                                                                                                       unsolicited offer for
                                                                                                                                                       subportfolios of
Lettable area                  599,600 sqm                                                     830,000 sqm (+39%)                                      sellers which are a
                                                                                                                                                       strategic fit for Peach
Market value                   CHF 793mm                                                       c. CHF 1.1bn (+41%)
                                                                                                                                                      Off-market
                                                                                                                                                       transaction with
Target rent p.a.               CHF 46.4mm                                                      CHF 63.5mm (+37%)                                       price agreed in Feb.
                                                                                                                                                       2019
Rental income1                 CHF 38.6mm                                                      CHF 53.2mm (+38%)                                      Subsequent
                                                                                                                         Increase in
                                                                                                                                                       investments by seller
Gross rental                                                                                                          actual rents to c.
                               5.4%                                                            5.2%                           Peach appraiser not
                                                                                                                      CHF 60mm p.a.
yield2                                                                                                                  in mid-term
                                                                                                                               aware of agreed
                               H1 2019 (as reported) : 10.7%                                   Estimate (as reported): 10.2%   purchase price;
Vacancy                        H1 2019 (normalized)2 : 7.2%                                    Estimate (normalized)2: 7.7%    appraisal used as a
                               Mid-term goal: c. 5-6%                                          Mid-term goal: c. 5-6%          cross-check on
                                                                                                                               transaction value
Illustrative                                                                                                                   accretion by Peach
                               CHF 220mm4                                                      CHF 318mm5
EPRA NAV3

                            Substantial improvement of revenue and cash flow generation with GRANDE
Source: Company information
(1) Rental income for the six months ended 30.06.2019 annualized. GRANDE portfolio metrics translated with average EUR/CHF FX for H1 2019 of 1.1292. Excluding heating
(2) Excludes renovation projects Neukirchen L and Fassberg
(3) Excludes fair value gain from Peninsula development part of approximately CHF 15mm (market value approx. CHF 48mm vs. book value of CHF 33mm)
(4) IFRS NAV attributable to equity holders of Peach Property Group AG (CHF 308mm) net of hybrid loans (CHF 113mm) and deferred tax assets (CHF 21mm), plus deferred tax liabilities
(CHF 32mm) and fair value of financial instruments (CHF 14mm)                                                                                                                          7
(5) Based on IFRS NAV attributable to equity holders of Peach Property Group AG PF GRANDE as per 30.06.2019 (CHF 365.3mm) net of hybrid loans and deferred tax assets PF GRANDE,
plus deferred tax liabilities PF GRANDE (CHF 45mm) and fair value of financial instruments, including CHF 27.1mm conversion of hybrid bonds as of October 18, 2019
Company Presentation - Option 1 - Peach Property Group
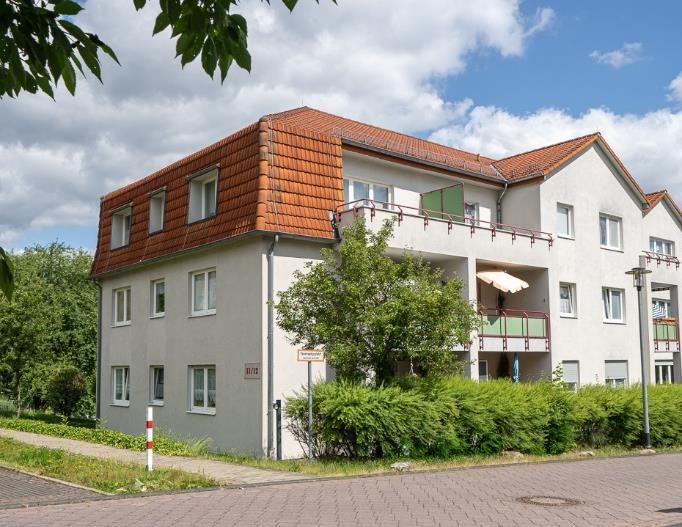
Pro-forma portfolio is well-located and with
relevant scale
               Essen                                                                          Munster
               189 res. units                                                                 376 res. units since 2011     Split by location (PF GRANDE)1
               Bochum II                                                                      Fassberg                                Thuringia
               172 res. units since 2017                                                      287 res. units since 2016                                   Switzerland
                                                                                                                                            3%
                                                                                                                                  Lower Saxony                    2%
               Bochum                                                                         Ostwestfalen
               462 res. units                                                                 1,247 res. units since 2018             5%
                                                                                                                                  Hesse 6%
               Gelsenkirchen & Gladbeck                                                       Bielefeld
               1,260 res. units
                                                                                                                                Baden-
                                                                                              356 res. units
                                                                                                                              Württemberg
               Oberhausen/Marl
                                                                                                                                 10%
                                                                                              North Hessen
               1,916 res. units since                                                         1,128 res. units since
               2017/2018/2019                                                                 2014/2017                              Rhineland-
               Dortmund Office &                                                              Eschwege
                                                                                                                                     Palatinate North Rhine Westphalia
               Monument since 2012                                                            116 res. units since 2016                 16%                 58%
               Neukirchen                                                                     Velbert
               567 res. units since 2015                                                      761 res. units
                                                                                                                            Split by usage (PF GRANDE)1
               Erkrath Wohnen                                                                 Heidenheim
               142 res. units since 2012                                                      1,087 res. units since 2018
                                                                                                                               Commercial/Offices   Parking / Other, 3%
               Rheinland                                                                      Wädenswil Peninsula                   4%
               377 res. units since 2016                                                      58 res. units

               Kaiserslautern                                                                 Mews & Gardens
               1,368 res. units since 2016-19                                                 29 res. units since 2013

               Kaiserslautern                                                                 Bakery
               644 res. units                                                                 4,401 sqm com. use since
                                                                                              2009                                                         Living
     Portfolio GRANDE                   Portfolio   Developments     Acquisitions 2018/2019                Peach Point                                      93%

• GRANDE complementary to existing locations
  • Focus on Ruhr region with the cities of Gelsenkirchen, Essen, Velbert and Bochum
  • Supplements Kaiserslautern (to c. 2,000 apartments) and Bielefeld/Ostwestfalen (to c. 1,600 apartments)
• Leverage existing service organisation
  • Integration in Peach Points Kaiserslautern and Minden
  • New structuring of service organisation with 2 new Peach Points in Erkath and Gelsenkirchen
Source: Company information; Note: Data as of June 2019, PF GRANDE
(1) Based on PF target rent
                                                                                                                                                                        8
Company Presentation - Option 1 - Peach Property Group
1. Introduction to Peach Property
2. Company highlights
3. Financials
4. Appendix

                                    9
Company Presentation - Option 1 - Peach Property Group
Peach highlights

     Focus on highly resilient German residential property market,
 1
     with our focus markets exhibiting solid growth and low rent volatility

     Attractive and diversified portfolio with market value of CHF 1.1
 2
     billion following the GRANDE acquisition

 3
     Stringent investment criteria and acquisition process focusing
     on off-market situations

     Focus on tenant satisfaction through interwoven digital and
 4
     physical service delivery as driver to unlock rental potential

 5   Track record of growth and performance improvements

     Strong operational platform managed by an experienced team
 6
     with a long track record

                                                                              10
1   Strong housing sector fundamentals

                    Real estate specific

                          Largest housing market in Europe…                                                   …with a strong rental culture

                          Forecast of total population per country in 2020 (mm) 1            Percentage of rented apartments as % of total stock2
                          Forecast of total households per country in 2020 (mm)                                       2007A      2012A     2017A
                                                                                                       49%
         83.8                                                                                47% 47%

                             67.9             65.3                                                           40% 36% 36%
                                                                                                                                 33% 35%
                                                               46.8                                                                                   28%
                   42.2                                                                                                    27%              27% 26%
                                                                                                                                                                  21% 23%
                                    28.4             30.2                                                                                                   19%
                                                                      19.0      21.0
                                                                                       7.7

                          Strong shortage in housing market…                                           …while rent affordability remains healthy

       Limited amount of suitable development land available in                               Share of rent in disposable household income as % (2017)2
        German metropolitan regions
       Cumbersome multi-stage approval process slows down
        development activity                                                                                                                  32.1%
                                                                                                              29.6%
       Natural timing delay between building permit and completions

                    Unmatched demand                                                                                                                          24.7%
                                                                                                                              22.6%
             through 2020: 88,000 units3
                                                                                               20.6%
                           Supply of new build
                           units through 2020:
                                297,000 units3

    (1) BMI
    (2) Eurostat                                                                                                                                                       11
    (3) CBRE
German affordable housing is an extremely
1
    stable market…
                    Real estate specific

                 Low, stable vacancy rate through the cycle…                                               … with exceptionally high average tenancy length3

                    German residential vacancy rate¹           German office vacancy rate²
                                                                                                                              Peach average tenancy
    12.0%
                                                                                                                                 length ~9.0 yrs5
                                                                                                            8.0 yrs
    10.0%

      8.0%
                                                                                                                                    5.0 yrs
      6.0%
                                                                                                                                                      3.5 yrs
      4.0%
                                                                                                                                                                          1.7 yrs
      2.0%

      0.0%
              2002      2004    2006     2008      2010     2012      2014     2016     2018       Germany residential       Germany office     France residential     UK residential

                     Rent evolution has virtually no volatility…                                       … and lags the average rent growth in the Eurozone

    (rebased to 100)2                                                                              (rebased to 100)4
                                Rent for German residential
    125.0                       Rent for German office                                             130.0
                                                                                                                                    Germany                Eurozone
                                Real GDP growth

    115.0                                                                                          120.0

    105.0                                                                                          110.0

      95.0                                                                                         100.0
                                                       No decline in rental prices in c. 20
                                                       years across the economic cycle
      85.0                                                                                          90.0
             2002      2004     2006     2008     2010      2012     2014      2016     2018            2002          2004   2006       2008   2010    2012     2014    2016        2018

    (1)   CBRE; median for Berlin, Munich, Frankfurt and Hamburg
    (2)   GreenStreet, CBRE (median of Berlin, Munich, Frankfurt, Hamburg and Dusseldorf), EIU
    (3)   CBRE (median of Berlin, Munich, Frankfurt and Hamburg), Haus&Grund, Clameur, Your Move                                                                                     12
    (4)   CBRE (median of Berlin, Munich, Frankfurt, Hamburg and Dusseldorf), Eurostat HICP
    (5)   As of 31.12.2018
… especially in B-cities that offer an attractive
1
    risk/return profile
                 B-cities

                  Multiplier in B-cities significantly lower…                                    … offering an attractive initial return profile
    Average multiplier multi-family buildings1                                       Net initial yield 2017/2018 in German Secondary Locations 1
                                    A cities             B cities
                                                                                     8.0%
     30                                                                                                       7.0%
                                                                                     7.0%
     25                                                                                                        Peach
                                                                                     6.0%
                                                                                     5.0%                                                              3.
     20
                                                                                     4.0%
     15                                                                                                                                            3.1%
                                                                                                              4.0%
                                                                                     3.0%
                                                                                                                                                   3.0%
     10                                                                              2.0%
          2008         2010               2012   2014           2016         2018                            B-cities                             A-cities

          Rent increase in B/C-cities historically below inflation…                      … resulting in high affordability in German B-cities3
    Rental price and inflation index in Germany2                                     Percentage of housing units that costs
Almost 60% of portfolio in NRW – Germany’s
1
    economic engine
                                NRW deep dive

                                NRW as key economic regions in Germany…                                                                                                                                                          …and home to a high number of large German corporates

       Key metropolitan area in Germany, and one of the
        largest in Europe (17.9m inhabitants)
                                                                                                                                                                                                                                                                                                   Bielefeld
       Germany’s economic hub, generating approx. 21% of
        German GDP1                                                                                                                                                                                                                                                                          Gutersloh

                                                                                                                                                                                                                                                                                         Essen
       More than one third of the largest companies in Germany                                                                                                                                                                                                      Mulheim/Ruhr
                                                                                                                                                                                                                                                                                      Dusseldorf
        are based in NRW, and highest number of new business                                                                                                                                                                                                                              Leverkusen
        registrations
                                                                                                                                                                                                                                                                                         Cologne
                                                                                                                                                                                                                                                                                  Bonn
       Robust labour market with decreasing rate of
        unemployment down from >10% (2006) to 6.8% (2018)2

    Highest number of new German business establishments…                                                                                                                                                                              … coupled with decreasing unemployment in NRW2

       Business registrations in 2018 (‘000)2                                                                                                                                                                                    13%       12.0%
    160                                                                                                                                                                                                                          12%            11.4%
    140
    120                                                                                                                                                                                                                          11%
    100                                                                                                                                                                                                                                                 9.5%
     80                                                                                                                                                                                                                          10%
                                                                                                                                                                                                                                       10.2%                      8.9% 8.7%
     60                                                                                                                                                                                                                                                    8.5%
     40                                                                                                                                                                                                                          9%                                           8.1% 8.1% 8.3% 8.2% 8.0%
     20                                                                                                                                                                                                                                                                                                   7.7%
                                                                                                                                                                                                                                 8%                                                                              7.4%
      0                                                                                                                                                                                                                                                                                                                 6.8%
                                                                         Hamburg
                                         Berlin

                                                                                                                                                                     Sachsen
                                                                Bremen

                                                                                                                                                                               Sachsen-Anhalt
            Baden-Württemberg

                                                                                            Mecklenburg-

                                                                                                           Niedersachsen

                                                                                                                                        Rheinland-Pfalz
                                                                                                                           Nordrhein-
                                                  Brandenburg

                                                                                                                                                          Saarland

                                                                                                                                                                                                                     Thüringen
                                Bayern

                                                                                   Hessen

                                                                                                                                                                                                Schleswig-Holstein
                                                                                            Vorpommern

                                                                                                                           Westfalen

                                                                                                                                                                                                                                 7%
                                                                                                                                                                                                                                 6%
                                                                                                                                                                                                                                       2004    2006        2008       2010        2012       2014         2016          2018

    (1) Unicredit
    (2) Destatis
                                                                                                                                                                                                                                                                                                                          14
Sizeable high-quality platform with market value
2
    in excess of ~EUR 1bn

                    Isolated effect of GRANDE acquisition1                                                              Portfolio appraisal metrics (H1 2019)

        Market value in
        CHF mm                                  324.3                      1,117.6                         Gross yield at target rent                             6.37%

                    793.3
                                                                                                                   Discount rate2                                 4.01%

                                                                                                                                                          EUR 6.02 per sqm
                                                                                                               Monthly market rent
                                                                                                                                                         (vs. EUR 5.08 current)

                  1H 2019                  Grande latest               PF June 2019
                                             appraisal
                                                                                                                   Portfolio valuation breakdown per cluster (by
                                                                                                                                   market value)3
                     Defined strategy to optimise portfolio                                                                             Top 1
                                                                                                                                         5% Top 2 Top 3
                                                                                                                                              5%
                                                                                                                                                   4%
                                20-40         Reduction in vacancy per month                                                                          Top 4
                                apts          following extensive maintenance                                                                           2%
                                                                                                                                                         Top 5                  Well-diversified
                                                                                                                                                          2%
                                              Current vacancy level based on units                                                                                              portfolio across
        Reduce                   9.3%         (Sep-2019), down from 10.7% as per H1                                                                               Top 6-10   numerous properties,
                                                                                                               Rest
       vacancies                              2019 (incl. redevelopment projects)                              47%                                                  10%
                                                                                                                                                                                which are sub-
                                                                                                                                                                                 clustered into
                                              Enquiries for every unit advertised                                                                                            individual unit leases
                                 >18          online during August 2019
                                                                                                                                                             Top 11-20
                                                                                                                                                               15%
                                            Rent upside potential given well-
          Further
                                             invested portfolio and low rent levels
        value uplift                                                                                                                       Top 21-30
          levers                            Economies of scale on basis of fully-                                                           10%
                                             built out platform

     A well-invested portfolio spread across numerous cities and assets; significant potential for vacancy reduction and rent increases
    Source: Company information
    (1) Purchase price GRANDE converted to CHF at FX rate of EUR/CHF 1.1104 (June 2019). Revaluation gain (pre tax) based on latest valuation report of EUR 292.1mm                   15
    (2) Average of discount rates, weighted by market value
    (3) Chart refers to Peach portfolio clusters. Each of these contains up to 100 individual houses, which in turn consist of individual rental leases
Portfolio exhibits attractive rent increase
2
    potential...

                                       Potential for increasing rents in existing portfolio (excl. GRANDE)1
      EUR/sqm         Average in-place rent           New tenancies rent 2019             Market rent²                     New tenancies vs. average in-place rent

             +13%                   +9%                  +10%                  +13%                  +9%                    +20%             Attractive rent
                                    7.43                                                                                                      potential in all core
                                                                                                                           7.02               portfolios
                             6.81         6.83
              6.47 6.43                                  6.51 6.40                                                             6.37
                                                                                                                                             Focus on realizing
                                                  5.93                                                              5.87
       5.75                                                                                                                                   upside potential over
                                                                                5.47 5.48
                                                                                                    5.16 5.17                                 the next years
                                                                        4.83                4.73                                              through further
                                                                                                                                              enhanced tenant
                                                                                                                                              satisfaction, selective   Average rent/sqm
                                                                                                                                              renovations, etc.)        for new lettings in
                                                                                                                                                                          H1 2019 was
       Kaiserslautern          Rheinland            Oberhausen           Ostwestfalen          Nordhessen             Heidenheim       % of H1 2019 market value of
                                                                                                                                      investment properties (without          17%
              16%                   6%                   22%                    10%                   8%                    15%
                                                                                                                                              rights of use)
                                                                                                                                                                           above existing
                                                      Publicly supported apartments within GRANDE                                                                        average rent/sqm
                                                                                                                  50%                                                   across the German
                                                  Vacancy       Apartment New letting                                                      50% plus percentile           rental portfolio,
     City                 # Units Expiry                                              Upside                   percentile Upside
                                                  (in m²)       rent / m² 2019                                                              applicable based on         including GRANDE
                                                                                                                On-Geo3
                                                                                                                                            Peach tenant focus
     Bielefeld                 356         2020           2%             4.04              4.01       (1%)             4.82        19%      as well as planned
     Essen                     161                        1%             5.20              5.47         5%             5.78        11%      investments
     Gelsenkirchen               77                       9%             4.47              4.50         1%             5.00        12%     20% rent increase
     Velbert                   388         2022           9%             4.05              4.11         2%             5.73        42%
                                                                                                                                            over following 3 years
                                                                                                                                            possible and
     Total                     982                        5%             4.27              4.32         1%             5.36        26%      achievable
    Source: Company information
    (1) As at H1 2019
    (2) According to appraiser Wüest Partner as at 30.06.2019
    (3) On-Geo stands for live georeferenced market data. Peach typically uses ~100m around an apartment building                                                            16
... allowing for significant rent upside from the
2
    market placement of Peach’s strategical vacancies

                                                     Breakdown of vacant apartments (as of H1 2019, excl. GRANDE)

                                                                                                                                                                                     % vacancy based
                    10.7%                                 Factual vacancy (c. 2.9%)1                                                                                                   on total units

                      940

                                                     63                                                                                                                    6.3%
                                                                                   64                                                                                                              Peach is
                                                                                                                 129                                                         556               reducing vacancy
                                                                                                                                               128                                             by approx. 20-40
                                                                                                                                                                                                apts per month

                                         1                                1                          1                            2                              3
                Total vacancy                Contract signed                   Reserved                  Letting process              Under renovation                Letting reserve

        1                       Letting process                                   2                Under renovation                                3                  Letting reserve
            • More than 18 enquiries for every unit                                   • Investment of CHF 8.7mm brought 376                            • Apartments going into renovation
              advertised online during August 2019                                      new units to market in H1 2019
                                                                                                                                                       • o/w 335 vacant units from renovation
            • Strong demand already indicated for units                               • Over 120 units were under                                        projects Neukirchen and Fassberg
              entering the letting process                                              renovation in 1H 2019
                                                                                                                                                       • Scalable system with existing partners

        Minimal incremental yield on cost requirement of 6% for renovations, which lies above our in-
                                            place portfolio yield
    Source: Company information
    (1) As of June 30, 2019, we had 256 vacant apartments, representing a vacancy rate of 2.9% based on currently marketable apartments (excluding apartments currently under renovation and
    as letting reserve to be renovated)                                                                                                                                                           17
Structured acquisition process that result in
3
    strategically sound acquisitions...

                                                                         Almost exclusive focus on off-market transactions
                                                           Sourcing
                                                                          based on strong network in Germany

                                                                         Swift execution
                                                          Impeccable
                                                           reputation    Valued partner respecting confidentiality around deal
                                                                          terms
                      Evaluation of around
                        4.1 million sqm
                             (2018)

                                                           Rigorous      Minimum cash-on-cash yield hurdle of ~6%
                                                            financial    Buy vacancies and tangible rent increase opportunities “for
                                                           screening      free”

                                                          Careful due    Cautious assessment, no shortcuts
                 Only c. 5% of carefully screened
                   assets eventually acquired              diligence     No interest to deploy capital at any price

                     Selective acquisitions of properties (100,000 – 200,000 sqm/year (= 3-5%)) going forward
    Source: Company information

                                                                                                                                  18
… within a defined acquisition strategy that
3
       leverages on local expertise

    Population density Germany (2017)1
                                                                               Portfolios with 300 – 1,000 apartments, frequently below
                                                                                “radar screen” of large REITs or institutional buyers,
                                                                                offering limited competitive tension

                                                                               Focus on NRW and adjacent federal states

                                                                               B-cities with attractive yields and potential for vacancy
                                                                                reduction through targeted asset management

                                                                               Urban areas in a highly stable economic region based on
                                                                                population growth as well as strong rental market

                                                                               Favourable micro locations with good transportation
                                                                                links

                                                                               Rent per sqm below market level; purchase price below
                                                                                replacement cost and market value

                                                                               Selective expansion of local “Peach Points” to provide
                                                                                local tenant interaction

                                                                               Leverage of existing management platform and services
                                                                                offering enables economies of scale and management
                                                                                efficiency
       Inhabitants per sqkm (2017)
           Below 100          100–200   200–500   500–1,000   Above 1,000

                Peach focus areas
                                                                                                                                            19
       Source: Company information
       (1) Destatis
Peach Points: Client service excellence delivered
4
                       through regional service hubs

                                                                                                                              Regional service hubs
Digital capabilities

                       Proven and time-tested service model that forms the basis for Peach’s strong perception by tenants,
                                         ultimately resulting in vacancy reduction and rent optimisation
                                                                                                                             20
360 degree tenant service model: strong digital
4
                             capabilities embedded in multi-region service hubs
                                                                                                                          Tenants with full multi-channel access:
                                                                                                                          •   Online (24/7): App, Web Portal, Mail
                                                                                                                          •
                                   Tenants

                                                                                                                              Offline: Telephone, Peach Points

                                                                                                                          Property Management in Peach Points

                                                                                                                          •   All notifications recorded in ticketing system
FULLY DIGITALIZED SCALABLE

                                                                                                                          •   120 tickets per month per 1,000 apartments (as of
                                                                                                                              June 30, 2019)
                                   Channels

                                                     App   Web portal               Email     Telephone    Peach Point
                                                                                                                          •   88% “one touch”: Question can be solved at first
                                                                                                                              contact station
         PLATFORM

                                                                                                                          Central Quality Management
                                                     Oberhausen            Erkath1          Witzenhausen Kaiserslautern
                                                                                                                          •   20.9 hours to first response
                                   Peach Point

                                                                                                                          •   6.8 days to full solution of the problem
                                                           Minden                   Heidenheim        Gelsenkirchen1      •   88% satisfaction (based on 11% response rate,
                                                                                                                              survey April to June 2019)

                                                                                                                          Scalable model through partners
                                   System Partners

                                                                                                                          •   Partners integrated via Zendesk
                                                                                                                          •   Model scales seamlessly without the need to add
                                                                                                                              significant expenses

                                                                                                                          Peach closely measures and tracks its success

                                                                                                                                                                               21
                             Source: Company information
                             (1) Construction of Erkath and Gelsenkirchen started
Strong track record of delivery and performance
5
       improvements…

    Financial values in CHF mm

                                                                                                                                                 Portfolio KPIs     Change
                                             Portfolio KPIs                   Portfolio KPIs                    Portfolio KPIs
        Portfolio KPIs                                                                                                                              H1 2019         since FY
                                               FY 2017                          FY 2018                           H1 2019                                             2017
                                                                                                                                                (incl. GRANDE)

         Market Value                          520.3                             747.2                            793.3                             1,117.6     + 115%
         (in CHF mm)                     (13% development)                  (7% development)                 (6% development)                  (4% development)

                                                                                                                                                                               Includes 335 units from
      Lettable Area (‘000                                                                                                                                                        renovation projects
                                                   390.4                             577.0                             599.6                            830.0      + 113%          Neukirchen and
            sqm.)
                                                                                                                                                                                      Fassberg

     Vacancy (units, incl.
    investment properties                          15.0%                             12.4%                            10.7%                             10.2%      - 32%
        in renovation)
                                                                                                                                                                               Reduced to 9.3% as of
                                                                                                                                                                                 September 2019
       Target net rental
                                                    28.6                              43.9                              46.4                             63.5      + 122%
         income p.a.

    Net market value LTV1                          49.6%                             54.4%                            54.0%                            60.4%2
                                                                                                                                                                               Mid-term target of 55%

      Avg. Interest Rate                           2.48%                             2.54%                            2.35%

                                       Peach outperformed all relevant key metrics and has a clear de-levering strategy in place

       Source: Company information
       (1) Based on net debt (excluding financial liabilities due to related parties, lease liabilities and derivative financial instruments), excluding hybrids
       (2) Defined as PF net debt divided by PF market value, net of issuance costs                                                                                                      22
5   …with clear path to further deleveraging

                   PF GRANDE                                                                                               PF GRANDE
                                                                                                                      Ordinary course of business

                                                       Q4 2019                               H1 2020
                                                                                                                          H1 2020 profit and
                                                                                                                             revaluation
              Asset acquisition of CHF                                           Sale of development assets (SUI)
                                              FY19 profit and revaluation                                               Significant top line growth
                      253mm                                                     ~CHF 70mm (including existing debt)
                                                                                                                       through vacancy reduction
                                                                                                                            and rent increase

                                                       Net debt                              Net debt                           Net debt
                          Debt

               CHF 278mm new bond
                                                       Assets                                 Assets                             Assets

                                          Expected CHF 20-40mm mostly due       Building permit expected Q4 2019;
                                          to realised rent increases (and       LOI signed October 2019; ~CHF
                                          through revaluation gains)            70mm (including existing debt)

                  Deleveraging expected through a combination of strong rental income growth, operating margin improvement, revaluation
                       gains, Swiss development asset sale as well as acquisitions financed through a balanced mix of debt and equity

    Source: Company information

                                                                                                                                           23
6   Internalized strong platform...

              Access to off-market deals given extensive network
                Institutional investors, incentivized sellers, private
                 owners                                                                     Capital markets
                                                                                         Institutional investors debt /
                                                                                          equity, private investors

                                                                                                                                    Asset                              Economic
              Sourcing                            Modernization                                  Letting
                                                                                                                                  management                          performance
     Rigorous acquisition process           Comprehensive renovations to            Combination of online & offline      Highly efficient and lean setup    Increased value of real property
      with c. 5% of carefully DD’d            introduce high-quality portfolios        letting channels to maximize           Customer queries handled          and cash return
      assets purchased                        to market                                customer reach                          through Peach Points and         Reduction in vacancy
     Strict set of acquisition criteria     Minimal requirement for follow-         Online booking of visits                digital support
                                              on capex once stabilized,                                                     Low maintenance costs given        Strong rent upside
     Strong underlying growth                driving cash flow generation            Online creditworthiness check         building quality
      driven by organic drivers, as                                                                                                                             Above-average tenancy length
      well as accretive acquisitions                                                  Online contract generation           Reduction of vacancies /
                                                                                                                             optimization of rents

                                            Granular insights                                              Highly                             Minimal ongoing                    Very high
                                             into tenant priority                                            oversubscribed                      repairs due to                      acceptance of
                                             guide modernization                                             new apartments                      strong sense of                     rent hikes
                                                                                                                                                 tenant “ownership”                 Low attrition

                                                                                                 Tenant
                                                                                              relationships

                                                                                   Highly-satisfied tenants with ownership
                                                                                    feeling for rented flats
                                                                                   Fostering of strong communities

                                                                                                                                                                                                    24
... managed by an experienced team of operators
6
    with strong track record
            Dr. Thomas Wolfensberger                                                  Dr. Marcel Kucher
       Chief Executive Officer                                            Chief Financial Officer / Chief Operating Officer
       • Responsible for corporate strategy, capital markets, portfolio   • Responsible for finance, operations, legal, investor relations
          management and projects located in Switzerland                     and IT
       • > 15 years of experience with capital markets and real           • > 15 years of experience as CFO of growth companies
          estate transactions                                             • PhD in Economics
       • Doctorate in economics (PhD)

               Dr. Andreas Steinbauer                                                  Marc Sesterhenn
       Head of Letting and Sales                                          Head of Asset Management
       • Responsible for the sale and letting activities                  • Leads German rental property entities and is responsible for
       • >15 years of experience in real estate development                 asset management
       • Previously worked at Orco Property Group, responsible for        • >11 years of experience in controlling and project
         the entire portfolio                                               development at LEG / Goldman Sachs
       • Holds a PhD in International Real Estate Markets                 • Certified Real Estate Asset Manager (IREBS)

                 Christoph Kattenfeld                                                     Nicole Grau
       Head of Acquisitions                                               Head of Group Accounting
       • Responsible for acquisitions at Peach Property Group             • Responsible for responsible for the Group’s accounting,
       • > 15 years of experience in corporate finance / real estate        consolidation, taxes and internal controlling
         as head of acquisitions at Round Hill Capital / Vitus Group      • > 18 years of experience in finance, incl. 12 years as auditor
       • MBA from Wharton School of Business and a BSc. in                  at PwC with specialization on international accounting
         business administration                                          • Diploma in management and certified accountant

                     Frank Gieshold                                                 Susanne Hünermann
       Head of Technical Installations                                    Legal Counsel
       • Responsible for technical installations for all German assets    • Responsible for legal matters concerning the Group’s
       • >25 years of experience in technical real estate                    subsidiaries in Germany
         management                                                       • >12 years of experience in real estate law
       • Diploma in construction engineering and certified industrial     • Degree in law from the University of Cologne; specialized
         engineer                                                            lawyer for letting (“Mietrecht”) and “WEG-Recht” in Germany

                                                                                                                                   25
1. Introduction to Peach Property
2. Company highlights
3. Financials
4. Appendix

                                    26
Historical financial evolution

                            Total revenue (CHF mm)1                                                                EBITDA (CHF mm)3
                                                               % growth vs. last period                                                                     % margin
                     24%            52%                            3%                        41%          44%          60%          57%          65%          64%
                                    91.3                                          92.7                                 71.3                                   67.7

                     60.2                                                                                 51.5
      48.6                                                         44.5                                                             37.2
                                                    43.1                                                                                         33.6
                                                                                             28.8

      2016           2017           2018         H1 2018        H1 2019           LTM       2016          2017         2018       H1 2018      H1 2019        LTM

              Gross profit – rental business (CHF mm)2                                                     Capital expenditures (per sqm)

                                                                              % margin    Maintenance expenses run through P&L as repairs and maintenance while cash
                                                                                          flow capex shown here helps Peach reduce vacancy rates and raise rent levels
      60%            66%            70%            70%            71%             70%

                                                                                  24.7                                                       28.8            Decrease of capex
                                    20.7                                                                               23.1                                requirement to run-rate
                                                                                                                                                           once refurbishments of
                                                                                                   17.2                                                      letting reserves are
                                                                  13.6
                     10.7                                                                                                                                   executed (after 2020)
                                                    9.6
      5.3

     2016           2017            2018         H1 2018        H1 2019           LTM            2017                  2018                H1 2019
Source: Company information, excluding GRANDE portfolio
(1) Excluding revenue from development properties
(2) Rental income minus direct rental expenses                                                                                                                       27
(3) Unadjusted for revaluation gains/losses
Note: LTM calculated as H1 2019 figure plus FY 2018 figure minus H1 2018 figure
Robust financial development driven by
operational and financial restructuring

                         Stable rental income profile…                                                                          … as well as NAV growth…

Rental income (CHF mm)                                         % LfL rental growth                   IFRS NAV (CHF mm)
                                                                                                      400
60
                                                                     2.5%                             350
                                      43.9
                                                                                                      300
40
                                                                                     31.7
                         28.6                                                                         250
                                                                                                                                                                                        377.5
                                                                     23.2
                                                                                                      200                                    301.3         316.6          310.9
20                                                   16.8
                                                                                                                              258.5
                                       29.6
                                                                                                      150
                         16.3                                        19.3            19.3
                                                     13.8                                                       148.9
           8.9
 0                                                                                                    100
         2016          2017          2018         H1 2018           H1 2019    H1 2019 PF                       2016           2017          2018         H1 2018       H1 2019     H1 2019 PF
                                                                                GRANDE                                                                                                Grande
       GRANDE        Upside to target rent      Current rent

                      … and portfolio valuation uplift…                                                                    … driving overall FFO I generation1
Market value (CHF mm)                                                                                Normalized FFO I (CHF mm)

 1,300                                                                                                  8
                                                                                                        7
                                                                                                        6
     900                                                                       1,117.6                  5
                                                                                                        4
     500                                                    793.3                                       3
                                      747.3                                                                                                                     5.7
                 520.3                                                                                  2                                  4.4
                                                                                                        1            2.7
     100                                                                                                                                                                              1.6
                 2017                 2018               H1 2019              H1 2019 PF                0
                                                                               GRANDE                               2017                  2018               H1 2018               H1 2019

  Combination of enhanced profitability, optimized financing structure as well as inorganic growth through acquisitions leading to improved FFO profile

Source: Company information
(1) In 2018 and H1 2019, Peach paid off-period taxes relating to the one-off sale of Gretag AG in 2016 which are added back to provide normalized FFO. Further, one-off tax prepayments
relating to the sale of Wollerau Park in H1 2018 are also added back. Normalized FFO in 2017 deducts received cash from tax authorities. In addition, as per FY18, Peach has CHF 165mm of
tax loss carry-forwards (CHF 3.4m in the next 3 years, >CHF 40mm in the next 7 years) and deferred tax assets of CHF 21mm
                                                                                                                                                                                             28
Illustrative Funds from Operations

                                         Illustrative Funds from Operations                                                                              Capex investments

                                                                                                                                           Regular maintenance work is
(CHF mm)            • Target rental operating margin to increase from c. 70% to 80%                                                         expensed through P&L
                    • Supported by mid-term CHF 60mm actual rental income target
                       2.5% Lfl rental income growth in H1 2019                                                                           Cash flow capex for renovations will
                       17% rental growth for new lettings in H1 2019                                                                       reduce vacancy rates and increase
                       20-40 newly renovated apartments per month                                                                          rent levels
                       Vacancy level target of 5-6% in mid-term
                                                                                                                                           Capex to reduce significantly post
                                                                                                                                            renovations of letting reserve
                                                   17                                                                                          Letting reserve of 556 apartments
                                                                                                                                                   as per June 2019
                                Limited due to depreciation of assets                                                                          Mid-point renovation speed of 30
                                for German tax purposes and                                                                                        apartments back to market/month
                                exisiting cash tax loss carry forwards
                28.3                                                                                    Mid-term target of 3-4%                Implies letting reserve back to
                                                                                                        FFO yield on book NAV                      market within next 18 months
                                                                                                                                               High market demand (up to 18x
                                                                                                                                                   oversubscribed)
                                                                                                                                               Reduction in vacancy expense
                                                                                                                                               Followed by decrease of capex
                                                                                                                                                   requirement to run-rate
                                                                                                                                           Minimum target of 6% cash-on-
                                                                                                                                            cash yield for any investment
                                   1
     PF Adjusted EBITDA                     PF cash tax                   PF cash interest                       PF FFO

Source: Company information
(1) EBITDA adjusted for valuation result of investment properties and disposal of investment properties. Pro-forma adjusted EBITDA defined as pro-forma EBITDA as adjusted for pro-forma
valuation result of investment properties, including contribution from development activities. Adjusted EBITDA for the six months ended 30.06.2019 annualized
                                                                                                                                                                                           29
Financial policy

                                 • Mid-term target 55% net market value LTV

                                 • Mid-term guidance FFO I yield of 3-4% on IFRS NAV

FINANCIAL POLICY
CONSIDERATIONS                   • Target average debt maturity profile > 4 years

                                 • Maintain ample liquidity with minimum CHF 20mm cash on
                                   balance sheet

                                 • We will consider issuing equity to fund our growth strategy

   Source: Company information

                                                                                             30
1. Introduction to Peach Property
2. Company highlights
3. Financials
4. Appendix

                                    31
Historical Income Statement

 In TCHF                                                  2016       2017       2018     H1 20181    H1 20191      LTM1                  Comments
 Rental income                                      1     8,899     16,264     29,644      13,797      19,285     35,132
 Valuation gains from investment properties              33,733     42,620     59,425      27,341      24,866     56,950    1   Rental income up 82.3% in 2018 on
 Profit on disposal of investment properties              4,529          0          0           0          72         72        the back of new acquisition and
 Income from development properties                 2    21,918     55,617     28,378      21,908       7,302     13,772        new letting success; L-f-L rental
 Profit on disposal of subsidiaries                         563          0          0           0           0          0        income growth of 2.9%
 Other operating income                                     920      1,357      2,260       1,993         264        531
 Operating income                                        70,562    115,858    119,707      65,039      51,789    106,457    2   Development income decreased in
 Expenses from leasing of investment properties          (3,578)    (5,589)    (8,987)     (4,205)     (5,689) (10,471.0)       FY2018 in line with the company’s
 Valuation losses from investment properties             (3,773)    (1,740)    (4,379)       (318)       (771) (4,832.0)        strategy to gradually withdraw from
 Losses on disposal of investment properties                   0      (200)          0           0           0        0.0       its development business
 Total development expenses                             (23,697)   (44,026)   (21,305)    (17,060)     (4,087) (8,332.0)
 Personnel expenses                                      (4,400)    (6,020)    (8,403)     (3,852)     (5,125) (9,676.0)    3   Significant increase in operating
 Marketing and sales expenses                              (822)      (525)      (247)       (165)       (268)    (350.0)       margin from 44.3% in FY2018 to
 Other operating expenses                                (5,494)    (6,262)    (5,040)     (2,204)     (2,296) (5,132.0)        59.4% in FY2019 due to 1) higher
 Depreciation & amortization                               (177)      (160)      (197)       (125)       (244)    (316.0)       reliance on standing assets, 2)
 Operating expenses                                 3   (41,941)   (64,522)   (48,558)    (27,929)    (18,480) (39,109.0)       economies of scale and 3) larger
                                                                                                                                in-sourcing of platform
 Operating result (EBIT)                                 28,621     51,336     71,149      37,110      33,309     67,348

 Financial income                                   4      2,438     11,919        511         208         213        516   4   Financial income in FY2017 came
 Financial expenses                                     (13,073)   (10,553)   (14,786)     (6,665)     (8,717)   (16,838)       from currency gains for the vast
 Result from associates and joint venutures                (938)    (1,154)          0           0           0          0       majority (CHF 10.7mm)
 Result before tax                                       17,048     51,548     56,874      30,653      25,351     51,572

 Income tax expenses                                     (5,462)    (9,624)   (11,555)     (4,157)     (3,084)   (10,482)

 Result after tax                                        11,586     41,924     45,319      26,469      22,267     41,117
 – attributable equity holders of Peach Property
                                                         11,224     41,895     45,451      26,389      21,963     41,025
 Group AG
 – Attributable to non-controlling interests                362         29      (132)         107         304         65

 Undiluted earnings per share in CHF                       1.87       7.32       7.48
 Diluted earnings per share in CHF                         1.87       6.70       5.56

Source: Company information
(1) Unaudited
(2) LTM defined as H1 2019 plus FY 2018 minus H1 2018                                                                                                        32
Historical Balance Sheet

 In TCHF                                                  2016       2017       2018     H1 20181     H1 20191                   Comments
 Cash and cash equivalents                               12,952     49,157     53,484       91,573       32,893
 Total receivables                                       13,214      7,586      5,772        5,729        4,783
 Prepaid expenses                                           325        418        765          699        4471     1   Contractual assets of CHF43.5mm
 Contract assets                                    1       492     43,489          0        1671         1352         in FY2017 in the course of the sale
 Development properties                                  71,124     50,528     37,263       39,874       32,513        of development project Wollerau
 Non-current assets held for sale                         1,447          0          0            0            0
 Current assets                                          99,554    151,178     97,284      139,546       76,012
                                                                                                                       Park
 Investment properties                              2   224,578    452,368    693,740      531,237      756,950
 Non-current financial receivables                        2,019      1,388         50          493        1134     2   Acquisition of portfolios in Bielefeld
 Investments in associates and joint ventures                43          1          1            1            1        Heidenheim, Bochum, Duisburg,
 Deferred tax assets                                     16,135     16,233     19,552       18133        20698         Oerlinghausen
 Other assets                                               285        638      9,938          199        1778
 Non-current assets                                     243,060    470,628    723,281      550,063      780,561
                                                                                                                       Increase in financial liabilities
 Total assets                                           342,614    621,806    820,565      689,609      856,573    3
                                                                                                                       mainly through new secured
 Liabilities                                                                                                           mortgage loans
 Trade payables                                           2,966      6,031      1,800        3,265        2,010
 Other liabilities                                       10,668      2,703      5,029        4,879        4,415
 Accrued expenses                                         9,523     11,592     10,983        8,789        8,411
 Current income tax liabilities                           2,545      5,236      1,984        4,507          839
 Current financial liabilities                           41,366     69,735     38,507       58,770       48,532
 Current provisions                                       2,338      3,937      4,704        4,382        4,541
 Total current liabilities                               69,406     99,234     63,007       84,592       68,748
 Non-current financial liabilities                  3   108,679    239,001    424,402      261,485      443,461
 Non-current provisions                                   1,727      2,021      1,462        1,981        1,633
 Deferred tax liabilities                                13,860     23,044     30,442       24,996       31,782
 Total non-current liabilities                          124,266    264,066    456,306      288,462      476,876
 Total liabilities                                      193,672    363,300    519,313      373,054      545,624
 Equity
 Share capital (excl. treasury stock)                      4,991      5,429      5,473        5,457        5,281
 Share premium                                           82,800     89,715     90,973       90,499       93,806
 Hybrid capital                                          49,251    106,822    112,841      138,873      113,059
 Retained earnings                                       15,183     55,655     96,049       81,200      104,374
 FX translation                                          (4,466)    (1,021)    (5,783)      (1,463)      (8,066)
 Common equity                                          147,759    256,600    299,553      314,566      308,454
 Equity attributable to non-controlling interests          1,183      1,906      1,699        1,989        2,495
 Total equity                                           148,942    258,506    301,252      316,555      310,949
 Total liabilities and equity                           342,614    621,806    820,565      689,609      856,573
Source: Company information
(1) Unaudited
                                                                                                                                                           33
Historical Cash Flow Statement

                                                                                                                  H1 20181 H1 20191
                                                                                                                                                    Comments
 In TCHF                                                                           2016       2017       2018
 Result before tax                                                                 17,048     51,548     56,874     30,653      25,351
 Depreciation & amortization                                                          177        160        197        125         244
                                                                                                                                          1   Improved working capital
 Valuation result of investment properties/valuation losses on development       (29,960)   (40,880)   (53,712)   (27,023)    (24,095)        management through
 Result on disposal of investment properties/subsidiaries                         (5,092)        200          0          0         (72)       gradual reduction and
 Adjustment of bad debt allowance/employee benefit obligations                        284      (283)        502        577         636        disposal of development
 Financial income                                                                 (2,438)   (11,919)      (511)      (208)       (213)        activities
 Financial expense (incl. impairment of financial assets)                          13,073     10,553     14,786      6,665       8,171
 Result from associates and joint ventures                                            938      1,154          0          0            0
                                                                                                                                          2   Cash taxes include one-off
 Share-based payment compensation                                                       0        568      1,626        570       1,014
 Change in provisions                                                             (1,405)        887        415      (399)         752
                                                                                                                                              expenses with regards to
 Other non-cash effective items                                                     (352)        260      (883)     43,199     (2,043)        disposal of Gretag portfolio
 (Increase)/decrease in receivables and other assets                                9,353   (36,812)     44,200     10,632       4,797        and development project
 (Increase)/decrease in development properties                               1     11,917     20,032     13,187    (3,295)     (3,967)        Wollerau Park
 Increase/(decrease) in payables and other liabilities                           (10,622)    (3,802)    (2,116)
 Interest and other financial expenses paid                                       (6,112)    (6,928)    (8,836)    (4,441)     (6,152)    3   Sale of Gretag portfolio in
 Taxes paid                                                                  2   (13,248)      1,606    (9,940)    (4,479)     (4,347)        FY16
 Cash flow from operating activities                                             (14,948)   (12,322)     54,455    52,576           76

 Payments for subsidiaries/Investments in investment properties              3 (76,423) (159,606) (217,975) (56,846) (17,696)
 Disposal of subsidiaries/disposal of investment properties                      110,895     1,774         0             0       1,858
 Acquisition of other property, plant and equipment                                  (68)    (157)     (497)          (57)       (274)
 Financial receivables granted                                                     (140)     (258)         0          (33)           0
 Repayment of financial receivables/interest income received                            3       16     1,429           848          10
 Cash flow from investment activities                                             34,267 (158,231) (217,043)      (56,088)    (16,102)

 Net proceeds/(cash out) from the issue/(repayment) of financial debt            (36,451)   143,392    162,928      12,607     (3,451)
 Net proceeds/(cash out) from the issue/(repayment) of hybrid capital              17,326    57,571       6,275     33,379         167
 Net proceeds/(cash out) from the issue/(repayment) of share capital                  562      6,883          1          0        (67)
 Lease payments                                                                         0          0          0          0       (414)
 Distributions to hybrid equity investors (less VAT outstanding)                  (1,021)    (1,625)    (1,989)          0       (652)
 Cash flow from financing activities                                             (19,584)   206,221    167,215      45,986     (4,417)

 Change in cash and cash equivalents                                               (265)     35,668      4,627      42,474    (20,443)
 Cash and cash equivalents at the start of the period (at January 1)              13,281     12,952     49,157      49,157      53,484
 Currency exchange impact on cash and cash equivalents                               (64)       537      (300)         (58)      (148)
 Cash and cash equivalents at the end of the period                               12,952     49,157     53,484      91,573      32,893
Source: Company information                                                                                                                                           34
(1) Unaudited
You can also read