L1 Long Short Fund Limited - APRIL 2021
←
→
Page content transcription
If your browser does not render page correctly, please read the page content below

L1 Long Short Fund Limited APRIL 2021
Overview
The L1 Long Short Fund (LSF) has performed very strongly over the last year
(LSF NTA +112.5%, S&P/ASX200 Accumulation Index +37.5%).
LSF’s differentiated positioning underpinned the strong performance generated over
the last 12 months.
We believe equity markets will remain supported in the near term, with a rotation into
cyclical stocks likely as global GDP growth accelerates through 2021.
– Market will remain supported by extreme fiscal and monetary stimulus, vaccine roll-
out, increasing M&A activity and accelerating earnings.
– Factor rotation to value and cyclical stocks has been modest so far and we believe
has further to go.
– We remain positive on the ability for vaccines to control the pandemic.
– We expect inflation to rise in 2021, which will present opportunities and risks for
investors.
We are positioned to benefit from four key market dynamics/themes:
Vaccine Recovery, Global Reflation, New Energy and Restructures/Demergers.
We remain optimistic about LSF and have built a portfolio of many mispriced stocks,
that have strong valuation support and clear upcoming catalysts.
Source: Mainstream Fund Services and Bloomberg as at 31 March 2021. Net performance for the Company is defined as the movement in NTA pre-tax.
Performance is shown after all applicable fees and charges. Past performance should not be taken as an indicator of future performance. L1 Long Short Fund Limited 2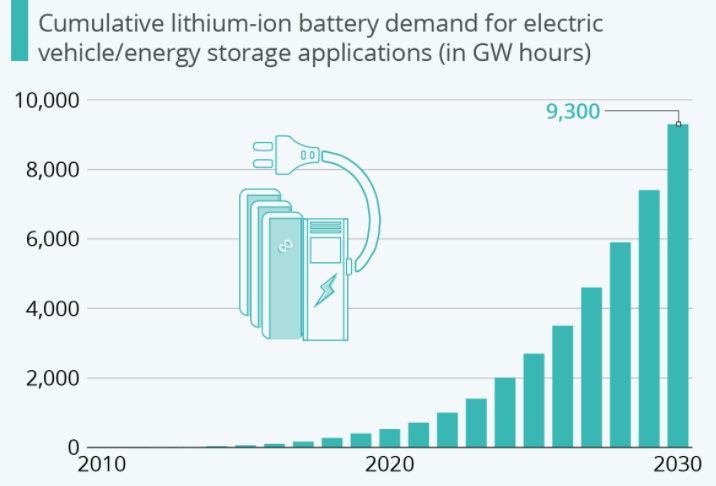
Performance Summary and Stock Contributors
Performance Update
LSF has had an exceptional 12 months.
Pre-tax NTA up 112.5%, LSF share price up 153.2%.
Pre-tax NTA Net Performance L1 Long Short S&P ASX Net
to 31 March 2021 (%) Fund 200 AI Difference
3 months 8.7 4.3 +4.4
6 months 46.0 18.5 +27.5
1 year 112.5 37.5 +75.0
2 years (p.a.) 26.8 8.5 +18.4
LSF Since Inception (p.a.) 9.2 8.9 +0.3
Strategy Since Inception* (p.a.) 22.1 7.3 +14.8
Performance was driven by strong stock picking & portfolio management.
– buying the market aggressively at its lows;
– predicting vaccine success; and
– positioning for a market rotation to value & cyclical stocks.
Source: Mainstream Fund Services and Bloomberg as at 31 March 2021 Net performance for the Company is defined as the movement in NTA pre-tax. LSF Inception 23 Apr 2018.
* Strategy since inception refers to that of the L1 Long Short Fund – Monthly Class which began on 1 Sep 2014. Numbers may not sum exactly due to
L1 Long Short Fund Limited 4
rounding. Performance is shown after all applicable fees and charges. Past performance should not be taken as an indicator of future performance.Top 10 Long Contributors – March 2021 Quarter
Company Name Comment
Continued positive operating momentum & imminent large scale buybacks.
Bed Bath & Beyond*
Exited our holding near share price peak (driven by short squeeze) in January.
Canadian Natural Focused management team and low all-in cost structure supporting rapid de-gearing at
Resources prevailing oil prices.
Recovering oil price leading to improved investor sentiment and consensus earnings
Cenovus Energy
upgrades.
Sale of towers business for €10bn and renewed optimism about earnings outlook.
CK Hutchison
Scope for meaningful buybacks. P/E 7x, FCF yield ~17%, 5% div yield.
Strong position in the nascent U.S. sports betting market, growth potential in the core
Entain
online business and takeover interest.
Improved outlook due to vaccine rollout, positive legislative outcome and more rational
Lyft*
competition. Exited position in March (>100% return since buying in Oct 2020).
Very strong operating trends in all divisions, especially REA, WSJ, Realtor.com and
News Corp
Book Publishing.
Strong core business growth in lotteries and wagering, corporate interest and strategic
Tabcorp
review of the wagering business.
Expected benefits from infra portfolio restructure / monetisation, decreasing
Telstra
competitive intensity in mobile segment, declining NBN headwinds and reducing costs.
Improving operational performance, falling bad debts and progress towards removal of
Wells Fargo
“asset cap”.
Source L1 Capital as at 31 Mar 2021. Stock contributors listed in alphabetical order.
* Indicates this stock was not held for the entire period. L1 Long Short Fund Limited 5LSF Advantages
LSF Advantages
LSF has a number of key advantages over many other funds. It is able to:
Adjust portfolio net long to reflect the risk-reward of the market.
Market Scaled up market exposure to capitalise on the crash in March
Exposure and again ahead of positive vaccine news.
Dialled down market exposure once catalysts had passed
and risk-reward became more balanced.
Generate alpha from both rising or falling share prices.
Shorting Shorting contributed 15% to returns since Jan 2020.
Achieved this despite one of the most difficult markets for shorting.
Exploit research insights offshore, not just domestically.
International Broader set of opportunities to best leverage our research insights.
Often the best quality company or opportunity is offshore.
International longs were >25% of gross returns over the past year.
LSF’s portfolio flexibility boosted performance over the last 12 months.
Source: Mainstream Fund Services and L1 Capital. Contribution based on gross returns to LSF portfolio. L1 Long Short Fund Limited 7LSF Advantages – Market Exposure
Ability to adjust portfolio net long to reflect the risk-reward of the market.
Market
Exposure
140% Shorting
Aug – Nov 2020:
130%
Increased net long based
International
on vaccine confidence
120% Mar – Apr 2020: Net Long: ~120-130% Dec 2020 – Jan 2021:
Rapidly increased net long Maintained exposure due
110% to take advantage of to expectation of very
stock market crash. strong earnings season
100% Net long ~100% Net Long: ~125-130% Feb – Mar 2021:
Net Long
Jul 2020:
90% Detailed L1 research Reduced exposure
suggests high likelihood following rally &
of vaccine success reporting season
80%
Net Long: ~105% catalysts playing out
Net Long: ~105%
70%
60% Jan 2020:
Net long in line with
long-term average
50%
Net Long: ~65%
40%
Source: Mainstream Fund Services and L1 Capital. Net long exposure of LSF portfolio. L1 Long Short Fund Limited 8LSF Advantages – Shorting
Delivered strong positive performance from shorting despite an extremely
difficult backdrop. Market
Exposure
Arguably the most difficult market for
shorting in the past decade: 35 Shorting
– market rallying strongly Closed numerous shorts during
– share prices dominated by themes and the crisis, into vaccine news & International
30 after reporting season
momentum, rather than valuations (post negative catalyst)
– retail traders causing extreme price
moves & numerous short squeezes 25
Many top hedge fund managers have Beginning to
experienced large losses. re-build
20 number of
LSF stock shorts still contributed positively stock shorts
adding ~15% to performance since Jan
2020 and ~2% over the last quarter. 15
Performance underpinned by careful stock
picking & exiting a number of short
positions near the market lows. 10
Expect to selectively add stock shorts as
market conditions normalise. No. of Short Positions (Company Specific)
Source: Mainstream Fund Services and L1 Capital. L1 Long Short Fund Limited 9LSF Advantages – International
Ability to exploit research insights offshore, not just domestically. Market
Exposure
Capitalise on key sector insights by buying the best opportunity globally
(not limited to a narrower set of domestic opportunities). Shorting
International longs contributed >25% of gross returns over the past 12 months.
International
Stock Sector view Valuation Catalyst Return
Banks set to recover Major operational
WFC trading at a WFC up 45%
Wells Fargo from falling bad debts turnaround since buying in
(WFC) ~30-50% discount to
and steepening yield Removal of “asset cap” Nov/Dec 2020
ASX “big four” banks
curve Buybacks
U.S. joint venture
Exponential growth
(BetMGM) U.S. states legalising ENT up ~100%
Entain over the next decade in since buying in
(ENT) dramatically online sports betting
U.S. online sports Aug 2020
undervalued within Large EPS upgrades
betting and gaming
the group
QB2 mine starting
Strong copper price Teck trading at a
Teck production in 2022 TECK up 40%
Resources outlook – demand ~45% discount to versus average
(top 5 copper mine
(TECK) growth from EVs, 5G, ASX peers, despite buy price
globally)
energy storage, etc higher quality assets
Cost out program
Source: L1 Capital as at 31 Mar 2021. L1 Long Short Fund Limited 10Market Outlook
Market Outlook
We expect the following trends to dominate financial markets in 2021:
Strong & accelerating global GDP growth should trigger a rotation from:
Market Cash and bonds Equities
Rotation Growth stocks Value stocks
Defensives Cyclicals
The “vaccine trade" has further to go.
Vaccine
Success Hard hit "COVID-19 losers" will recover further as their operating
metrics improve over the coming year.
We believe we are on the cusp of the first major M&A cycle since 2007.
M&A
Upturn Driven by improved corporate confidence, cheap debt, private equity.
Upward pressure on inflation due to rising input prices, extreme
Inflation monetary and fiscal stimulus and massive pent up consumer demand.
Bond yields and broker consensus implies low risk of inflation.
M & A = Mergers & Acquisitions L1 Long Short Fund Limited 12Market Rotation
Value stocks are set to recover after an epic period of underperformance. Market
Rotation
Since 2007, value stocks have endured the 1. Growth vs Value – Relative performance
largest and longest period of 200
Growth Outperforming
Vaccine
Success
underperformance on record. 180
World Value vs Growth
160
COVID-19 caused a spike in high P/E stocks, 140
M&A
Upturn
as investors sought safety in “COVID-winners”. 120
The recovery in value and cyclical stocks has 100 Rotation to value/cyclicals Inflation
been modest and has further to go (Chart 1). 60
80
still in very early stages
The only other time that growth stocks have
traded at such an extreme P/E premium was
the dot com bubble (Chart 2). 2. P/E premium of Growth vs Value (S&P 500)
LSF performance in 2019, 2020 and 2021 Current = 26.5x (98.7percentile)
Median = 9.7x
(YTD) has been very pleasing considering the
huge headwind for value and contrarian
investors, such as L1 Capital.
A market rotation to value and cyclical stocks
would be a tailwind for LSF performance.
Source: Datastream, Goldman Sachs Global Investment Research, J.P. Morgan U.S. Equity Strategy & Global Quantitative Research L1 Long Short Fund Limited 13Vaccine Success
We remain positive on the ability for vaccines to control the pandemic.
Market
Rotation
We believe vaccines will be able to combat COVID-19 for 3 key reasons:
Most vaccines have already proven effective against identified mutant strains, Vaccine
Success
Vaccines will provide some protection against non-mutated parts of the viral spike
protein; and M&A
Upturn
Both the FDA and EMA will consider expedited approvals of minor vaccine
modifications to better target mutations, which can be rolled out in weeks. Inflation
COVID-19 vaccinations vs. death rates
7 Israel 60 12 U.S. 25
6 50 10 20
5
40 8
4 15
30 6
3 10
20 4
2
10 2 5
1
- - - 0
No. of COVID deaths daily (per mn people) (LHS) % of population fully vaccinated (RHS)
The data from Israel is extremely positive. Since the vaccine rollout began,
COVID-19 cases are down 98%, critically ill down 93%, deaths down 87%1.
Source: Our World in Data.
1 Source: Segal Lab (Weizmann Institute) L1 Long Short Fund Limited 14M&A Upturn
We expect a significant upturn in M&A and restructuring activity: Market
Rotation
Business confidence is surging – strong EPS & GDP growth, undergeared balance sheets.
Debt & equity is cheap and easy to access. Vaccine
Success
Massive pool of capital that must be deployed from Private Equity and U.S. SPACs.
Pent-up deal demand with many transactions delayed due to COVID-19. M&A
Upturn
COVID-19 pressuring some sectors, leading to industry consolidation.
Inflation
1Q 2021 M&A activity in Australia is on track to reach a decade-high
LSF is positioned to benefit from rising M&A, given our skew to
undervalued companies with strategic appeal.
Source: Bloomberg and Goldman Sachs Global Investment Research. L1 Long Short Fund Limited 15Inflation
Our research suggests rising inflationary pressures in 2021, largely due to Market
surging input prices: Rotation
Leading indicators suggest strong inflationary pressures are building: Vaccine
Success
– ISM Prices Paid Index – highest reading in >10 years.
– Producer Prices Index (PPI) registered its largest gain in ~10 years (4.4% YoY in March). M&A
Upturn
– Rising input costs cited in dozens of our company meetings across many sectors.
– Since June 2020, freight costs up 100-500%, copper price up ~50%, lumber up ~200%, Inflation
soft commodities up 30-50% (e.g. corn, wheat, soybeans, cotton and palm oil).
Most of these factors appear transitory, but U.S. input costs and selling prices
we are monitoring wage rates, energy
markets & capacity utilisation to determine
how persistent any rise in inflation will be.
We are positioned to mitigate some of the
risks from an increase in inflation, as we are:
– long energy, gold, financials
– short some ultra-high P/E growth stocks
(that should de-rate if inflation/bond
yields increase)
Source: IHS Markit and JP Morgan L1 Long Short Fund Limited 16Portfolio Positioning & Themes
Current Portfolio Positioning
Gross Long (%) Gross Short (%) Net Exposure (%)
Australia/New Zealand 114 66 48
North America 29 8 21
Europe 29 0 29
Asia 8 0 8
Total 180 74 106
Equities: Positive. Extreme central bank & Government stimulus, negative real rates for cash and
bonds, increasing M&A activity, accelerating earnings trends.
Australia: Attractive. Extreme RBA and Federal Government support, low COVID-19 case numbers,
rising house prices, strong consumer balance sheets, improving business confidence.
North America: Attractive. Dovish Fed, Fiscal stimulus (US$1.9 trillion), potential infrastructure
stimulus (~US$2 trillion), accelerating vaccine roll-out, strong economic recovery.
Europe/HK: Attractive. Compelling valuations, preference for global businesses (less positive on
European/HK economies), surging manufacturing and export data, low investor expectations.
Net exposure: Net long remains above long term average as outlook for equities remains positive.
Source L1 Capital as at 31 Mar 2021. L1 Long Short Fund Limited 18Portfolio Themes
We see four themes that offer a compelling, asymmetric risk-reward at present:
Vaccine success has only partially been reflected in some share prices.
Vaccine Expect accelerating operating trends to lead to EPS upgrades and P/E re-rating.
Recovery Have taken profits in numerous travel, retail, property and infrastructure stocks
that have reached our valuation.
Pressure on inflation due to strong GDP growth, stimulus, rising input prices.
Global Banks, insurers & miners likely to outperform in a higher yield environment.
Reflation Shorts with long duration (“ultra high P/E” growth stocks) likely to be impacted.
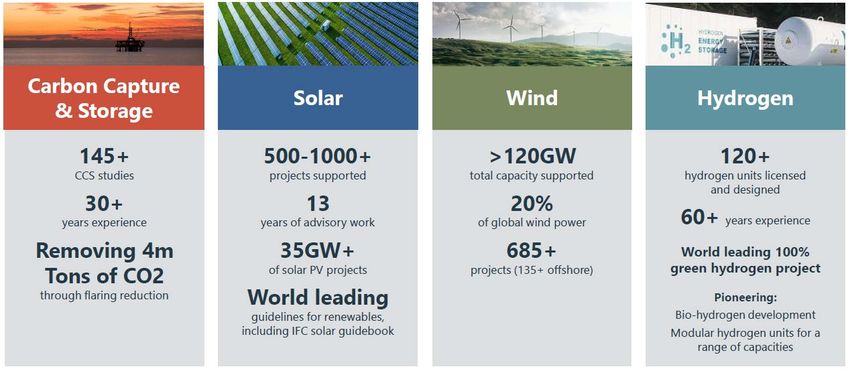
Shares exposed to industry tailwinds from sustainability, including renewable
New energy, decarbonisation and electrification investment.
Energy Concurrent under-investment in oil may lead to a tight energy market and
positive price dynamics.
High quality businesses/assets within a conglomerate structure.
Corporate Large undervaluation that provides a degree of capital protection.
Restructures Clear intent to deliver value to shareholders via asset sales, de-mergers or
capital management.
L1 Long Short Fund Limited 19Theme 1 – Vaccine Recovery
Ferrovial (FER – Spain) Safran (SAF – France)
Vaccine
Recovery
Valuable long dated toll road concessions in World’s highest quality aerospace company.
Canada (407 ETR – 78 years left) and U.S. (Texas Global leader in manufacturing and parts for
and Carolinas – 55 years). narrow-body jet engines. Global
Assets are highly flexible to vary tariffs during Generated over €1b of free cash flow in 2020, Reflation
the day, historically providing tariff growth well despite COVID-19 causing the worst aviation
above CPI, which we expect to continue. conditions in history. New
New road extensions opening in 2022/2023 to Dominant industry position, with enormous Energy
further grow EBITDA and are underappreciated installed base of young engines requiring
by the market. maintenance for decades to come.
Restructures
Actively looking to simplify structure via sale of Earnings set to recover strongly as global air & Demergers
non-core services division. travel demand resumes post pandemic
Strong alignment through high levels of insider €2b cost out program will see margins exceed
ownership. pre-pandemic levels.
407 ETR (Canada): Significant dividend growth1 Long-term growth in global passenger traffic (RPKs)2
1,200
1,000 Significant growth in
installed base requiring
800 maintenance
600
400
200
-
2009 2010 2011 2012 2013 2014 2015 2016 2017 2018 2019
Dividends (US$m)
1 Source: Ferrovial
2 Source: Redburn Research L1 Long Short Fund Limited 20Theme 2 – Global Reflation
Wells Fargo (WFC – USA) QBE Insurance (QBE)
Vaccine
Recovery
Top 4 U.S. bank with strong consumer franchise. Global commercial lines insurer with strong
Business stagnated in recent years due to operations in Australia and Europe (and a sub-
compliance breaches and regulatory penalties. scale U.S. business). Global
Business set to benefit from the strongest Reflation
Major operational and compliance turnaround
underway, led by well-regarded new CEO premium rate cycle increases in almost 20 years.
(Charles Scharf). Premium rates now growing at 11-12%, versus New
Major positive catalysts include $US8b cost out claims growth of only 4%. Energy
program, unwind of excess bad debt provisions Beneficiary of higher interest rates, given $28b
and potential to start buybacks and raise investment book skewed to fixed income. Restructures
dividends. Balance sheet strengthened after equity raising & Demergers
Potential for Federal Reserve to remove the in 2020 and additional reserving top-ups.
Asset Cap, which would be a huge positive for Shares trading at compelling valuation metrics
earnings growth and investor sentiment. FY22F P/E 12x, Dividend Yield 5.4%.
WFC set to improve productivity closer to peers Favourable premium rate environment2
11.5%
12.0%
9.8%
8.0%
6.3%
4.0% 5.0%
1.7%
0.0% 0.1%
-0.1%
-1.3%
-4.0%
WFC Cost. Income Ratio Peer Average Cost/ Income Ratio
QBE Group Premium Rate Movements
1 Source: S&P Global, company reports, Raymond James Research
2 Source: QBE, JP Morgan, L1 Capital estimates L1 Long Short Fund Limited 21Theme 3 – New Energy
Mineral Resources (MIN) Wood Group (WG – U.K.)
Vaccine
Recovery
Diversified mining services company, run by an Leading consulting/engineering firm operating
entrepreneurial and highly-regarded across the energy and infrastructure sectors.
management team. Positive exposure to the energy transition Global
All key areas of the business (iron ore, lithium (~25% of revenue generated from renewables/ Reflation
and mining services) expected to have new energy).
favourable medium-term tailwinds. Long-term growth driven by huge global New
Strong iron ore prices and production growth renewable energy investment and focus on Energy
expected to underpin robust cash generation. decarbonisation / net zero emissions.
Expected to add two substantial iron ore Well placed to benefit from sector tailwinds Restructures
growth projects over the next few years. with market leadership in carbon capture & & Demergers
Exposure to several exciting lithium projects storage, solar, wind and hydrogen development
(Wodgina, Kemerton and Mt Marion). projects.
FY22 P/E 12.5x, FCF yield >15%.
Surge in demand expected for lithium-ion batteries1 Unlocking growth in new energy2
1 Source: Bloomberg, Statista
2 Source: Wood Group L1 Long Short Fund Limited 22Theme 4 – Corporate Restructures
News Corp (NWS) Tabcorp (TAH)
Vaccine
Materially undervalued conglomerate. Provides gambling and entertainment services. Recovery
Main asset is a 61.4% stake in REA (US$9.6b), Lotteries benefiting from shift to digital sales –
which is ~60% of News Corp’s market cap. more convenient for customer & higher margin. Global
Reflation
Under-appreciated assets include: Well placed for strong 2H earnings growth:
─ Dow Jones/WSJ, valued at ~US$8b if we ─ lotteries – digital growth, more normal
apply a New York Times valuation. jackpot sequence and change in game design New
Energy
─ Move, the #2 real estate portal in the U.S., ─ wagering – retail venues reopening and the
growing revenues by 28% (Dec quarter). launch of new wagering products.
Restructures
─ Harper Collins, value is highlighted by recent Further upside from corporate interest with two & Demergers
offer for Simon & Schuster at 15x EBITDA. indicative bids received for wagering:
Management taking progressive steps to better ─ Board commenced strategic review which is
highlight the underlying value of its assets. . set to conclude by June 2021.
REA Australia: Sustained EBITDA growth1 Continued growth in digital share of lottery turnover2
700
40%
600 35% 32.1%
29.6%
500 30% 26.7%
25.3%
400 25% 21.5%
300 20%
15%
200
10%
100
5%
0
0%
FY13 FY14 FY15 FY16 FY17 FY18 FY19 FY20 FY21F FY22F
1H19 2H19 1H20 2H20 1H21
1 Source: REA and Broker consensus estimates.
2 Source: Tabcorp L1 Long Short Fund Limited 23Corporate Update
Corporate Update
The share price and NTA has increased strongly over the last 12 months.
Pre-tax NTA has increased 112.5%. LSF Share Price and Pre-Tax NTA
Share price has increased 153.2%. 3.00
Active on-market share buy-back: 2.50
– Over the past year, the Company has
bought back 53.5m LSF shares (~$77 million) 2.00
at an average price of $1.45 per share,
representing ~8% of issued capital (31/3/21). 1.50
Senior L1 team has significantly increased their 1.00
investment in LSF. On market buying of a
further $38m of shares in the March quarter. 0.50
Payment of an inaugural fully franked interim
dividend of 1.5 cents per share in March and 0.00
intention to maintain and grow dividends.
LSF Share Price LSF Pre-tax NTA
Positive feedback from shareholders on LSF performance,
buyback activity, commencement of fully franked dividends,
insider buying and shareholder communication.
Source: Mainstream Fund Services and Bloomberg as at 31 March 2021. Net performance for the Company is defined as the movement in NTA pre-tax.
Performance is shown after all applicable fees and charges. Past performance should not be taken as an indicator of future performance. L1 Long Short Fund Limited 25
Please refer to LSF ASX buyback announcement dated 17 Mar 2020 for further details.Conclusion
The portfolio has performed very strongly in 2019, 2020 and 2021 (YTD).
Our detailed, bottom-up research continues to identify numerous companies with
major underappreciated upside that should continue to drive portfolio performance.
We see four broad areas of opportunity at present:
Vaccine Recovery, Global Reflation, New Energy and Corporate Restructures.
We believe the global vaccine rollout, extreme monetary and fiscal stimulus and an
acceleration in economic growth will support the continued rotation into value and
cyclical stocks.
We continue to be optimistic about LSF due to the large number of portfolio stocks
with significant upside to valuation and the extreme stock dispersion across the
market, which provides attractive opportunities for stock picking.
L1 Long Short Fund Limited 26Appendices
L1 Capital Funds
Outstanding Long-term Performance Across All Funds
ZENITH AWARD
Launched Long Short Fund (Strategy) (Melbourne)
Long Short: Best ‘Australian
Sep 2014 22.1% net return p.a. since inception (ASX200AI 7.2% p.a.)1
Equities – Alternative
Returned over 25% p.a. in 5 out of 6 calendar years (net) Strategies’ 2017.
Aug 2007 Australian Equities Fund (Long only) (Melbourne) HSBC SURVEY
Long Short: ‘Best Performing
Top decile performing Large Cap Australian Equities Fund Hedge Fund Globally’ in 2015,
since launch – Zenith Annual Survey, June 20202 ‘Top 20 Globally’ in 2016, 2017
Outperformed the ASX200AI by 3% p.a. (net) since inception
EUREKAHEDGE
Jun 2015 Global Opportunities Fund (Miami)
Long Short: Winner ‘Best
38.9% net return p.a. since inception3 Asian Long/Short Equity Fund’
No negative months since inception in 2017
Aug 2017 U.K. Residential Property Fund (London) ZENITH RATING
U.K. Fund I delivering a 6% p.a. net distribution yield4 Australian Eq Fund: Zenith
‘Highly Recommended’
Strong capital growth (+18%) despite Brexit & pandemic
headwinds4
HSBC SURVEY
Mar 2019 International Fund (Sydney)
GOF: ‘Top 20 Hedge Fund
"Recommended" Fund rating – Zenith, August 2020 Globally’ in 2017, 2018, 20203
Returned 16.7% p.a. since inception (MSCI World 13.2%)
Note: Performance data current as at 31 Mar 2021 except where marked. 1. L1 Capital Long Short Fund – Monthly Class since inception (1 Sep 2014). 2. Zenith Aust Eq
Fund Report - 18 Jun 2020. See L1 websites for further disclaimers. 3. As at 28 Feb 2021. Latest data available. 4 Hedged Class of L1 Capital U.K.
L1 Long Short Fund Limited 28
Residential Property Fund I to 28 Feb 2021. Past performance should not be taken as an indicator of future performance.L1 Capital’s Competitive Edge
Track Top decile performance across both the Long Short strategy
Record and Australian Equities Fund since inception.
Quality Differentiated company, industry and macro research
Research (e.g. vaccine).
Independent Low correlation with other fund managers and typically not
Thinking in crowded positions.
Sound Unemotional investment approach and track record of taking
Judgement advantage of market volatility and dislocations.
Total alignment with investors – investment team has vast
Alignment
majority of personal wealth invested alongside clients.
Source: L1 Capital as at 31 Mar 2021. Performance statement refers to Australian Equities Strategy and Long Short Strategy.
Past performance should not be taken as an indicator of future performance. L1 Long Short Fund Limited 29Long Short Fund – Monthly Performance
Pre-tax NTA Monthly Returns (Net) (%)
Period Jan Feb Mar Apr May Jun Jul Aug Sep Oct Nov Dec Year
2014 - - - - - - - - (2.42) 3.03 2.85 1.61 5.17
2015 0.59 9.14 2.42 1.71 3.73 (0.86) 3.30 2.06 5.51 8.49 8.11 4.62 60.52
2016 5.81 0.59 5.47 2.46 2.78 (0.89) 3.22 3.92 0.46 (0.13) 0.55 2.22 29.61
2017 2.51 1.87 3.15 1.03 4.18 1.70 2.62 1.69 1.93 2.54 0.89 3.56 31.40
2018 0.56 (0.47) (1.64) (1.32)* (4.05) (5.97) 1.02 (5.34) (2.04) (3.92) (2.60) (5.95) (27.74)
2019 4.26 5.11 0.17 3.04 (2.73) 3.84 0.65 0.40 2.61 3.46 0.37 2.04 25.46
2020 (7.75) (6.83) (22.94) 23.16 10.94 (2.12) (1.69) 9.99 0.63 (2.43) 31.94 4.29 29.50
2021 (0.16) 9.02 (0.14) 8.69
25%+ net returns in 5 out of 6 years since inception.
22.1% return p.a. (net) vs ASX200AI 7.3% p.a. = 14.8% p.a. net outperformance (since inception).
* In the table above, we show the full performance history (net of fees) of the L1 Long Short Limited since inception (LSF:ASX IPO on 24 Apr 2018).
Performance prior to this date is that of the L1 Long Short Fund – Monthly Class since inception (1 Sep 2014).
L1 Long Short Fund Limited 30
Figures may not sum exactly due to rounding. Past performance should not be taken as an indicator of future performance.Long Short Fund – Performance in Rising & Falling Markets
Performance in “Down Market” Months Performance in “Up Market” Months
(Average of 29 months) (Average of 50 months)
5.0%
2.9% 3.0%
3.0%
1.0%
0.0%
-1.0%
-3.0%
-3.3%
-5.0%
L1 Long Short ASX200 (AI) Return L1 Long Short ASX200 (AI) Return
Strategy Return Strategy Return
Strong Capital Protection in Falling Markets (Net)
(Since Inception of the Long Short Strategy)
All figures are net returns as at 31 Mar 2021. Based on portfolio exposures of the L1 Capital Long Short Fund – Monthly Class
(inception 1 Sep 14). Past performance should not be taken as an indicator of future performance. L1 Long Short Fund Limited 31Long Short Fund – Sector Contribution
Sector Contribution Since Inception (Net) (%)
Materials 65.0%
Communication Services 57.0%
Industrials 47.9%
Financials 25.1%
Utilities 24.0%
Consumer Discretionary 19.5%
Real Estate 15.8%
Energy 15.3%
Consumer Staples 14.2%
Health Care 5.8%
Information Technology -0.7%
-10% 0% 10% 20% 30% 40% 50% 60% 70%
All figures are based on net returns as at 31 Mar 2021. Based on the full performance history (net of fees) of the L1 Capital Long Short Fund – Monthly Class since inception (1 Sep 2014).
Past performance should not be taken as an indicator of future performance. Data presented above refers to underlying security positions in the portfolio. L1 Long Short Fund Limited 32Contact
Chris Clayton (QLD and WA) Wayne Murray (VIC)
Head of Distribution Investment Specialist
Phone + 61 417 279 183 Phone + 61 424 300 003
Email cclayton@L1.com.au Email wmurray@L1.com.au
Alexander Ordon (NSW and SA) Aman Kashyap (NSW and VIC)
Investment Specialist Investment Specialist
Phone +61 413 615 224 Phone +61 477 341 403
Email aordon@L1.com.au Email akashyap@L1.com.au
L1 Long Short Fund Limited 33Legal Disclaimer
L1 Long Short Fund Limited has been established to invest in a portfolio of predominantly Australian and New Zealand securities, with
up to 30% invested in global securities. The Company has the ability to both buy and short-sell securities, which provides a flexible
strategy to deal with changing stock market conditions. The objective is to deliver strong, positive, risk-adjusted returns to investors
over the long term. The portfolio is managed by L1 Capital Pty Ltd, which has established a reputation for offering clients best of
breed investment products. L1 Capital manages money for a range of clients including large superannuation funds, pension funds,
financial planning groups, asset consultants, family offices, high net worth individuals and retail investors.
Disclaimer
This communication has been prepared for L1 Long Short Fund Limited (ACN 623 418 539) by its investment manager, L1 Capital Pty
Ltd (ABN 21 125 378 145 and AFS Licence 314302). L1 Capital Pty Ltd has prepared this publication in good faith in relation to the facts
known to it at the time of preparation. This publication contains general financial product advice only. In preparing this information,
we did not consider the investment objectives, financial situation or particular needs of any individual investor, and you should not
rely on the opinions, advice, recommendations and other information contained in this publication alone. This publication has been
prepared to provide you with general information only. It is not intended to take the place of professional advice and you should not
take action on specific issues in reliance on this information. We do not express any view about the accuracy or completeness of
information that is not prepared by us and no liability is accepted for any errors it may contain. Past performance is not a reliable
indicator of future performance.
Copyright
Copyright in this publication is owned by L1 Capital. You may use this information in this publication for your own personal use, but
you must not (without L1 Capital’s consent) alter, reproduce or distribute any part of this publication, transmit it to any other person
or incorporate the information into any other document.
L1 Long Short Fund Limited 34ABN 21 125 378 145 | AFSL 314 302 Level 28, 101 Collins Street Melbourne Victoria 3000 Australia Phone +61 3 9286 7000 Fax +61 3 9286 7099 Web L1.com.au
You can also read


