Listed Property Elanor Commercial Property Fund (ASX Code: ECF) - 23 March 2021 Value-add office fund with 9.6% yield
←
→
Page content transcription
If your browser does not render page correctly, please read the page content below
www.coreprop.com.au

Listed Property

Elanor Commercial Property Fund
(ASX Code: ECF)
23 March 2021

Value-add office fund with 9.6% yield

Initiation of coverage
Listed Property Research

 Elanor Commercial Property Fund (ASX: ECF)

 Contents

 1.      Overview                                                    2
 2.      Key Metrics                                                 3
 3.      Investment Summary                                          4
 4.      Fund Strategy                                               5
 5.      The Property Portfolio                                      8
 6.      Financial Forecasts & Valuation                            12
 7.      Board & Management                                         13
 8.      Appendix 1: Properties in the Portfolio                    14
 9.      Appendix 2: Financial Summary                              17
 10.     Ratings Process for A-REITs                                18
 11.     Disclaimer & Disclosure                                    19

 About Core Property Research
 Core Property Research Pty Ltd was established in July 2017 to provide market leading and insightful research on the property
 funds sector for its clients and investors. Our ratings and research cover sector level research, ratings and recommendations on
 listed and unlisted property funds, and is built upon the extensive research experience of its staff.

 The Core Property team collectively, has over 50 years' experience across property, financial services and investment markets.
 The team has also evaluated over 500 different funds across multiple sectors and a range of investment structures over the last
 decade.

 IMPORTANT NOTICE
 This document is published by Core Property Research Pty Ltd ABN 31 620 084 880 (“Core Property”). This publication has been
 prepared and issued by Core Property which is an Authorised Representative ASIC number 001257225 of One Investment
 Administration Ltd (ACN 072 899 060, AFSL No. 225064) (“OIAL”). The information in this document has not been prepared by
 OIAL and only by Core Property. No representation is made by OIAL as to the accuracy or completeness of the contents of this
 document, and no responsibility or liability is accepted by OIAL for any errors, misstatements in or omissions from this document
 which arises from any use of or reliance on this document.

 For further information, please refer to the Disclaimer & Disclosure notice at the end of this document.

Copyright © 2021 Core Property Research Pty Ltd                                                                            1
www.coreprop.com.au
Listed Property Research

            23 March 2021                       Elanor Commercial Property Fund (ECF)
                    BUY                         Value-add office fund with 9.6% yield
 See the end of this document for a
 description of Core Property’s ratings. The
                                                ◆ Value-add office fund focussed on metropolitan and well-established office
 rating must be viewed in the context of          precincts with value-add potential.
 comparable A-REITs and not across all
 products.                                      ◆ Income supported by strong tenancy profile with 87% of income from
                                                  government and blue-chip tenants.
 Forecast Distribution:                 9.6%    ◆ Relatively low risk to income with 15% falling due over FY21-FY23 with
 Forecast 12 Month                                next major lease expiry in March 2024.
                                      30.7%
 Capital Return:                                ◆ Attractive distribution yield of 9.6%, with 80% payout ratio providing a
 Total Expected
                                     40.3%
                                                  strong buffer against earnings.
 Return:
                                                ECF’s strategy targets high-quality office assets within Australia with a preference towards
                                                properties in metropolitan office locations as well as well-established office precincts. This
 Company Data                                   follows the Fund’s objective of providing above average risk-adjusted returns, supported by
 ASX Code:                                ECF
                                                strong tenant covenants, attractive income growth and capital gains.

 Price:                                $1.04    Portfolio metrics consist of 7 properties valued at $378.6M located in WA, QLD, SA and ACT.
 Market                                         Capitalisation rate of 6.72%. Portfolio occupancy of 94.3% and a WALE of 4.0 years, with
                                    $212.6M
 Capitalisation:                                weighted average annual rent increases of 3.6%. A strong tenant profile with 87% of income
 Securities on Issue:                204.4M     generated from government, ASX-listed and multi-national tenants, diversified across a wide
                                                range of industries. As a result, ECF was able to achieve 98% rental collection in the June 2020
 52 Week Range:             $0.845 - $1.20
                                                quarter, increasing to 99.5% in the December 2020 half year period.

                                                ECF delivers an attractive yield of 9.6% for FY21, based on management forecasts of
                                                10.0cpu in distributions for FY21. Forecast earnings of 12.5cpu provides sufficient buffer for
                                                distributions on an 80% payout ratio. Upcoming lease expiries provide relatively low risk to
                                                earnings – 4.7% of income falls due in FY21, 7.1% in FY22 and 3.2% in FY23. The next major
                                                lease expiry is in FY24 where 20.6% of income falls due (including 17.2% from the
                                                Commonwealth government lease at Garema Court, ACT).

                                                Core Property initiates coverage on ECF with a BUY recommendation. We consider
                                                ECF provides an attractive value proposition with the potential for relatively high returns in
                                                comparison to the risks of the portfolio. ECF offers an attractive distribution yield of 9.6%, with
                                                a low 80% payout ratio providing a strong buffer against earnings. With a market capitalisation
                                                of $212M, the portfolio is well placed to grow to improve diversification. We value ECF at $1.32
                                                per unit based on a DCF valuation, with a 12-month roll forward value of $1.36 per unit.

 Share price performance                         Year Ended 30 June                       FY20A               FY21F               FY22F               FY23F
                                                 NPAT - Reported - $M                       -2.31               27.8                24.5                26.1
                                                 NPAT – FFO basis - $M                      13.41               25.5                24.5                26.1
                                                 Price/Earnings Ratio                       10.61                8.3                 8.7                 8.2
                                                 FFO per unit - cents                        6.61               12.5                12.0                12.8
                                                 FFO per unit - Growth                                        26.1%               -3.8%                6.3%
                                                 DPU - cents                                5.251               10.0                10.2                10.4
                                                 Distribution Yield                           NA               9.6%                9.8%               10.0%
                                                 NTA per unit                               $1.16              $1.20               $1.22               $1.26
                                                 Gearing                                   35.4%              34.0%               34.5%               34.2%
 Source: IRESS                                  Note 1: FY20A is for the period 6 Dec 2019 – 30 June 2020. Note: Gearing = (net debt – cash) / (net debt – cash
                                                + net assets). Source: Core Property estimates.

Copyright © 2021 Core Property Research Pty Ltd                                                                                                            2
www.coreprop.com.au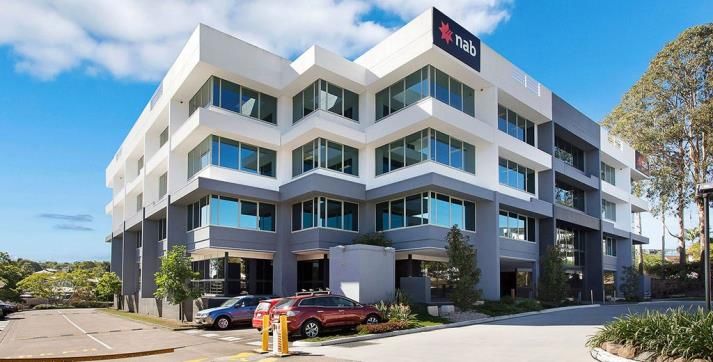
Elanor Commercial Property Fund (ECF)
23 March 2021

Key Metrics
 Strategy                                                                Board & Management
 Provide investors with above-average risk-adjusted returns through      Board of the RE consists of independent Chairman (Paul Bedbrook),
 regular distributions and capital growth:                               CEO and Managing Director (Glenn Willis) plus two independent
 - Invest in properties within well-established commercial precincts     directors with extensive property and financial services experience
 - Implement leasing and active management to grow income and            (Nigel Ampherlaw and Tony Fehon).
   property value                                                        Senior Management includes Glenn Willis (CEO), David Burgess
 - Acquire investment grade properties that enhance portfolio quality    (Co-Head of Real Estate & Fund Manager), Paul Siviour (COO),
 - Maintain a conservative capital structure                             Symon Simmons (CFO and Company Secretary).

 Portfolio                            Key Properties                     Key Tenants (by income)                  Geography

 Metric              Dec 2020         Dec 2020            % Portfolio    Dec 2020            % Portfolio          Dec 2020             % Portfolio
                                      WorkZone West,                                                              Western
 No of Properties             7                                36.2%     CIMIC                     39.9%                                     36.2%
                                      Perth WA                                                                    Australia
                                      Garema Court,                      Governments
 Valuation             $378.6M                                 18.9%                               22.7%          Queensland                 35.0%
                                      Canberra ACT                       (Various)
 Portfolio
                                      200 Adelaide St,
 Capitalisation          6.72%                                 11.7%     DXC Technology              9.5%         ACT                        18.9%
                                      Brisbane QLD
 Rate
                                      Limestone Centre,                                                           South
 Locations             Australia                                 9.7%    Hub Australia               8.3%                                       9.9%
                                      Ipswich QLD                                                                 Australia

                                      Campus DXC,
 Sector                  Office                                  9.6%    Optus                       3.5%
                                      Adelaide SA

 Occupancy               94.3%

 WALE                 4.0 years       Top 5                   86.1%      Top 5                    83.9%           Total                     100%

 Debt                Dec 2020         Expenses             Dec 2020      Performance                              PDS Forecast               FY201

 Gearing                 34.8%                                           EPU – FFO per Unit                                    6.04              6.57
                                                             0.65% of
                                      RE Fee
                                                                 GAV
 Target Gearing        30-40%                                            DPU – Distributions per Unit                          5.25              5.25

 Drawn Debt            $141.8M                              15% over     Payout Ratio                                         86.9%          79.9%
                                      Performance
                                                            10% p.a.
                                      Fee
 Facility limit        $147.0M                                hurdle1    Distribution Frequency                                Qtrly            Qtrly

 Weighted Average                     Operating              0.90% of
 Cost of Debt            2.08%        Expenses                   GAV     NTA per Unit                                            NA             $1.16

 Weighted Average                     Note 1: Calculated from 6 Dec      Note 1: Reflects period from 6 Dec 2019 – 30 June 2020 against forecast on
                      3.1 years       2019 – 30 June 2021, and
 Debt Maturity                                                           IPO
                                      annually on 30 June thereafter.
                                      The combined RE Fee and
 % Hedged                98.7%        Performance Fee for any one year
                                      is subject to a maximum 1.0% of
 LVR                     37.3%        GAV.

 LVR Covenant              45%

 ICR                      10.4x

 ICR Covenant              3.0x

Copyright © 2021 Core Property Research Pty Ltd                                                                                             3
www.coreprop.com.au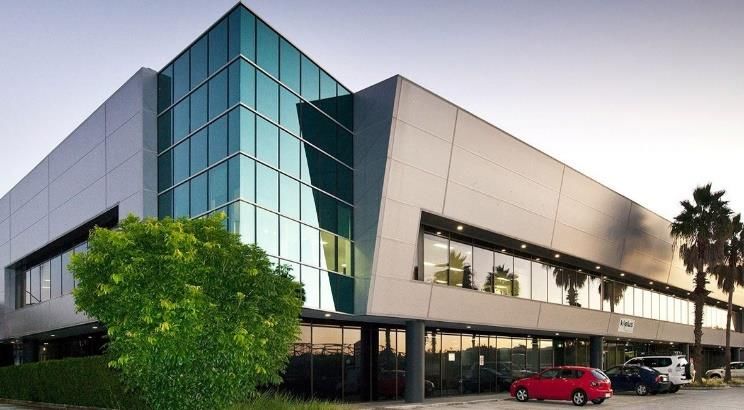
Elanor Commercial Property Fund (ECF)
23 March 2021

                         Investment Summary
                         The Elanor Commercial Property Fund (ASX: ECF) is an ASX listed property fund that invests in a portoflio of
                         office properties in metropolitan and established commercial precincts across Australia. Core Property
                         considers the key investment considerations for ECF to include:

                              ◼   Strategy: ECF strategy involves active leasing and asset management initiatives to grow the income
                                  of the portfolio as well as to seek value-add acquisitions to enhance overall portfolio quality. The
                                  strategy essentially focusses on generating higher returns for investors by focussing on metropolitan
                                  properties or centrally located properties with value-add opportunities.
                              ◼   Experienced management team: ECF is managed by Elanor Investors Group (ASX: ENN), led by
                                  CEO Glenn Willis and Fund Manager David Burgess, with key management personnel each having in
                                  excess of 20 years property experience.
                              ◼   Attractive Distribution Yield: ECF is foreast to deliver a 9.6% distribution yield for FY21, the
                                  highest amongst it’s listed peer group. This is largely due to the relatively high portfolio capitalisation
                                  rate of 6.72%, which, when combined with a strong tenancy profile, provides for an attractive
                                  investment profile.
                              ◼   Capitalisation Rates: The higher portfolio capitalisation rate essentially provides the potential for
                                  valuation gains as well as potential downside protection when capitalisation rates expand.
                              ◼   Portfolio: The portfolio currently consists of 7 office assets valued at $378.6M. The properties are
                                  spread across WA (36.2%, 1 property), QLD (35.0%, 4 properties), the ACT (18.9%, 1 property)
                                  and SA (9.9%, 1 property). Portfolio occupancy is 94.3% with a strong tenancy profile comprising
                                  87% government, listed or multinational tenants. Average rent reviews are 3.6% across the portfolio.
                                  The strong tenancy profile is evidenced by the rent collection rates during COVID-19 with 98% rent
                                  collection in the June 2020 quarter and 99.5% rent collection in the six months to December 2020.
                              ◼   Lease Expiry Profile: The Weighted Average Lease Expiry (WALE) of 4.0 years, with around 15%
                                  of income falling due over FY21-FY23. The next major lease expiry period is not until FY24 when
                                  20.6% of income falls due (including 17.2% of income relating to the Commonwealth of Australia
                                  lease at Garema Court, ACT expiring in March 2024). In particular we note that ECF’s two CBD based
                                  properties (Garema Court, ACT and 200 Adelaide St, Brisbane) are anchored by tenants such as the
                                  Commonwealth government of Australia and HUB Australia, a co-working office provider.
                              ◼   Growth potential: The demand for office space in Australia currently remains uncertain, due to
                                  the impact of COVID-19 on work patterns. Expectations are for metropolitan offices to remain strong
                                  as employers adopt a decentralised work model. We expect the current uncertainties in the office
                                  market may provide opportunities for ECF to acquire well priced office assets with value-add potential
                                  which will also increase diversification across the portfolio.
                              ◼   Valuation metrics: Core Property values ECF at $1.32 per unit, with a 12-month roll forward
                                  valuation of $1.36 per unit. ECF has a reported NTA of $1.18 per unit as at 31 December 2020.

Copyright © 2021 Core Property Research Pty Ltd                                                                                      4
www.coreprop.com.au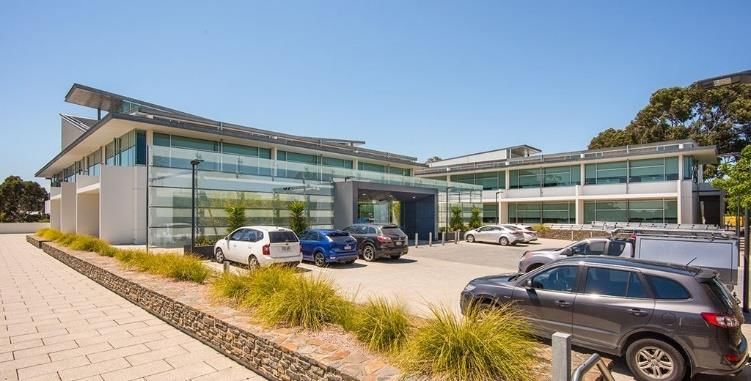
Elanor Commercial Property Fund (ECF)
23 March 2021

                         Fund Strategy
                         ECF is managed by Elanor Asset Services Pty Ltd with Elanor Funds Management Limited as the Responsible
                         Entity. Both are subsidiaries of Elanor Investors Group (ASX: ENN), which is aligned to the performance of
                         ECF and currently owns 15.0% of ECF’s units on issue.

                         ECF’s objective is to provide above average risk adjusted returns through a combination of distributions and
                         capital growth. To achieve this, the Fund’s strategy involves:

                              ◼      Investing in commercial properties located in major metropolitan areas or established commercial
                                     precincts;
                              ◼      Implementing leasing and active asset management to maximise income and value of the properties;
                              ◼      Considering further acquisitions of investment grade commercial properties that satisfy the Fund’s
                                     investment criteria and enhance the portfolio; and
                              ◼      Maintaining a conservative capital structure with a target gearing between 30% and 40%.

                         ECF’s focus is predominantly on metropolitan office assets, however it has also considered well located CBD
                         assets with compelling investment metrics. As part of the ASX listing in December 2019, ECF acquired 200
                         Adelaide St, Brisbane QLD on a 6.75% capitalisation rate. This was followed by the acquisition of Garema
                         Court, in Canberra ACT in March 2020 on a 6.50% capitalisation rate. Both properties are situated in core CBD
                         locations with strong tenant covenants. Garema Court is occupied by the Commonwealth government, with a
                         lease expiry in March 2024. The following table shows the performance of the ECF portfolio since listing.

                         Figure 1: ECF historical operational performance

                                                                                              Dec 2019          Jun 2020    Dec 2020
                                                                                                   IPO              FY20        1H21

                           Properties                                                                   6              7              7
                           Valuation ($M)                                                       $306.4M          $373.5M      $378.6M
                           Weighted Average Capitalisation Rate                                    6.99%          6.88%         6.72%
                           NLA (sqm)                                                              47,735          59,177        59,177
                           Occupancy                                                               96.8%          96.6%         94.3%
                           WALE (yrs)                                                                 4.9            4.3             4.0
                           NTA per security                                                         $1.17          $1.16         $1.18
                           LVR1                                                                    21.1%          35.6%         37.5%
                           Gearing                                                                 20.0%          35.4%         34.8%
                           FFO per security (6 mths)                                                   NA           6.57            6.34
                           Distributions per security (6 mths)                                      4.22   2
                                                                                                                    5.25            5.07

                         Note 1: LVR covenant is 45.0%. Note 2: Period from 1 July to 5 December. Source: ECF

                         Performance throughout COVID-19

                         ECF’s rental income was minimally impacted by COVID-19 through 2020, as the portfolio is heavily weighted
                         to government, ASX listed and large multinational tenants which comprise 87% of income.

                              ◼      June 2020 quarter rent collections were 98%, or 99.4% for the six-month period. Total COVID-19
                                     related impacts were -$0.5M, with -$0.1M from rent waivers and -$0.1M in rent deferrals across 8
                                     tenants. A provision for doubtful debts of $0.4M was also raised in the accounts.
                              ◼      For the six-months to December 2020 rent collections were 99.5%. A further 4 agreements for rent
                                     relief was provided (at Mt Gravatt, WorkZone, Limestone and 200 Adelaide St), representing $0.17M
                                     of rental income (or 1.1% of Net Operating Income). This amount was offset against the existing
                                     $0.4M in provisions. ECF does not expect any further rent waivers or rent deferrals to be provided.

Copyright © 2021 Core Property Research Pty Ltd                                                                                 5
www.coreprop.com.au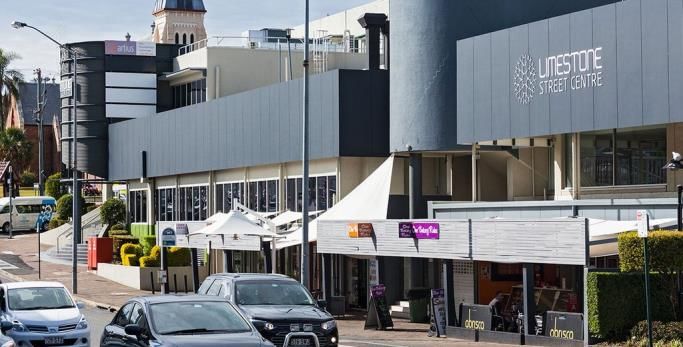
Elanor Commercial Property Fund (ECF)
23 March 2021

                         History of ECF
                         ECF was formed by the stapling of units in the Elanor Commercial Property Fund I (“ECPF I”) with the Elanor
                         Commercial Property Fund II (“ECPF II”).

                              ◼     The Elanor Commercial Property Fund I (“ECPF I”) was established in June 2016. The Fund owned
                                    a 51.5% interest in the WorkZone West Syndicate (acquired in August 2018), Campus DXC in
                                    Adelaide SA, NEXUS Centre in Mt Gravatt QLD, and 34 Corporate Drive in Cannon Hill QLD.
                              ◼     The Elanor Commercial Property Fund II (“ECPF II”) was originally established as the Limestone
                                    Street Centre Property Syndicate in December 2015. The Fund was a single asset fund which owned
                                    the Limestone Centre in Ipswich QLD.

                         In December 2018 the units of ECPF I and ECPF II were stapled together.

                         In December 2019 the stapled entity was listed on the ASX. As part of the ASX listing, an equity raising of
                         $173.6M was undertaken at $1.25 per stapled security, with the proceeds used to acquire the remaining
                         48.5% interest in the WorkZone West Syndicate as well as the acquisition of 200 Adelaide Street, Brisbane
                         QLD.
                         Figure 2: ECF Historical Overview

                           Date             Event
                                            The Limestone Street Centre Syndicate, which later became the Elanor Commercial Property Fund
                           Dec 2015
                                            II (ECPF II), begins operations with the acquisition of 38 Limestone Street, Ipswich, QLD.
                                            The Elanor Commercial Property Fund I (ECPF I) is established with operations commencing later
                           Jun 2016
                                            in the year on 1 December 2016.

                                            ECPF I acquires 51.5% of the WorkZone West Syndicate, which acquired the WorkZone West
                           Aug 2018         commercial property for $125.3M (100% value).

                                            The units of ECPF I and ECPF II are stapled together forming the consolidated ECF entity, with
                           Dec 2018
                                            the transaction seeing ECPF I acquiring ECPF II.
                                            ECF lists on the ASX through a $173.6M equity raising at $1.25 per stapled security. Alongside
                           Dec 2019         this, ECF acquires 200 Adelaide St, Brisbane for $44.2M representing a capitalisation rate of
                                            6.75%.
                                            ECF announces the settlement of the acquisition of Garema Court, CBD Canberra for $71.5M at a
                           Mar 2020
                                            capitalisation rate of 6.50%, increasing the Fund’s portfolio to 7 commercial properties.

                         Source: ECF, Core Property

                         Capital Structure

                         ECF is currently geared at 34.8% (December 2020), which lies at the midpoint of its target range of 30% -
                         40%.

                         The Fund has taken advantage of the current low interest environment to negotiate a low weighted average
                         cost of debt of 2.08%, with debt being 98.7% hedged. ECF has a target to have 70% - 100% of drawn debt
                         being fixed or hedged.

                         ECF remains within its key debt covenants with the current LVR at 37.3% (against an LVR covenant of 45.0%)
                         and current ICR of 10.4x (against a ICR covenant of 3.0x).

Copyright © 2021 Core Property Research Pty Ltd                                                                                     6
www.coreprop.com.au
Elanor Commercial Property Fund (ECF)
23 March 2021

                         Figure 3: ECF Capital Structure

                                                                                                             As at 31 December 2020
                           Facility limit                                                                                       $147.0M
                           Drawn Debt                                                                                           $141.8M
                           Drawn Debt (net of cash)                                                                             $132.4M
                           Weighted average debt expiry                                                                        3.1 years
                           All in cost of debt                                                                                    2.08%
                           Proportion Hedged                                                                                      98.7%
                           Gearing (Net Debt / (Debt + Equity)                                                                    34.8%
                           Target Gearing                                                                                    30% - 40%
                           Loan to Value Ratio                                                                                    37.3%
                           Loan to Value Covenant                                                                                 45.0%
                           Interest Cover Ratio                                                                                      10.4x
                           Interest Cover Covenant                                                                                    3.0x
                         Source: ECF

                         Fees
                         Management Fees

                         Under the Investment Management Agreement, the Manager is entitled to be paid a fee equal to 0.65% p.a.
                         of GAV (plus GST). In addition to this, the Manager is entitled to be reimbursed for investment management
                         expenses. Investment management fees are incurred on a monthly basis, with expenses reimbursed when
                         incurred.

                         Performance Fee

                         The Manager is also entitled to a Performance Fee of 15% of the amount by which the total return of the
                         Fund exceeds a hurdle rate of 10% per annum. The hurdle rate is based on the Net Asset Value (NAV) of ECF,
                         after adjustments to include all distributions, capital distributions, returns and other distributions received.

                               ◼     The first Performance Fee is for the pro-rata period from 6 December 2019 to 30 June 2021.
                                     Following this, Performance Fees are calculated and, if applicable, payable annually thereafter.
                               ◼     The aggregate of the Management Fee (0.65% p.a. of GAV) plus any Performance Fee is capped at
                                     1.00% p.a. of the Fund’s GAV. As such, the Performance Fee is effectively capped at 0.35% p.a. of
                                     GAV.
                               ◼     Any excess Performance Fee paid to the Manager must be repaid within 30 days after the end of the
                                     relevant financial year.
                               ◼     Investors should be aware that the Fee does not include a performance clawback, should the Fund
                                     underperform on any given year.

                         Distribution Policy

                         ECF targets a distribution payout ratio of 80% - 100% of FFO per annum. Distributions are paid on a quarterly
                         basis. For FY20 and 1H21 ECF delivered a payout ratio of 80.0%, at the low end of the range. Management
                         guidance is for FY21 distributions to continue at 80% of FFO.

                         Liquidity

                         ECF has a market capitalisation of $214.6M with 204.4M shares on issue. ECF typically trades around 60M+
                         units per annum, or around 29% of the number of shares on issue. The Top 20 shareholders own
                         approximately 59% of the shares on issue.

Copyright © 2021 Core Property Research Pty Ltd                                                                                  7
www.coreprop.com.au
Elanor Commercial Property Fund (ECF)
23 March 2021
The Property Portfolio
The ECF portfolio consists of 7 investment grade metropolitan office buildings diversified across Australia. The
portfolio is strongly weighted towards Western Australia (36.2%) and Queensland (35.0%), with a lesser
exposure to South Australia (18.9%) and ACT (9.9%).
The portfolio provides resilient metrics, with stable and secure income streams from blue-chip tenants:
◼ Portfolio occupancy of 94.3%;
◼ WALE of 4.0 years;
◼ Approximately 87% blue-chip tenants;
◼ Fixed rent reviews averaging 3.6% across 86.4% of leases.
The Fund’s valuation policy requires that each property in the portfolio is independently valued at least every
three years. All properties are also internally valued every six months, with the exception of those
independently valued in the same period.
Figure 4: ECF property portfolio – as at 31 Dec 2020 (See Appendix for individual overviews)
Value Portfolio NLA WALE Cap
Property Portfolio Weight Occup
$M sqm (yrs)1 Rate
%
WorkZone West, Perth WA $137.0M 36.2% 15,602 4.7 100.0% 6.50%
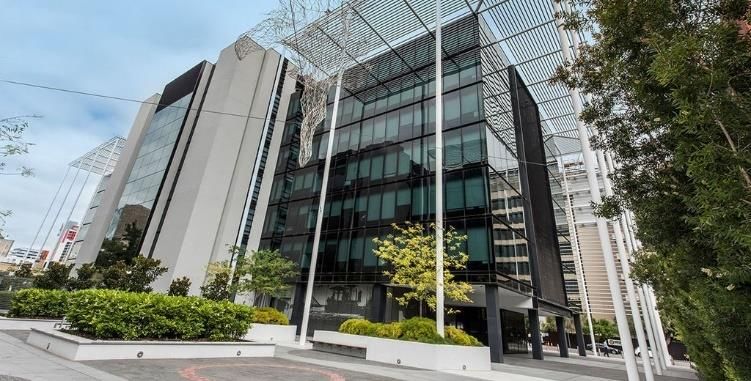
Garema Court, Canberra ACT $71.5M 18.9% 11,442 3.2 100.0% 6.50%
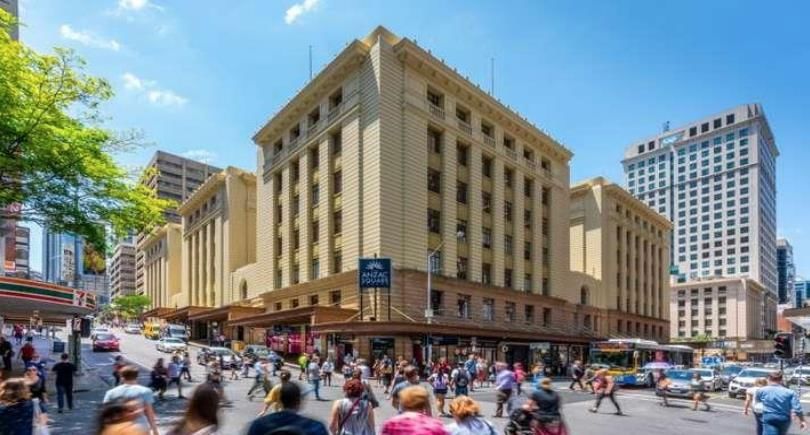
200 Adelaide Street, Brisbane QLD $44.2M 11.7% 5,957 6.7 100.0%2 6.75%
Limestone Centre, Ipswich QLD $36.3M 9.6% 7,183 2.3 94.3% 7.25%
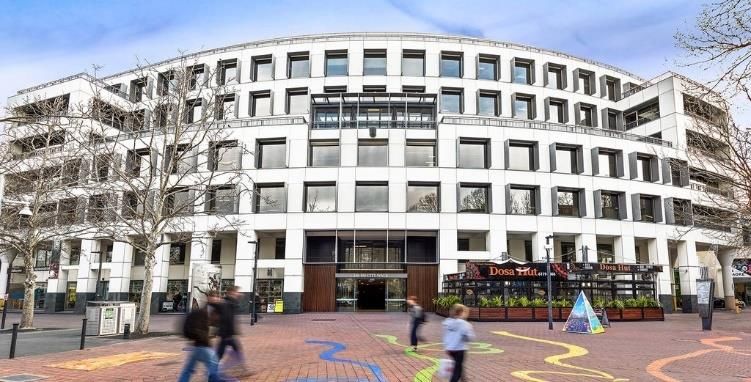
Campus DXC, Adelaide SA $37.5M 9.9% 6,288 4.7 100.0% 7.25%
NEXUS Centre, Mt Gravatt QLD $32.1M 8.5% 7,392 2.6 97.2% 7.25%
34 Corporate Drive, Cannon Hill QLD $20.0M 5.3% 5,313 0.5 48.4% 7.00%
Total Portfolio $378.6M 100.0% 59,177 4.0 94.3% 6.72%
Note 1: By income. Note 2: Includes Heads of Agreement of 1,274 sqm of space, excluding HOA occupancy is 78.6%. Source: ECF
Management have identified a few near-term objectives and growth opportunities to further activate the Fund’s
portfolio. These include:
◼ WorkZone West: Converting sub-letted tenants to direct leases and rental growth opportunities
with market rents below prevailing economic rents.
◼ Garema Court: Extending asset WALE by negotiating a lease extension with Commonwealth
government tenancy.
◼ 200 Adelaide Street: Cap rate compression following execution of leasing initiatives.
◼ Campus DXC: Expand facility for existing tenant and extend lease, develop vacant land for existing
or incoming tenants’ requirements (~6,000 sqm of vacant land available).
◼ Limestone Street Centre: Develop surplus land into an additional 2,000 sqm of lettable area,
aimed to attract healthcare tenants in the Ipswich CBD.
◼ 34 Corporate Drive & Nexus Centre: Aim to renew impending lease expiries and extend WALE.
Tenants
Overall, ECF enjoys a strong tenancy portfolio, with 87% of gross income derived from blue chip government,
ASX-listed or multi-national entities.
The portfolio’s top 5 tenants account for 83.9% of gross property income. The largest tenant, CIMIC, accounts
for 39.9% of total income. Other key tenants include various government tenants (22.7%), DXC Technology
(9.5%), Hub Australia (8.3%), Optus (3.5%), Wesfarmers (3.1%), Coles (2.8%), Clemenger BBDO (1.9%)
and NAB (0.9%).
Copyright © 2021 Core Property Research Pty Ltd 8
www.coreprop.com.auElanor Commercial Property Fund (ECF)
23 March 2021
Figure 5: Tenancy Distribution and Geographic Distribution – as at 31 Dec 2020
Tenant Mix (by key tenant) Tenant Mix (by location)
Source: ECF, Core Property
Occupancy Levels
ECF complements its secure tenancy profile with above average occupancy levels compared to comparable
listed office (or office portfolio) A-REITs. This is reflective of ECF’s strategy of generating long-term income
streams from well-established high-grade assets and tenants.
The following table shows that ECF, since IPO, havemaintained a strong occupancy level in the range of 94.3%
- 96.8% from December 2019 – 2020, at the high end of the range when compared to other listed office
portfolios.
Figure 6: Occupancy Levels of Office Portfolios
Portfolio Dec-19 Jun-20 Dec-20
AOF: Australian Unity Office Fund 95.2% 93.7% 95.3%
ABP (Office): Abacus (Office) 91.9% 91.5% 90.0%
COF: Centuria Office Fund 99.2% 98.1% 91.5%
DXS (Office): Dexus (Office) 97.4% 96.5% 96.0%
ECF: Elanor Commercial Property Fund 96.8% 96.6% 94.3%1
GDF (Office): GARDA Property (Office) 83.0% 80.0% 85.0%
GDI: GDI Property Group 84.9% 81.1% 65.9%
MGR (Office): Mirvac (Office) 98.5% 98.3% 96.0%
SGP (Office): Stockland (Office) 94.1% 93.6% 93.2%
Average 93.4% 92.2% 89.7%
Note 1: Includes Heads of agreement of 2.1% of vacant space at 200 Adelaide, excluding HOA occupancy is 92.2%. Source:
company announcements
Copyright © 2021 Core Property Research Pty Ltd 9
www.coreprop.com.auElanor Commercial Property Fund (ECF)
23 March 2021
Capitalisation Rates
ECF has maintained a relatively high capitalisation rate compared to its peers. This is reflective of ECF’s focus
on metropolitan business precincts.
Figure 7: Capitalisation Rates on Office Portfolios
Portfolio Dec-19 Jun-20 Dec-20
AOF: Australian Unity Office Fund 6.13% 6.09% 6.02%
ABP (Office): Abacus (Office) 5.62% 5.47% 5.82%
COF: Centuria Office Fund 5.94% 5.93% 5.90%
DXS (Office): Dexus (Office) 4.98% 4.97% 4.95%
ECF: Elanor Commercial Property Fund 6.99% 6.88% 6.72%
GDF (Office): GARDA Property (Office) 6.60% 6.60% 6.43%
GDI: GDI Property Group 6.92% 6.92% 6.61%
MGR (Office): Mirvac (Office) 5.25% 5.25% 5.17%
SGP (Office): Stockland (Office) 5.90% 5.80% 5.80%
Average 6.04% 5.99% 5.94%
Source: Core Property, company announcements
Lease Expiry Profile
ECF’s portfolio has around 15% of income falling between FY21-FY23, which provides for a relatively low level
of lease expiry risk over the next few years. The next key expiry is the Commonwealth of Australia lease at
Garema Court, ACT in March 2024, which accounts for 17.2% of portfolio income.
◼ FY21: 4.7% of income falls due with Optus as the remaining tenant at 34 Corporate Drive, Cannon Hill
QLD. The lease falls due in June 2021 with ongoing discussions for the partial renewal of the tenancy.
◼ FY22: 7.1% of income falls due across various tenancies at Limestone Centre, Ipswich QLD and NEXUS
Centre, Mt Gravatt QLD
◼ FY23: 3.2% of income falls due across various tenancies at Limestone Centre, Ipswich QLD and NEXUS
Centre, Mt Gravatt QLD
◼ FY24: 20.6% of income falls due, which includes the Commonwealth of Australia lease at Garema Court,
ACT (17.2% of income, expiry March 2024).
Figure 8: Lease expiry profile – as at 31 Dec 2020
Source: ECF, Core Property
Copyright © 2021 Core Property Research Pty Ltd 10
www.coreprop.com.auElanor Commercial Property Fund (ECF)
23 March 2021
Peer Comparison – Portfolio
The following is a comparison of ECF against other office funds listed on the ASX: Australian Unity Office Fund
(ASX: AOF), GARDA Property Group (ASX: GDF), GDI Property Group (ASX: GDI) and Centuria Office REIT
(ASX: COF).
We note that similar metropolitan office funds have expanded to improve diversification: Centuria Office REIT
(ASX: COF) which listed in December 2014 with a portfolio of $182.9M and has since increased to $2,032M;
and Australian Unity Office REIT (ASX: AOF) which listed in June 2016 with a portfolio of $392.8M and has
since increased to $681.1M. The closest comparable in terms of portfolio composition appears to be AOF,
which similarly focuses on metropolitan-based office assets, and is closer in portfolio size to ECF.
Figure 9: Portfolio Metrics - Listed peer comparison – as at 31 Dec 2020.
Portfolio
Code: Company Portfolio Description Cap Rate Occ WALE Gearing
Size ($M)
AOF: Australian 9 properties 2.6
$681.1M 6.02% 95.3% 30.7%
Unity Office Fund (metropolitan & fringe) years
GDF: GARDA 13 properties (incl. 7 5.9
$416.2M 6.60% 80.0% 36.7%
Property Group industrial) years
GDI: GDI Property 3.6
8 properties $843.7M 6.61% 65.9% 19.5%
Group years
COF: Centuria 4.5
23 properties $2,032.4M 5.90% 91.5% 34.6%
Office REIT years
ECF: Elanor
7 properties 4.0
Commercial $378.6M 6.72% 94.3% 34.8%
(metropolitan) years
Property Fund
Source: Core Property, company announcements
Peer Comparison – Valuation and Yield
ECF provides the highest yield of 9.6%, when compared to it’s peer group of pure office property funds on
the ASX. The other three listed peers, AOF, GDI and COF are generally trading on yields of 6.6% - 8.0%.
ECF also trades at a lower discount, of 11.9% below NTA, when compared to the peer group. The other three
listed peers are trading at levels which are 16.3% - 17.3% below NTA.
Figure 10: Portfolio Metrics - Listed peer comparison – Valuation and Yield
NTA per unit Distributions
NTA per Premium/
Market FY21F FY21F
Code: Company Price1 unit (Dec (Discount)
capitalisation Distn3 Yield
2020)2 to NTA
AOF: Australian Unity Office Fund $376.4M $2.29 $2.77 -17.3% $0.15 6.6%
GDI: GDI Property Group $574.6M $1.06 $1.27 -16.5% $0.0775 7.3%
COF: Centuria Office REIT $1,054.8M $2.05 $2.45 -16.3% $0.165 8.0%
ECF: Elanor Commercial Property
$212.6M $1.04 $1.18 -11.9% $0.10 9.6%
Fund
Note1: Price as at 23 March 2021. Note 2: Based on latest NTA for 31 December 2020 reporting period. Note 3: Based on
management forecast for 12 months to 30 June 2021. Source: Core Property, company announcements
Copyright © 2021 Core Property Research Pty Ltd 11
www.coreprop.com.auElanor Commercial Property Fund (ECF)
23 March 2021
Financial Forecasts & Valuation
Core Property presents its financial forecasts below, taking into account the recent 1H21 results, including the
current portfolio and securities on issue.
◼ FY21 earnings are in line with management forecasts for FY21 FFO per unit of 12.5 cpu and
distributions of 10.0 cpu. We note the exit of a tenant at 34 Corporate Drive, Cannon Hill QLD is
factored in the 2H21 results. The new tenant at 200 Adelaide St Brisbane QLD essentially replaces a
rental agreement in place.
◼ FY22 earnings reflects lower income assumptions at 34 Corporate Drive, Cannon Hill QLD.
We value ECF on a Discount Cashflow (DCF) basis at $1.31 per unit, with a 12 month roll forward valuation of
$1.36 per unit.
Figure 11: Earnings Forecast – Core Property
Financial Forecasts - $M FY20A FY21F FY22F FY23F
Property Revenue 29.7 35.3 35.1 37.1
Property Expenses -6.2 -7.0 -7.0 -7.4
RE Fees -2.6 -2.6 -2.8 -2.9
Finance Costs -4.0 -3.1 -3.1 -3.1
Other Income & Expenses 3.2 3.0 2.3 2.3
Funds from Operations 20.2 25.5 24.5 26.1
Earnings per Unit – FFO per unit 6.61 12.5 12.0 12.8
Management Guidance – FFP per unit 12.5
Payout Ratio 80.0% 80.1% 85.0% 81.5%
Distributions per Unit 5.251 10.0 10.2 10.4
Management Guidance – Distn per unit 10.0
Source: Core Property forecasts. Note 1: For the post IPO period 6 December 2019 to 30 June 2020.
Copyright © 2021 Core Property Research Pty Ltd 12
www.coreprop.com.auElanor Commercial Property Fund (ECF)
23 March 2021
Board & Management
ECF is managed by Elanor Asset Services Pty Limited, with Elanor Funds Management Limited as the
Responsible Entity. Both entities are subsidiaries of Elanor Investors Group (ASX: ENN).
Figure 12: Board of Directors & Senior Management
Board of Directors
Paul Bedbrook - Chairman
Paul has over 30 years’ experience in financial services, originally as an analyst, fund manager and GM &
Chief Investment Officer of Mercantile Mutual Investment Management (ING owned) from 1987. In total,
he was an executive for 26 years with ING Bank, with roles including: President and CEO of ING Direct
Bank-Canada, CEO of the ING Australia/ANZ Bank Wealth JV, and Regional CEO for ING Asia Pacific, Hong
Kong. Paul was appointed a Director of both ERF and the RE in June 2014 and is also the Chairman of
Zurich Financial Services Australia and its Life, General and Investment Companies.
Glenn Willis - Managing Director & Chief Executive Officer
Glenn has over 30 years’ experience in Australian and international capital markets. Prior to the
establishment and ASX listing of Elanor Investors Group in July 2014, Glenn was the co-founder and CEO
of Moss Capital (now Elanor Investors Group). Before this, he co-founded Grange Securities and led the
team in his role as Managing Director and CEO before it was acquired by Lehman Brothers International in
2007 as the platform for Lehman’s Australian investment banking and funds management operations.
Nigel Ampherlaw - Non-Executive Director
Nigel was appointed a Director to the RE in June 2014. Prior to this, he was a Partner of
PricewaterhouseCoopers for 22 years. Nigel has extensive experience across a number of leadership
positions, including heading the financial services audit, business advisory services and consulting
businesses. Nigel is the current Chairman of Credit Union Australia and a member of the Strategy
Committee. He is also a non-executive director of Quickstep Holdings Ltd and the Australia Red Cross Blood
Service.
Tony Fehon - Non-Executive Director
Tony has over 30 years’ experience working amongst Australia’s leading financial services and funds
management businesses. He is an Executive Director of Volt Bank Limited, with a primary responsibility for
capital management. Prior to this, he was an Executive Director for Macquarie Bank where he was involved
in the formation and listing of several Macquarie’s listed property trusts. In addition, Tony is also a director
of enLighten Australia and Team Mates Pty Limited.
Senior Management
Glenn Willis - Managing Director & Chief Executive Officer
See above.
David Burgess - Co-Head of Real Estate (ENN) & Fund Manager
David has over 20 years’ experience in property and equity markets, most recently as the Head of
Investment, Office and Logistics at GPT. David’s experience also encompasses a number of property
valuation roles and equity research roles at Credit Suisse and Citigroup. At Elanor, David is responsible for
development and overall investment performance of Elanor’s commercial and healthcare real estate
platforms.
Paul Siviour - Chief Operating Officer (ENN)
Paul has over 30 years’ experience in senior roles in financial services, investment banking and corporate
finance. Prior to Elanor’s listing, Paul was the Oceania Leader of Banking and Capital Markets and a partner
in the Financial Services practice at EY. He has also held a number of positions at Investec Bank Australia,
including Co-Head of the Private Bank and Senior Mergers and Acquisitions Adviser.
Symon Simmons - Chief Financial Officer, Company Secretary (ENN)
Symon has over 23 years’ business management experience, most recently as Chief Operating Officer at
Moss Capital, where he was responsible for Finance, Corporate, Human Resources, Legal and Administration.
Symon previously worked for EY gaining experience across a range of businesses and transactions. He is
Chairman of a social enterprise, Global Ethics Australia, and chairman and founder of The One Foundation
Australia, which supports essential infrastructure projects in developing nations in Africa and Asia.
Source: Elanor Investors Group
Copyright © 2021 Core Property Research Pty Ltd 13
www.coreprop.com.auElanor Commercial Property Fund (ECF)
23 March 2021
Appendices
Appendix 1: Properties in the Portfolio
The following is a summary of the ECF property portfolio.
Workzone West, Perth WA
As at 31 Dec 2020
Book Value $137.0M
Capitalisation Rate 6.50%
NLA (sqm) 15,602
Occupancy-by NLA 100%
WALE 4.7 years
Workzone West is a seven level, modern office building providing 15,602 sqm of NLA. The building is well-located
within close proximity to the Perth Central Train Station, Perth’s cultural centre, and the entertainment precinct of
Northbridge, and stands to benefit from incoming regional gentrification. The asset is fully leased to CPB Contactors,
a wholly owned subsidiary of ASX-listed CIMIC Group – ECF’s largest tenant (38.5% of total income).
Garema Court, Canberra ACT
As at 31 Dec 2020
Book Value $71.5M
Capitalisation Rate 6.50%
NLA (sqm) 11,442
Occupancy-by NLA 100%
WALE 3.2 years
Garema Court is a seven level, A Grade office building situated in the core of Canberra’s CBD and benefits from strong
…
connectivity to public transport. Constructed in 1996, the building has undergone periodic refurbishments in 2010,
2012 and 2019. These refurbishments have ensured the asset remains at a high standard, reflected in its 5.5-star
NABERS Energy rating (with Greenpower). Major tenants include the Commonwealth Government, which accounts
for 94% of total property income.
Copyright © 2021 Core Property Research Pty Ltd 14
www.coreprop.com.auElanor Commercial Property Fund (ECF)
23 March 2021
200 Adelaide Street, Brisbane, QLD
As at 31 Dec 2020
Book Value $44.2M
Capitalisation Rate 6.75%
NLA (sqm) 5,957
Occupancy-by NLA 100%1
WALE 6.7 Years
Note 1: includes Heads of Agreement over
vacant space. Excluding this, occupancy would
be 78.6%.
The property is a heritage office building located in the heart of the Brisbane CBD with direct undercover access to
Brisbane’s Central train station. The asset has recently completed a significant capital works program including new
lifts and refurbishments and provides 5,957 sqm of office accommodation. Major tenants include HUB Australia, with
a NLA of 3,358 sqm (71.6% of income), and Clemenger BBDO with a NLA of 1,045 sqm (22.4% of property income).
Limestone Centre, Ipswich, QLD
As at 31 Dec 2020
Book Value $36.3M
Capitalisation Rate 7.25%
NLA (sqm) 7,183
Occupancy-by NLA 94.3%
WALE 2.3 Years
Limestone Centre is a dual-purpose asset offering business park style office accommodation and ancillary retail within
the Ipswich CBD. The building is located on a 8,064 sqm site, comprising of 7,183 sqm of NLA across two buidlings,
with 285 sqm of retail space, 305 car bays and a 1,000 sqm parcel of vacant land. Key tenants of the centre include
Government entities and the Uniting Church.
Campus DXC, Adelaide, SA
As at 31 Dec 2020
Book Value $37.5M
Capitalisation Rate 6.75%
NLA (sqm) 6,288
Occupancy-by NLA 100.0%
WALE 4.7 Years
Campus DXC is a modern, two-level campus-style office building solely leased to DXC Technology, with a WALE of
4.7 years. DXC Technology is a first generation tenant who is highly-commited to the location, having made a number
of significant high-quality fit-out contributions. The asset is situated on a 12,370 sqm site, with a NLA of 6,328 sqm,
located 6km north-east of the Adelaide CBD. Notably, the site includes 6,000 sqm of vacant land currently used for
overflow parking which may be repurposed in the future to facilitate a tenant expansion.
Copyright © 2021 Core Property Research Pty Ltd 15
www.coreprop.com.auElanor Commercial Property Fund (ECF)
23 March 2021
NEXUS Centre, Upper Mount Gravatt, QLD
As at 31 Dec 2020
Book Value $32.1M
Capitalisation Rate 7.25%
NLA (sqm) 7,392
Occupancy-by NLA 97.2%
WALE 2.6 Years
NEXUS Corporate Centre is a free-standing four-level office building, with 7,392 sqm of NLA on a 6,455 sqm parcel
of land, with functional 2,005 sqm floorplates and 215 car bays. The property is well-located within the Upper Mount
Gravatt commercial precinct, approximately 14km south of the Brisbane CBD, and is anchored by Government and
major corporate tenants including Bunnings Group, Coles Supermarkets and the National Australia Bank. The asset
was constructed in 1990 and recently underwent cosmetic and mechanical refurbishment.
34 Corporate Drive, Cannon Hill, QLD
As at 31 Dec 2020
Book Value $20.0M
Capitalisation Rate 7.00%
NLA (sqm) 5,313
Occupancy-by NLA 48.4%
WALE 0.5 Years
34 Corporate Drive is a high-quality office and warehouse asset located within the Southgate Corporate Park, which
is located 6km from the Brisbane CBD and neighbours other large corporate offices. The asset has a NLA of 5,313
sqm on a site area of 12,930 sqm, with Optus occupying 48.4% of the space, with lease due in June 2021.
Copyright © 2021 Core Property Research Pty Ltd 16
www.coreprop.com.auElanor Commercial Property Fund (ECF) 23 March 2021 Appendix 2: Financial Summary Source: Core Property forecasts Note: Gearing = (net debt – cash) / (net debt – cash + net assets) Copyright © 2021 Core Property Research Pty Ltd 17 www.coreprop.com.au
Elanor Commercial Property Fund (ECF)
23 March 2021

 Ratings Process for A- REITs

 Core Property Research evaluates recommendations on listed A-REITs continuously, based on a range of qualitative and quantitative criteria
 ranging from management, appropriateness of the A-REIT’s capital structure and the property portfolio metrics. From a quantitative perspective,
 Core Property’s recommendations are based on Total Expected Returns (forecast distribution yield plus forecast capital gain or loss) for a 12-
 month time horizon, using a range of valuation methodologies. The two most commonly used valuation techniques are Discounted Cash Flow
 (DCF), which uses an A-REI’s expected free cash flow, and the net Asset Valuation (NAV) approach.

 The 12-month Total Return is compared with set total return bands and assigned a 12-month recommendation based on the Recommendation
 Definitions below.

 Recommendation Definitions

            Recommendation                  Definition

                      Buy                   If the 12-month Total Expected Return is forecast to be 15% or more.

               Accumulate                   If the 12-month Total Expected Return is forecast to be at least 10% and less than 15%.

                      Hold                  If the 12-month Total Expected Return is forecast to be at least 5% and less than 10%.

                 Reduce                     If the 12-month Total Expected Return is forecast to be at least 0% and less than 5%.

                      Sell                  If the 12-month Total Expected Return is forecast to be less than 0%.

 At times of extreme volatility, it is quite possible that the recommendations will swing between each of our bands. During such times, Core
 Property will adopt a more flexible approach to recommending stocks, based on a slightly longer duration, and as such, recommendations may
 appear to be inconsistent when compared with the bands. This is to avoid clouding value judgments with short-termism.

Copyright © 2021 Core Property Research Pty Ltd                                                                                         18
www.coreprop.com.au
Elanor Commercial Property Fund (ECF) 23 March 2021 Disclaimer & Disclosure Core Property has received a fee from the Manager for researching the product(s) which has then been subject to a detailed review and assessment by Core Property and its analysts to produce this report. In compiling this report, Core Property’s views remain fully independent of influence or conflicts of interest. Our team of analysts undertake an objective analysis of the offer and conclusions are presented to senior officers for review. The company specified in the Report (the “Participant”) has provided Core Property with information about its activities. Whilst the information contained in this publication has been prepared with all reasonable care from sources that Core Property believes are reliable, no responsibility or liability is accepted by Core Property for any errors, omissions or misstatements however caused. Any opinions, forecasts or recommendations reflects the judgement and assumptions of Core Property as at the date of publication and may change without notice. Core Property and the Participant, their officers, agents and employees exclude all liability whatsoever, in negligence or otherwise, for any loss or damage relating to this document to the full extent permitted by law. This publication is not and should not be construed as, personal financial product advice, an offer to sell or the solicitation of an offer to purchase or subscribe for any investment. Any opinion contained in the Report is unsolicited general information (general financial product advice) only. Neither Core Property nor the participant is aware that any recipient intends to rely on this Report or of the manner in which a recipient intends to use it. In preparing our information, it is not possible to take into consideration the investment objectives, financial situation or particular needs of any individual recipient. Investors should obtain and rely on individual financial advice from their investment advisor to determine whether opinions or recommendations (if any) contained in this publication are appropriate to their investment objectives. Investors should obtain and read a copy of, and consider the PDS/ Information Memorandum, which can be obtained by contacting the issuer of the financial product before making any decision to acquire, continue to hold, or dispose of any financial products mentioned in this report. This publication is not for public circulation or reproduction whether in whole or in part and is not to be disclosed to any person other than the intended recipient, without obtaining the prior written consent of Core Property. This report is intended for the residents of Australia. It is not intended for any person(s) who is resident of any other country. Core Property and/or the Participant, their officers, employees or its related bodies corporate may, from time to time hold positions in any securities included in this Report and may buy or sell such securities or engage in other transactions involving such securities. Core Property and the Participant, their directors and associates declare that from time to time they may hold interests in and/or earn brokerage, fees or other benefits from the securities mentioned in this publication. Core Property discloses that from time to time it or its officers, employees and related bodies corporate may have an interest in the securities, directly or indirectly, which are the subject of these statements and/or recommendations (if any) and may buy or sell securities in the companies mentioned in this publication; may effect transactions which may not be consistent with the statements and/or recommendations (if any) in this publication; may have directorships in the companies mentioned in this publication; and/or may perform paid services for the companies that are the subject of such statements and/or recommendations (if any). However, under no circumstances has Core Property been influenced, either directly or indirectly, in making any statements and/or recommendations (if any) contained in this Report. The information contained in this publication must be read in conjunction with the Disclaimer that can be located at http://www.coreprop.com.au/Public/Disclaimer. For more information regarding our services please refer to our website www.coreprop.com.au. Copyright © 2021 Core Property Research Pty Ltd 19 www.coreprop.com.au
You can also read