CITIC CLSA ASEAN Access Month: Zero-Carbon ASEAN - 24 March 2021 - Keppel Corporation
←
→
Page content transcription
If your browser does not render page correctly, please read the page content below
CITIC CLSA ASEAN Access Month:
Zero-Carbon ASEAN
24 March 2021
Outline
                                                                                                                                                                                               Constituent of:
       ▪ Overview and ESG                                                                                                                                                     3

       ▪ Portfolio Update                                                                                                                                                   10                   FTSE ST Large &
                                                                                                                                                                                                  Mid Cap Index

       ▪ Market Review                                                                                                                                                      21

       ▪ Additional Information                                                                                                                                             26                   FTSE EPRA Nareit
                                                                                                                                                                                               Global Developed Index
IMPORTANT NOTICE: The past performance of Keppel REIT is not necessarily indicative of its future performance. Certain statements made in this presentation may not be based on
historical information or facts and may be “forward-looking” statements due to a number of risks, uncertainties and assumptions. Representative examples of these factors include
(without limitation) general industry and economic conditions, interest rate trends, cost of capital and capital availability, competition from similar developments or shifts in expected
levels of property rental income, changes in operating expenses, including employee wages, benefits and training, property expenses and governmental and public policy changes, and
the continued availability of financing in the amounts and terms necessary to support future business.
                                                                                                                                                                                                     GPR 250
Prospective investors and unitholders of Keppel REIT (“Unitholders”) are cautioned not to place undue reliance on these forward-looking statements, which are based on the current                 Index Series
view of Keppel REIT Management Limited, as manager of Keppel REIT (the “Manager”) on future events. No representation or warranty, express or implied, is made as to, and no
reliance should be placed on, the fairness, accuracy, completeness or correctness of the information, or opinions contained in this presentation. None of the Manager, the trustee of
Keppel REIT or any of their respective advisors, representatives or agents shall have any responsibility or liability whatsoever (for negligence or otherwise) for any loss howsoever
arising from any use of this presentation or its contents or otherwise arising in connection with this presentation. The information set out herein may be subject to updating, completion,
revision, verification and amendment and such information may change materially. The value of units in Keppel REIT (“Units”) and the income derived from them may fall as well as rise.
Units are not obligations of, deposits in, or guaranteed by, the Manager or any of its affiliates. An investment in Units is subject to investment risks, including the possible loss of the
principal amount invested.
                                                                                                                                                                                                 MSCI Singapore
Investors have no right to request the Manager to redeem their Units while the Units are listed. It is intended that Unitholders may only deal in their Units through trading on Singapore       Small Cap Index
Exchange Securities Trading Limited (“SGX-ST”). Listing of the Units on SGX-ST does not guarantee a liquid market for the Units.

                                                                                                                                                                                                                  2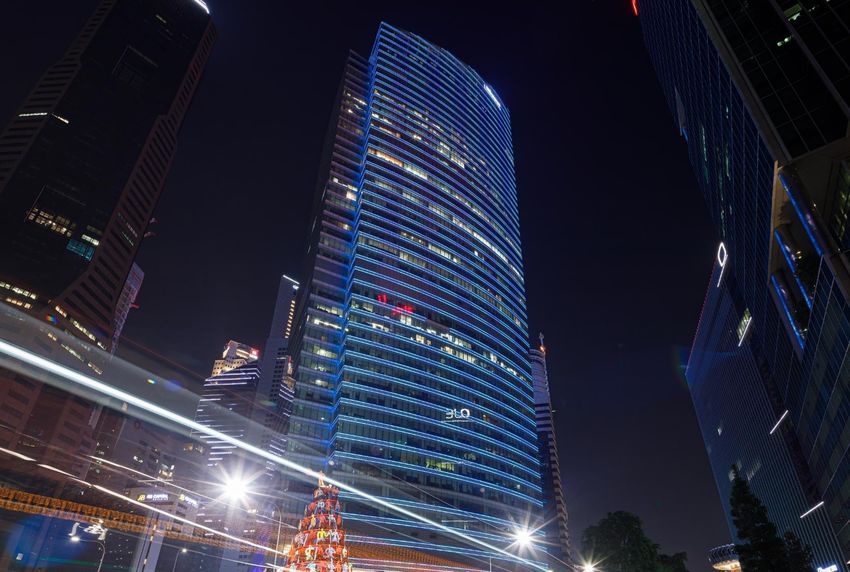
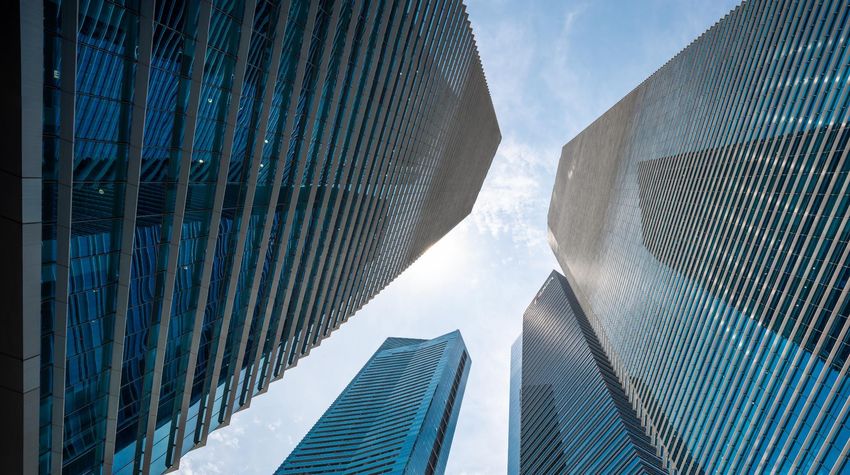
Sustainable Pan-Asian Portfolio with Income Resilience

   97.9% occupancy                                         6.7 years WALE                   ESG Awards
  Grade A commercial portfolio with
                                                          Long portfolio weighted average   ▪ BCA Green Mark Platinum award for
  strong committed occupancy to an
                                                               lease expiry (WALE)            all Singapore assets
established and diversified tenant base
                                                                                            ▪ 5 Stars and above in the NABERS Energy
                                                                                              rating for most Australian assets
   Marina Bay                       One Raffles     Ocean Financial
Financial Centre                      Quay              Centre

                                                                                            ESG Benchmarking
                                                                                            ▪ ISS ESG corporate rating – Prime status
                                                                                            ▪ Global Real Estate Sustainability
                                                                                              Benchmark (GRESB) – Green Star status

                                                                                            ESG Indices
                                                                                            ▪ iEdge SG ESG Transparency Index
                                                                                            ▪ iEdge SG ESG Leaders Index

                   Note: Information as of 31 Dec 2020.                                                                        3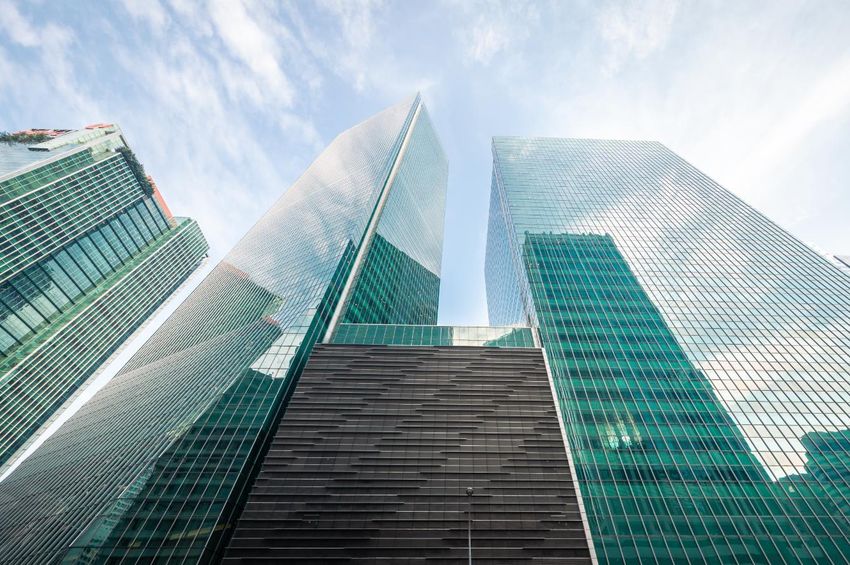
FY 2020 Key Highlights

 5.73 cents                                       Ongoing portfolio
 FY 2020 DPU                                      optimisation
 Up 2.7% y-o-y; 2H 2020 DPU was
                                                  Added Melbourne’s Victoria Police Centre(1) and
 2.93 cents (Up 4.6% y-o-y)
                                                  Sydney’s Pinnacle Office Park. Proposed
                                                  acquisition of Keppel Bay Tower in Singapore

 $194.6m
 FY 2020 distributable income,                    97.9%
 including $10.0m capital gains                   High portfolio committed occupancy
 Up 2.8% y-o-y                                    as at 31 Dec 2020

                                                                                                        Keppel Bay Tower
 37.3%                                            6.7 years                                           Proposed acquisition of Grade A office
 Aggregate leverage as at 31 Dec 2020             Long portfolio weighted average lease expiry         building in the Keppel Bay waterfront
                                                  as at 31 Dec 2020
 Low all-in interest rate of 2.35%                                                                     precinct is a strategic expansion that
                                                                                                    complements the REIT’s core CBD offering

                 (1)   Formerly known as 311 Spencer Street.                                                                           4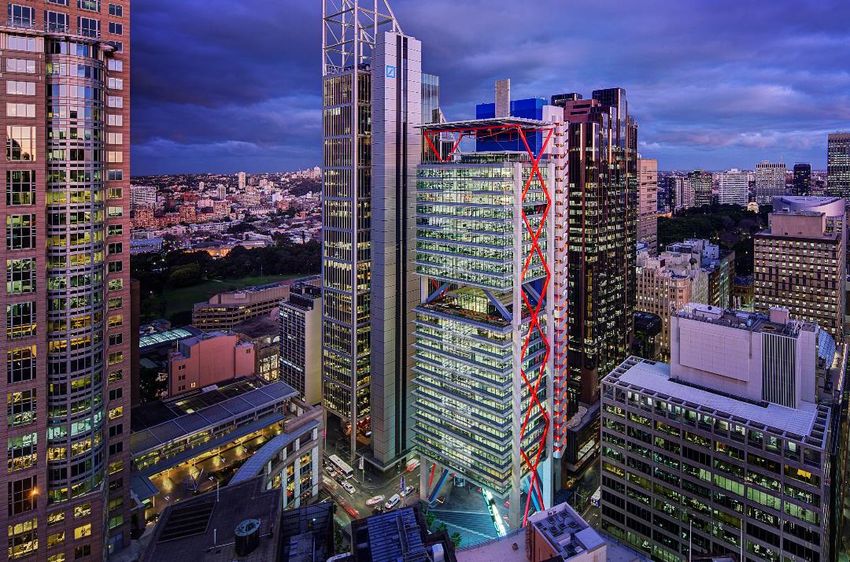
Resilient Portfolio Anchored by Singapore CBD Assets
                          $8.9 billion portfolio in key business districts of Singapore, Australia and South Korea
                                           enhances income diversification and long-term stability

                                                                                                            T Tower, Seoul
                                            8 Chifley Square,                                                99.4% Interest
                     Pinnacle Office
                                                 Sydney                                                     Occupancy: 98.6%
                      Park, Sydney                                               South Korea                                                    Ocean Financial
                       100% Interest           50% Interest
                                                                                     3.5%                                                           Centre
                     Occupancy: 96.9%        Occupancy: 100%
                                                                                                                                                 79.9% Interest
                                                                                                                                                Occupancy: 97.5%

  8 Exhibition Street,                                                                                                                                       Marina Bay
      Melbourne
      50% Interest                                                                                   Singapore                                            Financial Centre
                                                                                                                                                           33.3% Interest
    Occupancy: 99.6%

                                                                                                    78.0%
                                                                                                                                                          Occupancy: 97.4%

Victoria Police Centre,
                                       Australia
      Melbourne
     50% Interest
                                        18.5%
                                                                                                                                                     One Raffles Quay
   Occupancy: 100%                                                                                                                                     33.3% Interest
                                                                                                                                                      Occupancy: 97.3%
         275 George Street,                                David Malcolm
             Brisbane                                      Justice Centre,
            50% Interest                                        Perth                                                                       Keppel Bay Tower
          Occupancy: 96.5%                                   50% Interest                                                              (Pending acquisition completion)
                                                           Occupancy: 100%                                                                     100% Interest
                                                                                                                                             Occupancy: 98.5%

                            Note: Information as of 31 Dec 2020 and assuming the inclusion of Keppel Bay Tower in Singapore which was announced on 23 Dec 2020            5
                            and targeted for acquisition completion in 2Q 2021. Excluding Keppel Bay Tower, the assets under management would have been $8.2b.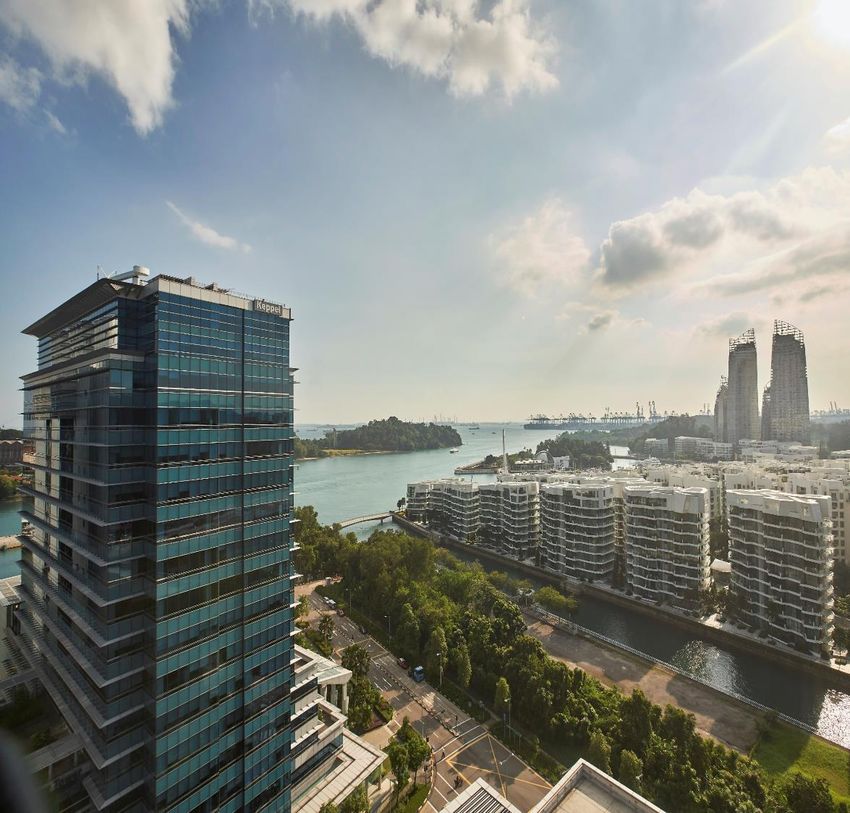
Commitment to ESG Excellence
▪ Integrated into business operations: ESG issues have been and         Key Material Issues and Targets
  remain key considerations in Keppel REIT’s strategy formulation and
  business operations

▪ Communicating progress: Annual sustainability reporting in
  accordance with the Global Reporting Initiative (GRI) Standards,
  which includes outline of sustainability issues and targets

▪ Advancing sustainability agenda:
     o Expanded carbon emissions tracking to include Scope 3
       emissions from business air travel and waste disposal
     o Incorporated nine of the United Nations’ Sustainable
       Development Goals (SDGs) as a supporting framework to guide
       Keppel REIT’s sustainability strategy

                                                                                                          6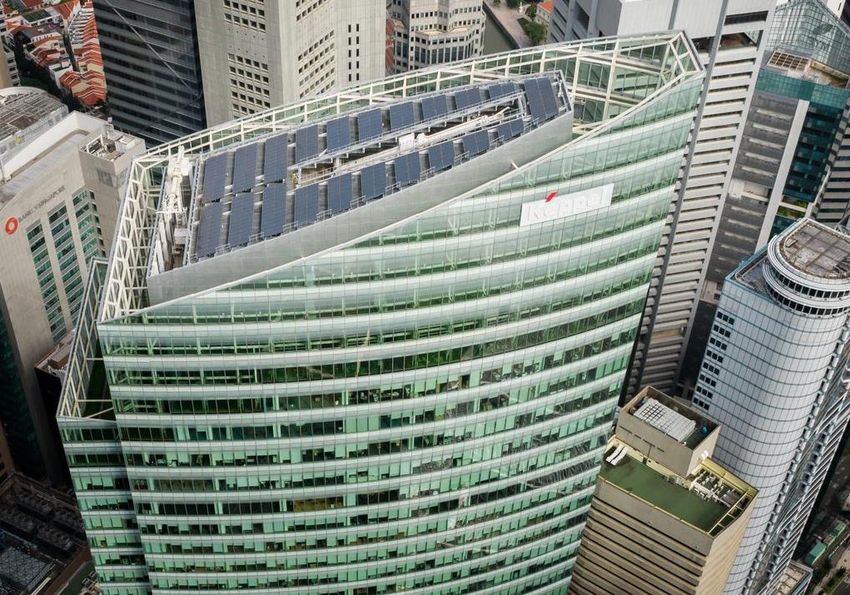
Commitment to ESG Excellence (Cont’d)

  Environmental Stewardship

▪ Keppel REIT supports the climate change agenda.

▪ Initiatives to improve energy performance include energy
  optimisation measures and the use of renewable energy
  resources:

     ▪ Ocean Financial Centre’s rooftop solar panel system
       supplements its electricity needs with renewable energy.
       Electricity usage is also reduced by switching to more
       energy-efficient lighting solutions.

     ▪ 8 Exhibition Street is partially powered by purchased
       renewable energy to reduce greenhouse gas emissions.

▪ In 2020, Keppel REIT registered a year-on-year decrease* in
  portfolio intensity levels of greenhouse gas emissions, energy
  consumption and water usage.

                  Note: 2020’s environmental data may not be comparable with 2019’s due to significantly lower footfall in the properties where many tenants
                                                                                                                                                               7
                  were telecommuting for the majority of the year due to the COVID-19 pandemic.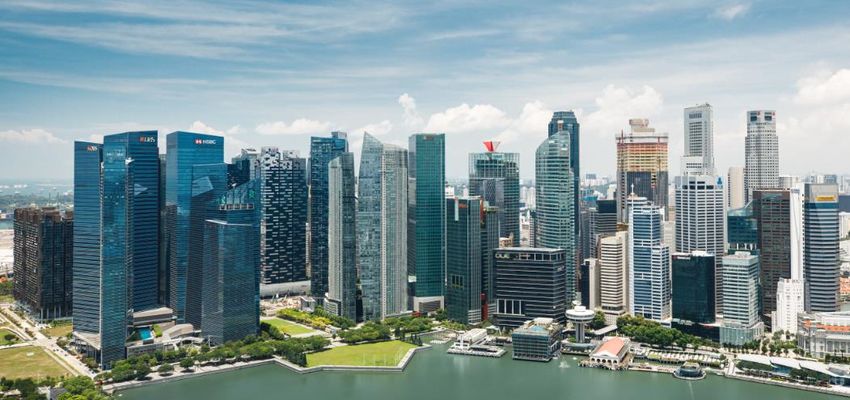
Commitment to ESG Excellence (Cont’d)

    Responsible Business                                             Board Composition

▪ ESG issues are considered in key business decisions and           Independent          Female
                                                                    Directors            Directors
  operations due to their long-term impact on the environment,
  community and Keppel REIT’s financial performance.                5/8                  2/8
▪ The Manager is committed to upholding strong corporate
  governance and robust risk management. The majority of the
  Directors on the Board are independent.

▪ Stringent measures were implemented at Keppel REIT’s properties
  to provide safe and conducive work environment for
  building occupants.

▪ The Manager encouraged the adoption of Keppel’s sustainability
  principles throughout the supply chain.

                                                                                                     8
Commitment to ESG Excellence (Cont’d)
    People and Community
▪ Initiatives to support employee wellness, boost morale and foster collaboration during the pandemic, including virtual
  events such as town halls, dialogue sessions, exercise workshops and care packages.
▪ Employees were also encouraged to continue to upskill through online courses while telecommuting.
▪ The Manager sought to uplift the community during this trying period by bring outreach efforts online. Approximately
  $108,000 contributed to Keppel Care Foundation to support the Keppel Group’s philanthropic activities.
▪ Tenant engagement initiatives to foster relationships, as well as raise awareness of important issues and have a positive
  impact on building occupants and the surrounding community.

                                              “Lighting City Halls in Green”
            Workforce Training and                                                 Virtual Collaborative Activities for
                                             Global Campaign to Demonstrate
            Community Engagement                                                            Adopted Charity
                                              Commitment to Climate Action

      Training Hours     Total Community
      per Employee       Outreach Hours

      13.2h              790h
      in 2020            in 2020

                                                                                                                          9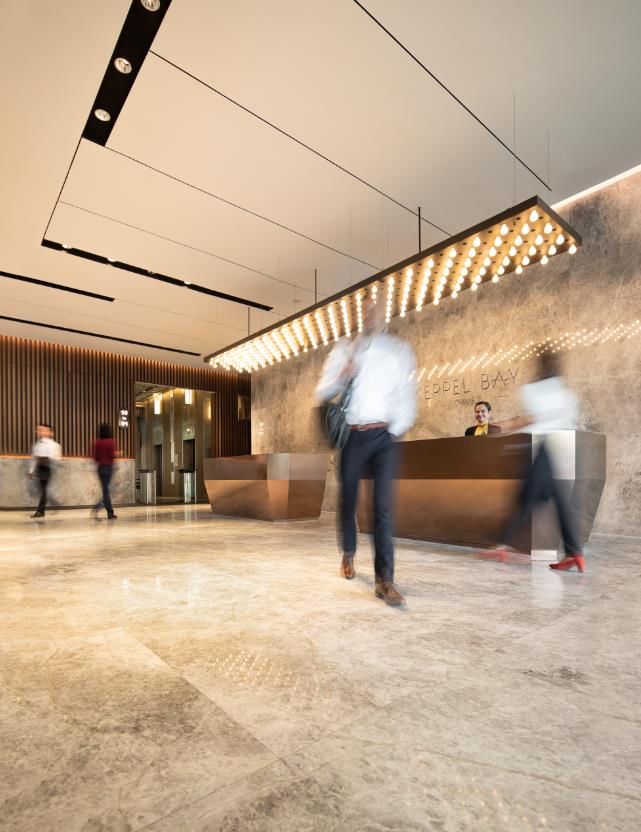
Portfolio
Update

Ocean Financial Centre
lit in blue in support of the
#SeeItBlue campaign that
highlights the importance of
mental well-being and
expresses gratitude to
frontline workers battling the
COVID-19 pandemic

                                 10
Established and Diversified Tenant Base
▪ Keppel REIT has a diversified tenant ▪ Top 10 tenants take up 41.5% of NLA
base of 353(1) tenants, many of which are and contribute 36.7% of gross rent
established blue-chip corporations
Top 10 Tenants
Tenant Business Sector
State of Victoria 10.3%
Banking, insurance and financial services 32.4% DBS 5.4%
Government agency 16.0%
Technology, media and telecommunications 15.4% Aristocrat Technologies 4.4%
Legal 7.1% Government of
GOWA
Western Australia 4.3%
Energy, natural resources, shipping and marine 6.4% Victoria Police Centre
Real estate and property services 5.6% Standard Chartered 3.6% 8 Exhibition Street
Accounting and consultancy services 4.8% Marina Bay
Ernst & Young 3.4% Financial Centre
Services 4.6%
Pinnacle Office Park
Manufacturing and distribution 4.2% BNP Paribas 3.3%
David Malcolm
Retail and food & beverage 2.7% Telstra 2.8% Justice Centre
Hospitality and leisure 0.1% One Raffles Quay
Others 0.7%
Drew & Napier 2.0% Ocean Financial Centre
Total 100% ANZ 2.0% 275 George Street
Note: All data as at 31 Dec 2020 and based on portfolio committed NLA.
(1) Tenants with multiple leases were accounted as one tenant. 11Managing the COVID-19 Situation
▪ Keppel REIT’s quality office portfolio and high-quality tenant profile continue to provide income stability
and resilience
▪ To support tenants, and in line with government measures, measures were implemented to alleviate
tenants’ cashflow and cost pressures
(2)
(1)
Tenant relief measures
Rental collection Total rent deferrals
Approx. $14.6m
98% $1.9m including estimated $9.9m of
in 4Q 2020 as at 31 Dec 2020 government property tax rebates
and cash grant
(1) Rental deferrals are excluded from rental collection in 4Q 2020.
(2) Estimates as at 31 Dec 2020. Final tenant eligibility will be dependent on the assessment by the authorities. 12Continuing Portfolio Optimisation
FY 2020 developments:
▪ Portfolio optimisation to improve yield and ▪ Commencement of Victoria Police Centre’s income contribution
create long-term value for Unitholders ▪ Acquired Pinnacle Office Park to expand into Sydney’s Grade A
▪ Holding quality assets across different metropolitan office space
markets enhances income diversification ▪ Announced proposed acquisition of Keppel Bay Tower in
and long-term stability Singapore
Dec 2020: Announced
Dec 2018: Divested Nov 2019: Divested
Jul 2020: Completed Dec 2020: Acquired
May 2019: Acquired Proposed Acquisition
20% of Ocean Financial Bugis Junction Towers Victoria Police Centre Pinnacle Office Park
T Tower in Seoul of Keppel Bay Tower in
Centre in Singapore in Singapore in Melbourne in Sydney
Singapore
13Victoria Police Centre Achieved Practical Completion
▪ Commencement of the 30-year lease for Victoria Police’s new
headquarters contributes a steady income stream to Keppel REIT
▪ The Grade A office tower is powered by 100% renewable electricity
as part of the City of Melbourne’s second Melbourne Renewable
Energy Project
Victoria Police Centre at 311 Spencer Street, Melbourne
Ownership 50.0%
Attributable NLA 364,180 sf (33,833 sm)
Tenure Freehold
Committed Occupancy 100%
Valuation(1) A$385.0m (S$380.0m)
(1) Valuation as at 31 Dec 2020 based on Keppel REIT’s interest in the property and on the exchange rate of A$1 = S$0.9871. 14Acquired Pinnacle Office Park in Sydney
▪ Acquisition completed on 31 Dec 2020 as part of ongoing portfolio
optimisation to improve income resilience and portfolio yield
▪ Gains exposure to Macquarie Park, a key Australian metropolitan
office market
▪ Expands into Grade A metropolitan office space to meet demand for
cost-effective or hub-and-spoke business models Grade A property comprising three office buildings near
the Macquarie Park Metro Station
Pinnacle Office Park, Sydney
Ownership 100.0%
Attributable NLA 378,164 sf (35,132 sm)
Tenure Freehold
Committed Occupancy 96.9%
Potential partial re-development opportunity in the
Valuation(1) A$306.1m ($302.1m) medium term
(1) Valuation as at 31 Dec 2020 based on Keppel REIT’s interest in the property and on the exchange rate of A$1 = S$0.9871. 15Proposed Acquisition of Keppel Bay Tower
▪ DPU-accretive acquisition of a 100% interest in Keppel Bay Tower, a Grade A office building strategically located in the
HarbourFront/Alexandra submarket of Singapore
▪ Acquisition complements the REIT’s core CBD offering, and is consistent with its strategy of strengthening and
diversifying its portfolio, while staying focused on its core markets
▪ Strong and diverse tenant base of multinational corporations and anchored by the Keppel Group
▪ Post-Acquisition, portfolio WALE by NLA remains long at 6.3 years(1), committed occupancy remains high at 98.0%(1),
while aggregate leverage will be 39.0%(2)
Transaction Overview
Agreed Property Value $657.2m(3) ($1,700 psf)
▪ JLL (commissioned by Trustee): $665.0m ($1,720 psf)
Valuation(4)
▪ Cushman & Wakefield (commissioned by Manager): $667.3m ($1,726 psf)
Method of Financing Net proceeds from the private placement and loan facilities
NPI Yield 4.0%(5)
DPU Accretion +2.8%(6) (FY 2020)
Singapore’s first commercial development to be
fully powered by renewable energy and certified
BCA Green Mark Platinum (Zero Energy) Expected Completion 2Q 2021
(1) Based on portfolio committed NLA as at 31 Dec 2020 , assuming the Property was acquired on 31 Dec 2020; (2) Assuming the Acquisition was funded approximately 60% by debt
and 40% by equity; (3) Total Acquisition Cost would be $667.0 million, comprising total consideration which takes into account the estimated net asset value, transaction costs and equity
fund raising costs; (4) Takes into account rental support of up to $3.2 million for vacant units and leases that are expiring in the 18 months post-completion. Without rental support, 16
valuation is $664.0 million ($1,718 psf) and $665.0 million ($1,720 psf) by JLL and Cushman & Wakefield respectively; (5) Based on the estimated NPI for a year from Completion,
including Rental Support for the same period; (6) On a pro forma basis as if the Acquisition was completed on 1 Jan 2020, including Rental Support.Proposed Acquisition’s
Investment Merits
DPU and NPI yield accretive acquisition that
1 enhances Keppel REIT’s distributions and
improves total unitholder returns
Diversifies portfolio and strengthens tenant base
2 for income resilience
Strategic expansion that complements the current
3 core CBD offering
Grade A waterfront office with excellent
4 connectivity to CBD and amenities
Augments green footprint via renewable energy
5 and technology innovation
6 Increases free float and liquidity
Photo Credit: ST Press 17FY 2020 Portfolio Update
New leasing demand and expansions from:
Total Leases Committed Leases Committed Leases Committed
by Geography(2) by Type(2) Banking, insurance and financial services 36.5%
~1,205,500 sf Australia, Renewal, Real estate and property services 34.2%
(Attributable ~510,500 sf) Singapore, 21.4% 52.6%
66.0% Technology, media and telecommunications 13.5%
Retention Rate South Energy, natural resources, shipping and marine 8.9%
Korea,
72%(1) 12.6%
Rent review,
New,
23.8%
Retail and F&B 4.9%
23.6% Accounting and consultancy services 2.0%
▪ High portfolio committed occupancy of 97.9%
▪ Long overall portfolio WALE of 6.7 years (Singapore portfolio: 2.9 years,
Australia portfolio: 12.8 years, South Korea portfolio: 2.0 years);
Top 10 tenants’ WALE was 11.8 years
▪ Completed asset enhancement initiatives at 8 Exhibition Street in
Melbourne to rejuvenate the asset’s lobby and other amenities
(1) For FY 2020. Retention rate for 4Q 2020 was 44% due mainly to non-renewals at One Raffles Quay and Marina Bay Financial Centre.
More than half of the non-renewed spaces have since been committed to new and expanding tenants. 18
(2) Based on committed attributable area.FY 2020 Portfolio Update (Cont’d)
▪ Average signing rent for Singapore office leases concluded in FY 2020 was $11.02(1) psf pm
▪ Average expiring rents(2) of Singapore office leases (psf pm): $9.76 in 2021, $10.26 in 2022 and $11.00 in 2023
Lease Expiries and Rent Reviews 34.7%
(Based on Committed Attributable NLA)
Expiring Leases 16.8%
12.2% 12.5% 13.6%
Rent Review Leases 11.4% 10.3%
5.3%
0.0% 0.2% 0.3% 1.2%
2021 2022 2023 2024 2025 2026 and beyond
Lease Expiries and Rent Reviews (Based on Committed Attributable Gross Rent)
Expiring leases 13.0% 18.8% 13.8% 13.9% 11.9% 28.6%
Rent review leases 6.2% - 0.2% 0.3% 1.6% 11.3%
Geographic Breakdown of Expiries and Rent Reviews(3)
Singapore 13.9% 12.7% 8.8% 10.2% 8.7% 7.0%
Australia 2.2% 1.6% 2.5% 1.5% 2.6% 41.0%
South Korea 1.4% 2.5% 1.4% - 0.2% 0.3%
(1) Based on a weighted average calculation. Simple average signing rent was $11.61 psf pm.
(2) Weighted average based on attributable NLA of office lease expiries and reviews in Singapore. 19
(3) Based on committed attributable area.Operating in the New Environment
▪ Physical offices will remain a necessity, although Safety measures to facilitate return to workplaces:
the form and functions of the office will evolve
Keppel REIT will continue to optimise the
portfolio and calibrate its leasing strategy to
meet potential shifts in occupier demand
Safe distancing reminders on
Thermal scanning at entrances
patrolling RoboGuard
Robust Best-in-class,
portfolio in safe and
quality well- technologically-
networked sound work
locations environments
Proactive tenant
engagement to find
solutions that best Hand sanitisers at Safe distancing Disinfection of high
support occupier needs lift lobbies reminders at gantries contact areas
20Market
Review
8 Chifley Square,
Sydney
21Singapore Office Market
▪ Average Grade A office rents registered a decrease to $10.40 psf pm in 4Q 2020 while average occupancy
in core CBD decreased slightly to 93.8%
Grade A Rent and Core CBD Occupancy Demand and Supply
2.1 1.9 1.7
1.3
$15 94.8% 95.8% 93.8% 94.8% 95.8% 95.4% 94.4% 93.9% 93.8% 100% 0.8 0.8 0.9 0.9 0.9
0.7 0.7
0.4 0.4 0.3
0.02 0.2
$12 $11.55 $11.50 $11.15 80%
$10.40 $10.80 $10.70 $10.40 2015 2016 2017 2018 2019 2020 2021 2022 2023 2024
$9.10 $9.40 (1) (1) (2)
Net Supply Net Demand Forecast Supply
$9 60%
Key Upcoming Supply in CBD(2) sf
$6 40%
Afro-Asia i-Mark 140,000
2021 CapitaSpring 635,000
$3 20% Hub Synergy Point Redevelopment 131,200
$0 0% 2022 Guoco Midtown 650,000
Dec Dec Dec Dec Dec Mar Jun Sep Dec
2023 Central Boulevard Towers 1,258,000
2015 2016 2017 2018 2019 2020 2020 2020 2020
Average Grade A Rent ($ psf pm) Keppel Towers Redevelopment 522,800
2024
Core CBD Average Occupancy (%) Shaw Towers Redevelopment 406,900
(1) Based on URA data on historical net demand and supply of office space in Downtown Core
Source: CBRE, 4Q 2020. and Rest of Central Area. Supply is calculated as net change of stock over the year and
may include office stock removed from market due to demolitions or change of use.
(2) Based on CBRE data on CBD Core and CBD Fringe.
22Australia Office Market
95.2% 94.5% 93.0% 98.2% 98.2% 92.5%
91.8% 91.3% 94.9% 96.0% 89.7% 87.5% 100% 90.1% 92.1% 94.0%
97.0%
87.9% 86.2% 100%
1,200 1,045 1,058 1,028 1,200 90%
964 1,032 80% 80%
946
Sydney CBD 900 799
930
60%
Melbourne CBD 900
70%
60%
679
503 538 573 575 559 553 546 50%
600 40% 600 448 40%
406
30%
Prime Grade occupancy
300 20% Prime Grade occupancy
300 20%
10%
was lower at 87.5% 0 0% was lower at 86.2% 0 0%
4Q15 4Q16 4Q17 4Q18 4Q19 1Q20 2Q20 3Q20 4Q20 4Q15 4Q16 4Q17 4Q18 4Q19 1Q20 2Q20 3Q20 4Q20
Prime Gross Effective Rent (AUD psm/year) Prime Gross Effective Rent (AUD psm/year)
Prime Grade Occupancy (%) Prime Grade Occupancy (%)
94.3% 94.3% 93.7% 93.6% 94.7% 92.2% 94.8% 92.8% 91.5% 89.2% 89.0% 88.2% 87.7% 100%
89.3% 89.6% 100% 86.8% 86.0% 89.6%
1,200
1,200 80%
80%
Macquarie Park 900 60%
Brisbane CBD 900 60%
600 409 418 417 40%
600 40% 397 389 386 396 411 407
344 367 391 392 386 377 378
305 321 300 20%
Prime Grade occupancy
300 20% Prime Grade occupancy
0 0%
was higher at 89.6% 0 0% was lower at 87.7% 4Q15 4Q16 4Q17 4Q18 4Q19 1Q20 2Q20 3Q20 4Q20
4Q15 4Q16 4Q17 4Q18 4Q19 1Q20 2Q20 3Q20 4Q20
Prime Gross Effective Rent (AUD psm/year)
Prime Gross Effective Rent (AUD psm/year)
Prime Grade Occupancy (%)
Prime Grade Occupancy (%)
85.6% 84.7% 84.1% 84.3% 100%
81.4% 84.0% 86.5%
1,200 76.5% 77.7%
80%
Perth CBD 900 60%
600 491 431 435 447 453 456 456 444 444 40%
Prime Grade occupancy
300 20%
was higher at 84.3% 0 0%
4Q15 4Q16 4Q17 4Q18 4Q19 1Q20 2Q20 3Q20 4Q20
Prime Gross Effective Rent (AUD psm/year)
Prime Grade Occupancy (%)
Source: JLL Research, 4Q 2020. 23Seoul Office Market
▪ CBD Grade A occupancy increased to 86.9% in
4Q 2020
CBD Grade A Rent and Occupancy
200,000 90.9% 91.3% 100%
87.7% 85.3% 86.9% 85.1% 85.1% 86.9%
83.1%
160,000 80%
120,000 60%
97,020 97,579
95,765 95,175 91,851 92,331 91,662 93,578 95,066
80,000 40%
40,000 20%
0 0%
4Q15 4Q16 4Q17 4Q18 4Q19 1Q20 2Q20 3Q20 4Q20
CBD Grade A Net Effective Rent (KRW per py pm)
CBD Grade A Occupancy (%)
Source: JLL Research, 4Q 2020. 24Committed to Delivering Stable Income & Sustainable Returns
Portfolio Optimisation
• Portfolio optimisation to improve yield, while maintaining exposure to
Singapore CBD Portfolio
• Hold quality assets across different markets for improved income stability Optimisation
and to provide more long-term growth opportunities
Asset Performance Asset
Performance
• Drive individual asset performance with proactive leasing and
cost management strategies
• Implement initiatives to future proof assets and enhance sustainability
Capital
Efficiency
Capital Efficiency
• Optimise capital structure to reduce borrowing costs and improve returns
• Manage debt maturities and hedging profiles to reduce risk
25Additional
Information
One Raffles Quay,
Singapore
26Proposed Acquisition of Keppel Bay Tower:
Grade A Waterfront Business Hub
Building Completion 2002 (Recently refurbished in 2019)
Land Tenure 99 years expiring on 30 Sep 2096
Attributable NLA 386,600 sf(1) (18-storey office tower with a six-storey podium block and basement carpark)
Committed Occupancy 98.5%(2)
WALE by NLA 3.1 years(2)
No. of Tenants 29(2)
▪ First commercial development in Singapore to be fully-powered by renewable energy
Green Credentials ▪ First commercial development in Singapore to be certified BCA(3) Green Mark Platinum (Zero Energy)
▪ ASEAN Energy Award for Energy Efficient Buildings (Retrofitted Building Category) in 2018
View of Keppel Bay, a coveted live-work-play Refurbished office lobby with modern fittings and Kloud, serviced flexible workspaces by
waterfront destination quality finishes Keppel Land
(1) Comprising 383,899 sf of office space and 2,701 sf of retail space.
(2) As at 31 Dec 2020. 27
(3) Building and Construction Authority (BCA).Proposed Acquisition of Keppel Bay Tower:
1
DPU and NPI Yield Accretive
▪ DPU and NPI yield accretive acquisition is part of ongoing portfolio optimisation efforts to enhance Keppel REIT’s
distributions and improve total unitholder returns
▪ Consistent with Keppel REIT's strategy of strengthening and diversifying its portfolio, while remaining focused on
its core markets
Pro Forma FY 2020 DPU (cents) NPI Yield (%)
5.89 (1) 4.0%
5.73
3.2%
(2) ~80bps
Pre-Acquisition Post-Acquisition Existing Singapore Portfolio Keppel Bay Tower
(1) As if the Acquisition was completed on 1 Jan 2020, the Total Acquisition Cost was funded by the draw down of the Loan Facilities (approximately 60%) and the net proceeds of the Equity Fund Raising
(approximately 40%) and inclusive of the Rental Support; (2) NPI yield is based on FY 2020 NPI and the valuation as at 31 Dec 2020 for Keppel REIT's Singapore properties. 28Proposed Acquisition of Keppel Bay Tower:
2
Diversifies Portfolio and Strengthens Tenant Base for Income Resilience
▪ Reduces Keppel REIT’s exposure to any single asset and further diversifies its income streams
▪ Post-Acquisition, Keppel REIT’s AUM will grow to $8.9 billion with Grade A commercial assets in key business
districts of Singapore, Australia and South Korea
Assets Under Management % Assets Under Management Pre-Acquisition Post-Acquisition
Ocean Financial Centre, Singapore 25.2% 23.3%
Pre-Acquisition Post-Acquisition
Marina Bay Financial Centre, Singapore 35.9% 33.2%
3.8% 3.5% One Raffles Quay, Singapore 15.1% 14.0%
Keppel Bay Tower, Singapore - 7.5%
20.0% 18.5%
8 Chifley Square, Sydney 2.8% 2.6%
As at As at Pinnacle Office Park, Sydney 3.7% 3.4%
31 Dec 2020 31 Dec 2020
8 Exhibition Street, Melbourne 3.1% 2.9%
$8.2b $8.9b
Victoria Police Centre, Melbourne 4.6% 4.3%
275 George Street, Brisbane 3.0% 2.7%
76.2% David Malcolm Justice Centre, Perth 2.8% 2.6%
78.0%
T Tower, Seoul 3.8% 3.5%
Singapore Australia South Korea
29Proposed Acquisition of Keppel Bay Tower:
2
Diversifies Portfolio and Strengthens Tenant Base for Income Resilience (Cont’d)
Keppel Bay Tower’s Tenant Mix (% of NLA)
15.3% ▪ Committed occupancy of 98.5% and WALE of
3.1 years by NLA
17.8%
8.1%
▪ Diverse mix of 29 tenants
7.1% ▪ Healthy rental collection for 4Q 2020 at
approximately 96%
1.3%
1.2% ▪ Strong tenant profile with major companies and
0.4%
multinational corporations including:
28.4% ▪ Keppel Group
20.4%
▪ Mondelez International
▪ BMW Asia
Manufacturing and distribution Energy, natural resources, shipping and marine
Real estate and property services Technology, media and telecommunications ▪ Pacific Refreshments
Banking, insurance and financial services Services
Hospitality and leisure Retail and food & beverage ▪ Syngenta
Others
As at 31 Dec 2020. 30Proposed Acquisition of Keppel Bay Tower:
2
Diversifies Portfolio and Strengthens Tenant Base for Income Resilience (Cont’d)
▪ Headquarters to the Keppel Group
▪ 39.7% of NLA on long leases to the Keppel Group entities
▪ Keppel Group becomes one of Keppel REIT's top 10 tenants by NLA
▪ Increases income diversification and reduces exposure to any one tenant sector
Portfolio Top 10 Tenants (Post-Acquisition) Portfolio Tenant Mix (Post-Acquisition)
State of Victoria 9.3%
Banking, insurance and financial services 30.1%
DBS 4.9% Technology, media and telecommunications 14.7%
Aristocrat Technologies 4.0% Government agency 14.5%
Government of Western Australia 3.9% Energy, natural resources, shipping and marine 7.5%
Keppel Group 3.7% Legal 6.5%
Real estate and property services 6.5%
Standard Chartered 3.2%
Manufacturing and distribution 6.4%
Ernst & Young 3.1%
Accounting and consultancy services 4.3%
BNP Paribas 3.0% Services 4.3%
Telstra 2.5% Retail and food & beverage 2.5%
Drew & Napier 1.9% Hospitality and leisure 0.2%
Others 2.5%
Victoria Police Centre 8 Exhibition Street Marina Bay Financial Centre
Pinnacle Office Park David Malcolm Justice Centre Keppel Bay Tower
One Raffles Quay Ocean Financial Centre 275 George Street
Based on portfolio committed NLA as at 31 Dec 2020, assuming the Property was acquired on 31 Dec 2020. 31Proposed Acquisition of Keppel Bay Tower:
2
Strong Occupancy and Well-Spread Lease Expiries
▪ Portfolio committed occupancy level remains high at 98.0%
▪ Portfolio WALE by NLA remains long at approximately 6.3 years while lease expiry remains well-spread
Portfolio Lease Expiry Profile (Post-Acquisition)
(by committed attributable NLA)
35.2%
3.8%
17.5%
2.1%
12.6% 12.5% 12.4%
1.4% 1.1% 9.4%
0.5% 10.8%
4.8%
1.1%
0.0% 0.2%0.3% 0.3%
2021 2022 2023 2024 2025 2026 and beyond
Expiring leases of Existing Portfolio Rent review leases of Existing Portfolio Keppel Bay Tower leases
Based on portfolio committed NLA as at 31 Dec 2020, assuming the Property was acquired on 31 Dec 2020. 32Proposed Acquisition of Keppel Bay Tower:
3
Strategic Expansion that Complements Core CBD Offering
▪ Expands Keppel REIT’s offering to include quality CBD-fringe office space and meet potential shifts in
occupier demand
▪ Offers more options and alternatives to tenants seeking dual locations or offices for business continuity purposes
▪ Post-Acquisition, Keppel REIT’s portfolio remains anchored by prime CBD assets while 10.9% of the AUM will
comprise non-CBD office buildings
Assets under Management by Type
Pre-Acquisition Post-Acquisition
10.9%
3.7%
As at As at
31 Dec 2020 31 Dec 2020
$8.2b $8.9b
96.3% 89.1%
CBD Non-CBD
33Proposed Acquisition of Keppel Bay Tower:
3
HarbourFront / Alexandra: A Resilient City-Fringe Submarket
▪ The city-fringe has shown resilience during the current COVID-19 pandemic with rents recording marginal decline of
approximately 1.5% over 9M 2020
▪ Demand continues to be supported by tenants who are attracted to the value proposition in this submarket
▪ Limited current Grade A office stock and tight supply are expected to sustain the growth of the HarbourFront /
Alexandra submarket
City-Fringe Gross Effective Rent(1) HarbourFront / Alexandra Absorption, Supply & Vacancy(2)
$ psf pm ‘000 sf
10.00 300 12.1% 10.9%
5.9% 4.8% 6.5%
250
8.00 200 166
142
7.23 7.23 150 116
6.00 6.95 7.16 7.12
6.65 6.71
100
35
4.00 Resilient and 50
stable rents 0
2.00 despite COVID-19 (50)
(100) -56
0.00 -107
(150)
4Q 2016 4Q 2017 4Q 2018 4Q 2019 1Q 2020 2Q 2020 3Q 2020
2016 2017 2018 2019 9M 2020
Net Absorption ('000 sq ft) Net Supply ('000 sq ft) Vacancy (%)
Source: Independent Market Research Consultant.
(1) “City-Fringe” includes HarbourFront / Alexandra, one-north and Novena; (2) Properties for this submarket include HarbourFront Centre, Alexandra Point, HarbourFront Tower One and Tower Two,
Keppel Bay Tower, PSA Building and Bank of America Merrill Lynch HarbourFront. 34Proposed Acquisition of Keppel Bay Tower:
4
Grade A Waterfront Office with Excellent Connectivity to CBD and Amenities
HarbourFront /
Alexandra Precinct
▪ Well-connected by major expressways and public
Central
transportation nodes:
Outram Business
Pasir
Park District
Panjang
Labrador
Park
Telok
Keppel Bay
Tower
▪ 10 min drive to CBD
Blangah Keppel
HarbourFront
Brani
Island
▪ 5 min walk to HarbourFront MRT and bus interchange,
Resorts
World
Sentosa accessible via a sheltered walkway
Major Expressways Sentosa
MRT Station ▪ Surrounded by wide variety of food, retail and
HarbourFront Precinct
Future MRT Station
entertainment amenities ranging from food and
Sentosa Express Line
beverage outlets on the first floor, to nearby HarbourFront
Bank of America
HarbourFront Centre, VivoCity, Keppel Island and Sentosa Island
HabourFront MRT Vivocity
(NE1 │CC29)
Keppel Bay
Tower ▪ Coveted waterfront locale with unobstructed views of
HarbourFront
Towers One & Two
HabourFront
Centre
Keppel Bay and Sentosa Island
Shopping
Mall
Source: Independent Market Research Consultant.
Note: Illustrations are not drawn to scale. 354 Proposed Acquisition of Keppel Bay Tower:
Participating in the Growth of Singapore’s Greater Southern Waterfront
▪ Strategically located in Singapore’s Gardens
By the Bay
Greater Southern Waterfront (GSW), (Bay East)
which is positioned as a destination Pasir Panjang
Terminal Keppel Bay
Central
for work, live and play Tower
Mount Business
Faber District
▪ GSW is expected to drive potential Keppel & Tanjong Pagar
Terminals
redevelopments for the
Cruise Hub & Coastal
HarbourFront / Alexandra submarket HarbourFront Brani Park at Marina South/
Island Straits View
▪ Potentially attractive to technology
Pasir Panjang
or knowledge tenants who are Power District
Sentosa
expected to be a key future driver of
office space demand Labrador
Park
Greater Southern Waterfront
Source: Independent Market Research Consultant.
Note: Illustrations are not drawn to scale. 36Proposed Acquisition of Keppel Bay Tower:
5
Augments Green Footprint via Renewable Energy and Technology Innovation
▪ Singapore’s first commercial development to be fully powered by renewable energy
▪ High-tech green building:
Facial recognition for Energy-efficient air Demand control
contactless entry distribution fresh air intake
Water-efficient cooling tower
Intelligent building control Smart lighting
water management
▪ First commercial development in Singapore to be certified as a Green Mark Platinum (Zero Energy) building
by the BCA
▪ In line with the REIT's environmental target of reducing energy usage and carbon emission
intensity levels
▪ Post-Acquisition, all of Keppel REIT’s Singapore assets would have been certified with
BCA Green Mark Platinum status
37Proposed Acquisition of Keppel Bay Tower:
6
Increases Free Float and Liquidity
Free Float and Market Capitalisation(1) ($m)
▪ Total Acquisition Cost to be funded with
net proceeds from the Equity Fund Raising(3)
4,095 and a draw down of the Loan Facilities
3,817
▪ Increases Keppel REIT’s market capitalisation by
2,216 7.3%, and improves free float and trading liquidity
1,945
(54.1%)
(50.9%) ▪ Enhances Keppel REIT’s weightage in indices and
is also a step towards further index inclusions,
potentially increasing investor demand
1,872 1,879 (2)
(49.1%) (45.9%)
As at 31 Dec 2020 Immediately after the Equity Fund Raising
and Completion
KCL's Stake Free Float
(1) Based on the closing price of $1.12 per Unit as at 31 Dec 2020; 2) Increase in KCL’s deemed interest is due to the payment of the Acquisition Fee in Units to the Manager, an indirect
wholly-owned subsidiary of KCL; (3) For illustrative purposes, assuming 242.2 million New Units will be issued based on the illustrative issue price of $1.10 per New Unit. 38Financial Performance
Improvement in distributable income for FY 2020 due mainly to:
▪ Contributions from T Tower and Victoria Police Centre, as well as lower borrowing costs
▪ Offset by the impact of the divestment of Bugis Junction Towers in Nov 2019, COVID‐19 tenant relief measures and
the cessation of rental support
2H 2020 2H 2019 +/(-) FY 2020 FY 2019 +/(-)
Distributable Income ($m)
Distributable Income Property Income(1) $94.7m $84.1m +12.6% $170.2m $164.1m +3.8%
from Operations $76.5m $66.5m +15.0% $135.5m $128.9m +5.1%
+4.2% 194.6
Net Property Income (NPI)
189.3
10.0 Less: Attributable to ($8.5m) ($8.6m) (0.9%) ($16.9m) ($16.8m) +0.6%
12.0 Non-controlling Interests
NPI Attributable to Unitholders $68.0m $57.9m +17.3% $118.6m $112.1m +5.8%
177.3 184.6 Share of Results of Associates(2) $47.7m $38.8m +23.0% $88.2m $77.9m +13.2%
Share of Results of Joint Ventures(3) $15.7m $14.2m +10.1% $29.4m $28.5m +2.9%
Distributable Income from Operations $99.8m $88.6m +12.6% $184.6m $177.3m +4.2%
FY 2019 FY 2020
Capital Gains Distribution - $6.0m N.m. $10.0m $12.0m (16.7%)
From operations
Distribution to Unitholders $99.8m $94.6m +5.5% $194.6m $189.3m +2.8%
Capital gains distribution
DPU (cents) 2.93 2.80 +4.6% 5.73 5.58 +2.7%
N.m. = Not meaningful
(1) Property income relates to income from directly-held properties including Ocean Financial Centre, 50% interest in 275 George Street, 50% interest in 8 Exhibition Street office building
and 100% interest in the three adjacent retail units, T Tower after it was acquired on 27 May 2019, Bugis Junction Towers before it was divested on 29 Nov 2019 and Victoria Police Centre
after it achieved practical completion on 9 Jul 2020. 39
(2) Share of results of associates relates to Keppel REIT’s one-third interests in One Raffles Quay and Marina Bay Financial Centre.
(3) Share of results of joint ventures relates to Keppel REIT’s 50% interests in 8 Chifley Square and David Malcolm Justice Centre.Balance Sheet
As at 31 Dec 2020 As at 31 Dec 2019 +/(-)
Deposited Property(1) $8,389m $8,032m +4.4%
Total Assets $7,764m $7,449m +4.2%
Borrowings(2) $3,130m $2,879m +8.7%
Total Liabilities $2,544m $2,286m +11.3%
Unitholders’ Funds $4,498m $4,585m (1.9%)
Adjusted NAV per Unit(3) $1.29 $1.35 (4.4%)
(1) Included interests in associates and joint ventures.
(2) Included borrowings accounted for at the level of associates and excluded the unamortised portion of upfront fees in relation to the borrowings. 40
(3) For 31 Dec 2020 and 31 Dec 2019, these excluded the distributions to be paid in Mar 2021 and paid in Feb 2020 respectively.Prudent Capital Management
▪ All-in interest rate reduced year-on-year to 2.35% p.a. from 2.77% p.a.
▪ Strengthened sustainability-focused funding with additional A$300m of green loans
▪ Issued $300m(1) of 3.15% perpetual securities to refinance 4.98% perpetual securities(2) and increase
financial flexibility
Debt Maturity Profile (As at 31 Dec 2020) As at 31 Dec 2020
36% Interest Coverage Ratio(3) 3.4x
$200m All-in Interest Rate 2.35% p.a.
$75m 25%
21% Aggregate Leverage 37.3%
Weighted Average Term to Maturity 3.2 years
9% $839m $775m
$50m $652m
5% 4% Borrowings on Fixed Rates 74%
$249m $137m
$153m
Unencumbered Assets 73%
2021 2022 2023 2024 2025 2026
Bank loans $50m 7-year MTN at 3.15% $835m
Undrawn Credit Facilities
(Issued in Feb 2015) ($367m committed)
$75m 7-year MTN at 3.275% $200m 5-year convertible bonds at 1.9%
(Issued in Apr 2017) (Issued in Apr 2019)
(1) $150m of perpetual securities was issued on 11 Sep 2020 while another $150m of perpetual securities was issued on 7 Oct 2020.
(2) $150m of 4.98% perpetual securities was redeemed on 2 Nov 2020.
(3) Computed as trailing 12 months EBITDA (excluding effects of any fair value changes of derivatives and investment properties, and foreign exchange translation),
over trailing 12 months interest expense, borrowing-related fees and distributions on hybrid securities, as defined in the Code on Collective Investment Schemes 41
revised by the MAS on 16 Apr 2020.Attributable NPI by Property
FY 2020 FY 2019
Breakdown of Attributable NPI % %
$’000 $’000
by Geography
(For FY 2020) Ocean Financial Centre 66,979 23.7 66,691 24.1
Marina Bay Financial Centre 95,746 33.9 101,622(4) 35.7
71.4% One Raffles Quay 39,062 13.8 37,518 13.5
Bugis Junction Towers(1) - - 14,371 5.2
8 Chifley Square 12,647 4.5 12,685 4.6
8 Exhibition Street 11,537 4.1 11,825 4.3
23.8%
Victoria Police Centre(2) 17,039 6.0 - -
275 George Street 9,440 3.3 11,019 4.0
4.8%
Singapore Australia South Korea
David Malcolm Justice Centre 16,720 5.9 15,875 5.7
T Tower(3) 13,550 4.8 8,165 2.9
Total 282,720 100.0 279,771 100.0
(1) Divested on 29 Nov 2019.
(2) Achieved practical completion on 9 Jul 2020. 42
(3) Acquired on 27 May 2019.
(4) Includes rental support of $2.7m for Marina Bay Financial Centre Tower 3.Portfolio Valuation
▪ Singapore portfolio valuation was 1.5% lower year-on-year due mainly to potential occupancy changes and lower rents in
view of the COVID-19 pandemic and economic recession
Valuation based Variance
31 Dec 31 Dec 31 Dec Cap
on attributable
2019 2020 2020 Rate
interest S$ %
Ocean Financial Marina Bay One Raffles Ocean Financial
S$2,950 Financial Centre Quay Centre
Centre S$2,099.8m S$2,066.2m (S$33.6m) (1.6) 3.50%
(79.9% interest)
psf
Towers 1 & 2,
S$2,878
Marina Bay and MBLM(1): S$1,665.0m (S$30.3m) (1.8) 3.45%(2)
psf
Financial Centre S$1,695.3m
(33.3% interest)
Tower 3: S$2,867
S$1,277.3m (S$19.7m) (1.5) 3.63%
S$1,297.0m psf
One Raffles
S$2,809
Quay S$1,254.3m S$1,240.0m (S$14.3m) (1.1) 3.45%
(33.3% interest)
psf
Singapore
S$6,346.4m S$6,248.5m (S$97.9m) (1.5)
Portfolio
(1) Refers to Marina Bay Link Mall.
(2) Refers to MBFC Towers 1 and 2.
43Portfolio Valuation (Cont’d)
▪ Australian building valuations, excluding David Malcolm Justice Centre, Victoria Police Centre and Pinnacle Office Park, declined by 2.0-2.3%
due to potential occupancy changes at 8 Chifley Square, as well as cap rate expansion at 8 Exhibition Street and 275 George Street
▪ Valuation of T Tower in Seoul increased 0.5% due to cap rate compression
Local currency S$
Valuation based on
Variance Variance 31 Dec 2020 Cap Rate
Keppel REIT’s interest 31 Dec 2019 31 Dec 2020 31 Dec 2019 31 Dec 2020
A$ % S$
8 Chifley Square(1) A$24,258
A$240.0m A$234.5m (A$5.5m) (2.3) S$222.2m S$231.5m S$9.3m 4.63%
(50% interest) psm
Pinnacle Office Park(1) A$8,711
- A$306.1m A$306.1m n.a. - S$302.1m S$302.1m 5.25%
(100% interest) psm
8 Exhibition Street(1,2) A$11,366
A$265.3m A$259.5m (A$5.8m) (2.2) S$245.6m S$256.2m S$10.6m 5.13%(3)
(50% interest) psm
Victoria Police Centre(1) A$11,379
A$349.5m(4) A$385.0m A$35.5m +10.2 S$323.5m(4) S$380.0m S$56.5m 4.50%
(50% interest) psm
275 George Street(1) A$11,745
A$250.0m A$245.0m (A$5.0m) (2.0) S$231.4m S$241.8m S$10.4m 5.25%
(50% interest) psm
David Malcolm Justice Centre(1) A$14,916
A$232.5m A$232.5m - - S$215.2m S$229.5m S$14.3m 5.38%
(50% interest) psm
Australia Portfolio A$1,337.3m A$1,662.6m A$325.3m +24.3 S$1,237.9m S$1,641.1m S$403.2m
T Tower(5) KRW
KRW 259.0b KRW 260.2b KRW 1.2b +0.5 S$299.9m S$314.3m S$14.4m 4.25%
(99.4% interest) 20.8m/py
Total Portfolio S$7,884.2m S$8,203.9m S$319.7m
(1) Based on the exchange rates of A$1=S$0.9257 as at 31 Dec 2019 and (4) Valuation was on a “as-is” basis.
A$1=S$0.9871 as at 31 Dec 2020. (5) Based on the exchange rate of KRW 1,000 = $1.158 as at 31 Dec 2019 and 44
(2) Includes 100% interest in the three adjacent retail units. KRW 1,000 = S$1.208 as at 31 Dec 2020.
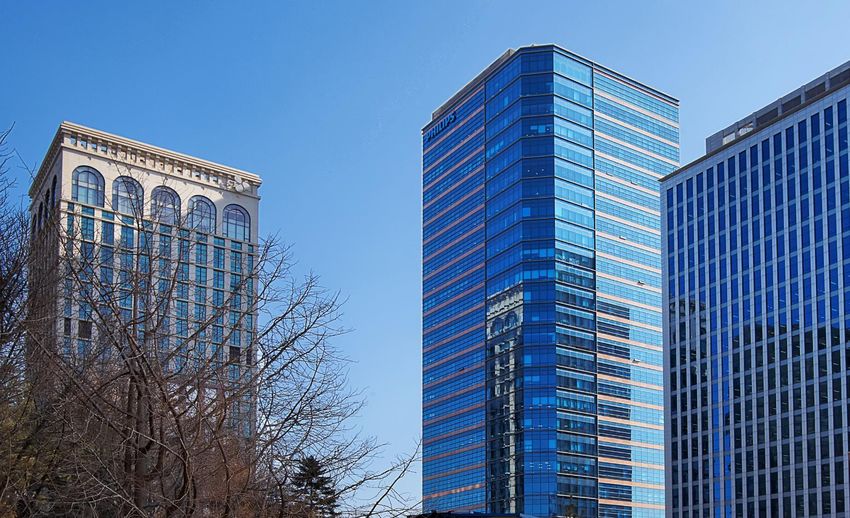
(3) Refers to Keppel REIT’s 50% interest in the office building.Portfolio Information: Singapore
As at Marina Bay
Ocean Financial Centre One Raffles Quay
31 Dec 2020 Financial Centre(4)
Attributable
700,504 sf 1,024,065 sf 441,475 sf
NLA
Ownership 79.9% 33.3% 33.3%
DBS Bank,
BNP Paribas, Deutsche Bank,
Principal Standard Chartered
ANZ, Ernst & Young,
tenants(1) Bank,
Drew & Napier Capital International
Barclays
99 years expiring
99 years expiring 99 years expiring
Tenure 10 Oct 2104(5) and
13 Dec 2110 12 Jun 2100
7 Mar 2106(6)
Purchase Price S$1,426.8m(5)
S$1,838.6m(3) S$941.5m
(on acquisition) S$1,248.0m(6)
S$1,665.0m(5)
Valuation(2) S$2,066.2m S$1,240.0m
S$1,277.3m(6)
Capitalisation 3.45%(7); 4.25%(8);
3.50% 3.45%
rates 3.63%(6)
1) On committed gross rent basis.
2) Valuation as at 31 Dec 2020 based on Keppel REIT’s interest in the respective properties.
3) Based on Keppel REIT’s 79.9% of the historical purchase price.
4) Comprises Marina Bay Financial Centre (MBFC) Towers 1, 2 and 3 and Marina Bay Link Mall (MBLM).
5) Refers to MBFC Towers 1 and 2 and MBLM.
6) Refers to MBFC Tower 3.
7) Refers to MBFC Towers 1 and 2.
8) Refers to MBLM. 45Portfolio Information: Australia & South Korea
As at 8 Exhibition Victoria Police David Malcolm
8 Chifley Square, 275 George Pinnacle Office T Tower,
31 Dec 2020 Street(3), Centre, Justice Centre,
Sydney Street, Brisbane Park, Sydney Seoul
Melbourne Melbourne Perth
Attributable
104,055 sf 244,659 sf 364,180 sf 224,537 sf 167,784 sf 378,164 sf 226,949 sf
NLA
Ownership 50.0% 50.0% 50.0% 50.0% 50.0% 100.0% 99.4%
Telstra, Minister for Aristocrat
Corrs Chambers Ernst & Young, Hankook
Minister for Queensland Gas Works - Technologies,
Principal Westgarth, Amazon, Minister Corporation, SK
Company, Government of
tenants(1) Quantium, for Finance - Finance - State of Konica Minolta,
Communications,
Victoria The State of Western Coles
QBE Insurance State of Victoria Philips Korea
Queensland(7) Australia Supermarkets
99 years expiring 99 years expiring
Tenure Freehold Freehold Freehold Freehold Freehold
5 Apr 2105 30 Aug 2114
Purchase Price A$165.0m A$168.8m A$347.8m A$166.0m A$165.0m A$306.0m KRW252.6b
(on acquisition) S$197.8m S$201.3m(3) S$362.4m(6) S$209.4m S$208.1m S$303.3m(8) S$292.0m(9)
A$234.5m A$259.5m A$385.0m A$245.0m A$232.5m A$306.1m KRW260.1b
Valuation(2)
S$231.5m S$256.2m(3) S$380.0m S$241.8m S$229.5m S$302.1m S$314.3m
Capitalisation
4.63% 5.13%(4); 4.50%(5) 4.50% 5.25% 5.38% 5.25% 4.25%
rates
1) On committed gross rent basis. 6) Based on the aggregate consideration paid-to-date and to be paid, including development costs
2) Valuation as at 31 Dec 2020 based on Keppel REIT’s interest in the respective properties and of the building, at the exchange rate of A$1=S$1.042 as disclosed in the announcement dated
on the exchange rates of A$1 = S$0.9871 and KRW 1,000 = S$1.208. 29 Jun 2017.
3) Keppel REIT owns a 50% interest in the 8 Exhibition Street office building and a 100% interest in 7) Refers to the Department of Housing and Public Works – The State of Queensland.
the three adjacent retail units. 8) Based on an exchange rate of A$1 = S$0.9912 as at 9 Sep 2020.
4) Refers to Keppel REIT’s 50% interest in the office building. 9) Based on Keppel REIT’s interest in T Tower and an exchange rate of KRW 1,000 = S$1.156
5) Refers to Keppel REIT’s 100% interest in the three adjacent retail units. used for payment.
46Growth Since Listing in 2006
Expanded footprint to Australia: Expanded footprint
77 King Street (100%), Sydney, and to South Korea:
275 George Street (50%), Brisbane T Tower (99.4%), Seoul
Listed on SGX
>$600m AUM
4 assets in Acquired Acquired Acquired Acquired Acquired
Singapore - 8 Chifley Square (50%), - David Malcolm Justice three retail units at 311 Spencer Street Pinnacle Office
Sydney Centre (50%), Perth 8 Exhibition Street, development (50%), Park (100%),
- Ocean Financial Centre - 8 Exhibition Street (50%), Melbourne Melbourne Sydney
(87.5%), Singapore Melbourne
2018
2019 2020
2016
2017
2013
2014
2015
$8.2b(1) AUM
2006 2011
2012 10 assets in Singapore,
2010
2007
2009 Australia & South Korea
Acquired Increased Asset swap: Increased stake Divested Divested Divested Divested
One Raffles stake in Keppel Towers and in Ocean Financial Prudential Tower, 77 King Street, 20% minority stake Bugis Junction
Quay (33.3%), Prudential GE Tower for Centre (to 99.9%), Singapore Sydney in Ocean Financial Towers, Singapore
Singapore Towers, MBFC Towers 1 & 2 Singapore Centre (to 79.9%),
Acquired
Singapore and MBLM (33.3%), Singapore
MBFC Tower 3 (33.3%),
Singapore
Singapore
1) Based on assets under management as at 31 Dec 2020, excluding the proposed acquisition of Keppel Bay Tower which was announced
47
on 23 Dec 2020, pending Unitholders approval in 1Q 2021 and targeted for completion in 2Q 2021.Keppel REIT Structure
Keppel Capital Keppel Land
Institutional and
The REIT Manager can leverage
The REIT Manager can leverage Public Investors
the Sponsor‘s expertise and
the scale and resources of a larger 50.9%
asset management platform
5.8% track record in this industry
43.3%
100%
Management Acting on behalf of
services Unitholders
REIT Manager Trustee
Trustee’s
Management fees Keppel REIT fees
Keppel REIT RBC Investor Services Trust
Management Limited Singapore Limited
Ownership of Income
assets contribution
Property
management
services
Property Managers Properties
Property
management fees
Note: As of 31 Dec 2020. 48Thank You
For more information, please visit:
www.keppelreit.com
Connect with us on:
T Tower,
Seoul
49You can also read