1Q 2017 Results Presentation 26 April 2017 - CDL Hospitality ...
←
→
Page content transcription
If your browser does not render page correctly, please read the page content below
1Q 2017 Results Presentation
26 April 2017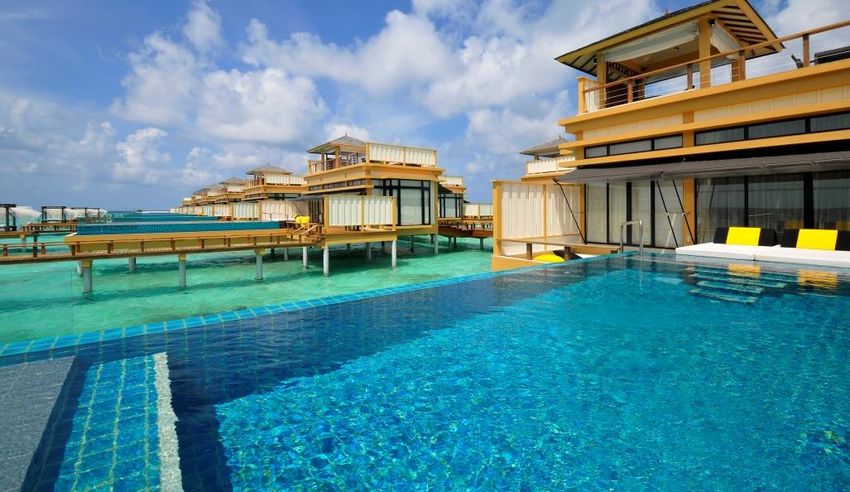
Important Notice

This document may contain forward-looking statements that involve assumptions, risks and uncertainties. Actual future performance, outcomes and
results may differ materially from those expressed in forward-looking statements as a result of a number of risks, uncertainties and assumptions.
Representative examples of these factors include (without limitation) general industry and economic conditions, interest rate trends, cost of capital
and capital availability, competition from other developments or companies, shifts in expected levels of occupancy rate, property rental income,
charge out collections, changes in operating expenses (including employee wages, benefits and training costs), governmental and public policy
changes and the continued availability of financing in the amounts and the terms necessary to support future business. Predictions, projections or
forecasts of the economy or economic trends of the markets are not necessarily indicative of the future or likely performance of CDL Hospitality
Trusts.
The value of Stapled Securities and the income derived from them may fall as well as rise. Stapled Securities are not obligations of, deposits in, or
guaranteed by M&C REIT Management Limited, as manager of CDL Hospitality Real Estate Investment Trust (the “H-REIT Manager”) or M&C
Business Trust Management Limited, as trustee-manager of CDL Hospitality Business Trust (the “HBT Trustee-Manager”), or any of their
respective affiliates.
An investment in Stapled Securities is subject to investment risks, including the possible loss of the principal amount invested. Investors have no
right to request that the H-REIT Manager and/or the HBT Trustee-Manager redeem or purchase their Stapled Securities while the Stapled
Securities are listed. It is intended that holders of the Stapled Securities may only deal in their Stapled Securities through trading on Singapore
Exchange Securities Trading Limited (the “SGX-ST”). Listing of the Stapled Securities on the SGX-ST does not guarantee a liquid market for the
Stapled Securities.
This presentation contains certain tables and other statistical analyses (the “Statistical Information") which have been prepared by the H-REIT
Manager and the HBT Trustee-Manager. Numerous assumptions were used in preparing the Statistical Information, which may or may not be
reflected herein. As such, no assurance can be given as to the Statistical Information’s accuracy, appropriateness or completeness in any particular
context, nor as to whether the Statistical Information and/or the assumptions upon which they are based reflect present market conditions or future
market performance. The Statistical Information should not be construed as either projections or predictions or as legal, tax, financial or accounting
advice.
Market data and certain industry forecasts used throughout this presentation were obtained from internal surveys, market research, publicly
available information and industry publications. Industry publications generally state that the information that they contain has been obtained from
sources believed to be reliable but that the accuracy and completeness of that information is not guaranteed. Similarly, internal surveys, industry
forecasts and market research, while believed to be reliable, have not been independently verified by the H-REIT Manager or the HBT Trustee-
Manager and neither the H-REIT Manager nor the HBT Trustee-Manager makes any representations as to the accuracy or completeness of such
information.
You are cautioned not to place undue reliance on these forward-looking statements, which are based on the current view of the H-REIT Manager or
the HBT Trustee-Manager on future events.
This document and its contents shall not be disclosed without the prior written permission of the H-REIT Manager or the HBT Trustee-Manager.
                                                                                                                                                         2
About CDL Hospitality Trusts

CDL Hospitality Trusts (“CDLHT”) is one of Asia’s leading hospitality trusts with assets valued at S$2.4 billion.
CDLHT is a stapled group comprising CDL Hospitality Real Estate Investment Trust (“H-REIT”), a real estate
investment trust, and CDL Hospitality Business Trust (“HBT”), a business trust. CDLHT was listed on the
Singapore Exchange Securities Trading Limited on 19 July 2006. M&C REIT Management Limited is the
manager of H-REIT, the first hotel real estate investment trust in Singapore, and M&C Business Trust
Management Limited is the trustee-manager of HBT.

CDLHT was established with the principal investment strategy of investing in a portfolio of hospitality and/or
hospitality-related real estate assets. As at 31 March 2017, CDLHT owns 15 hotels and two resorts comprising a
total of 4,912 rooms as well as a retail mall. The properties under CDLHT’s portfolio are:

i.     six hotels in the gateway city of Singapore comprising Orchard Hotel, Grand Copthorne Waterfront Hotel, M
       Hotel, Copthorne King’s Hotel, Novotel Singapore Clarke Quay and Studio M Hotel (collectively, the
       “Singapore Hotels”) as well as a retail mall adjoining Orchard Hotel (Claymore Connect);
ii.    five hotels in Brisbane and Perth, Australia comprising Novotel Brisbane, Mercure Brisbane, Ibis Brisbane,
       Mercure Perth and Ibis Perth (collectively, the “Australia Hotels”);
iii.   two hotels in Japan’s gateway city of Tokyo, comprising Hotel MyStays Asakusabashi and Hotel MyStays
       Kamata (collectively, the “Japan Hotels”);
iv.    one hotel in New Zealand’s gateway city of Auckland, namely Grand Millennium Auckland (formerly known
       as Rendezvous Hotel Auckland)(the “New Zealand Hotel”);
v.     one hotel in Cambridge, United Kingdom, namely Hilton Cambridge City Centre (the “UK Hotel”); and
vi.    two resorts in Maldives, comprising Angsana Velavaru and Jumeirah Dhevanafushi (collectively, the
       “Maldives Resorts”).

                                                                                                                    3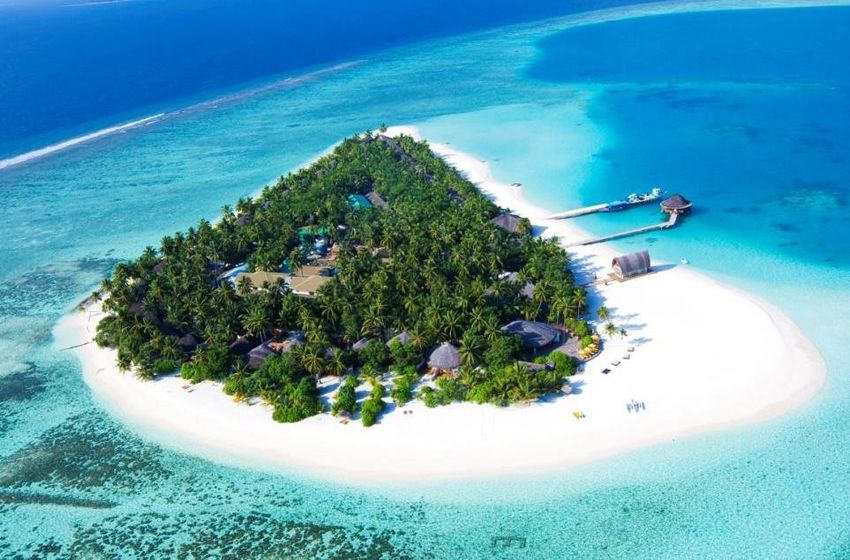
References Used in this Presentation

        1Q, 2Q, 3Q, 4Q refers to the period 1 January to 31 March, 1 April to 30 June, 1 July to 30 September and 1 October to 31 December
        respectively
        ARR refers to average room rate
        AUD refers to Australian dollar
        DPS refers to distribution per Stapled Security
        FY refers to financial year for the period from 1 January to 31 December
        GBP refers to British pound
        JPY refers to Japanese yen
        MTN refers to Medium Term Notes
        NPI refers to net property income
        NZD refers to New Zealand dollar
        pp refers to percentage points
        RCF refers to revolving credit facility
        RevPAR refers to revenue per available room
        SGD refers to Singapore dollar
        USD refers to US dollar
        YoY refers to year-on-year
        YTD refers to year-to-date
        All values are expressed in Singapore dollar unless otherwise stated

Note: Due to rounding, numbers presented throughout this document may not add up precisely to the totals provided and percentages may not precisely reflect the absolute figures   4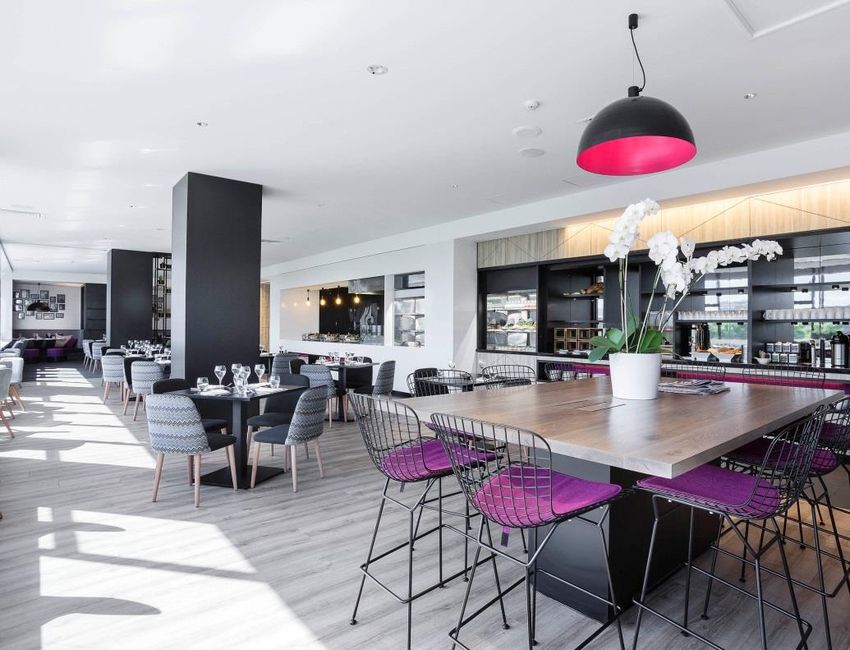
Table of Contents
Results Highlights

                     6
Portfolio Summary

                    8
Healthy Financial Position 12
Singapore Market 17
Maldives Market 25
Japan Market 28
United Kingdom Market 32
Australia Market 35
New Zealand Market 37
Asset Enhancement Plans 42
Annexe 47
Background and Structure of CDL Hospitality Trusts 47
Location of CDL Hospitality Trusts Properties 61
5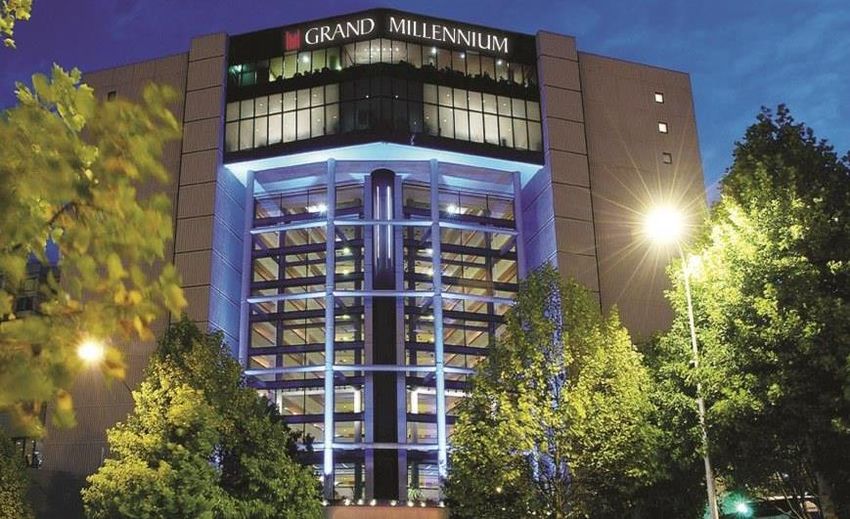
Results Highlights
6
Results Highlights (1Q 2017)
Net Property Income Total distribution (after retention) DPS (1)
6.4% YoY 10.0% YoY 9.0% YoY
S$ million S$ million S$ cents
40.0 33.7 35.9 30.0 3.00
24.1 2.22 2.42
25.0 21.9 2.50
30.0
20.0 2.00
20.0 15.0 1.50
10.0 1.00
10.0
5.0 0.50
0.0 0.0 0.00
1Q 2016 1Q 2017 1Q 2016 1Q 2017 1Q 2016 1Q 2017
Higher contribution from New Zealand Total distribution in 1Q 2017 increased by 10.0% yoy as a result of growth in
Hotel mainly due to higher variable rental overall portfolio NPI
income driven by stronger performance
Income from the Japan Hotels in 1Q 2017 are only available for distribution in 2Q
Competitive trading conditions in Japan 2017 once the financial results for the fiscal period (1 Oct 2016 to 31 Mar 2017)
and Maldives markets are audited (2)
Decline in variable rent from Australia Net finance costs for 1Q 2017 increased by S$4.7 million to S$11.0 million mainly
Hotels due to foreign exchange loss from the repayment of a NZD denominated
intercompany loan, which has no impact on the distribution of CDLHT
(1) Represents total distribution per Stapled Security (after retention). Total distribution per Stapled Security (before retention) for 1Q 2017 is 2.69 cents
(2) Contribution from Japan Hotels for 1Q 2017 is not included in the distribution as there is a time lag between the distribution being made and the completion of audit and tax filing 7
Portfolio Summary
8
NPI Performance by Country

                      1Q 2017   1Q 2016   Change
                                                           YoY Change
                       S$’000    S$’000   S$’000

Singapore              20,888    20,579             309            1.5%

Australia               3,653     3,848             -195           -5.1%

New Zealand             5,422     2,851            2,571          90.2%

Maldives                3,360     3,662             -302           -8.2%

Japan                   1,274     1,466             -192          -13.1%

United Kingdom          1,275     1,304              -29           -2.2%

Total                  35,872    33,710            2,162           6.4%

                                                                           9
Portfolio Breakdown (Valuation)

                                 Breakdown of Portfolio Valuation as at 31 December 2016 (1)

 Singapore                                     69.1%                         Australia                      8.9%
 Orchard Hotel                                 17.4%                         Novotel Brisbane               2.9%
 Grand Copthorne                               14.3%                         Mercure & Ibis Brisbane        2.7%
 Waterfront Hotel                                                            Mercure Perth                  2.0%
 Novotel Singapore Clarke                      13.1%                         Ibis Perth                     1.4%
 Quay
 M Hotel                                       9.6%                          New Zealand                    7.3%
 Studio M Hotel                                6.3%                          Grand Millennium Auckland      7.3%
 Copthorne King’s Hotel                        4.8%                          Maldives                       6.9%
 Claymore Connect                              3.7%                          Angsana Velavaru               3.9%
                                                                             Jumeirah Dhevanafushi          2.9%

                                                       Portfolio Valuation   United Kingdom                 4.5%
                                                          S$2.4 billion      Hilton Cambridge City Centre   4.5%

                                                                             Japan                          3.3%
                                                                             MyStays Asakusabashi           1.9%
                                                                             MyStays Kamata                 1.4%

(1)   Numbers may not add up due to rounding                                                                       10
Portfolio Breakdown (NPI)
Breakdown of Portfolio NPI by Country for 1Q 2016 and 1Q 2017(1)
1Q 2016 NPI – S$33.7 million 1Q 2017 NPI – S$35.9 million
Australia
Australia 10.2%
Singapore 11.4%
61.0% Singapore
58.2%
New New
Zealand Zealand
8.5% 15.1%
Maldives
10.9%
Maldives
9.4%
United
Kingdom United
3.9% Kingdom
3.6%
Japan 4.3% Japan 3.6%
(1) Numbers may not add up due to rounding 11Healthy Financial Position
12Healthy Balance Sheet
Key Financial Indicators
As at 31 Mar 2017 As at 31 Dec 2016
Debt Value (1) S$924 million S$933 million
Total Assets S$2,510 million S$2,535 million
Gearing 36.8% 36.8%
Interest Coverage Ratio (2) 6.5x 6.2x
Regulatory Debt Headroom at 45% S$374 million S$379 million
Weighted Average Cost of Debt 2.4% 2.5%
Net Asset Value per Stapled Security S$1.5298 S$1.5513
Fitch Issuer Default Rating BBB- BBB-
(1) Debt value is defined as medium term notes, bank borrowings and the TMK Bond which are presented before the deduction of unamortised transaction costs
(2) CDLHT’s interest cover is computed using 1Q 2017 and FY 2016 net property income divided by the total interest paid/ payable in 1Q 2017 and FY 2016 respectively 13Debt Facility Details
Borrowings
Multi-Currency MTN Programme
S$1.0 billion
MTN
Issued: S$120.0 million (5-year fixed)
Unutilised: S$880.0 million
3-year to 3.25-year Committed Multi-Currency RCF
S$250.0 million
RCF
Utilised: S$159.8 million
Unutilised: S$90.2 million
Multi-Currency
Term Loans
Bridge Facility
S$605.2 million
S$300.0 million
Bridge US$75.0 million US$65.0 million
Facility and S$70.0 million S$83.6 million
(S$104.7 million) (S$90.8 million)
Term Loans Tenure: 5-year Tenure: 5-year Uncommitted
Tenure: 5-year Tenure: 5-year
facility
£66.5 million A$93.2 million ¥3.3 billion Not utilised
(S$115.2 million) (S$99.7 million) (S$41.4 million)
Tenure: 5-year Tenure: 5-year Tenure: 5-year
TMK ¥3.1 billion (S$39.0 million)
Bond Tenure: 5-year
14Debt Profile as at 31 March 2017
Debt Maturity Profile (1) (2)
S$ million
Currency Amount Type Expiry
400 Weighted Average Debt to Maturity ~ 2.7 years (a) SGD S$120.0M Fixed MTN Jun 2018
350 325 (b) USD S$104.7M Fixed Term Loan Oct 2018
300 (c) SGD S$100.0M Floating RCF Dec 2018
105 (b)
250 (d) SGD S$59.8M (3) Floating RCF Mar 2019
221
199
(e) SGD S$70.0M Fixed Term Loan Aug 2019
200 180
91 (f)
(f) USD S$90.8M Fixed Term Loan Dec 2019
150
115 (j)
(c) 100 (h)
220 (a) Fixed Term Loan and
100 (g) JPY S$80.1M Sep 2020
TMK Bond
(e)
130 (d)
50 84 (h) AUD S$99.7M Fixed Term Loan Dec 2020
80 (g) (i)
0
0 (i) SGD S$83.6M Floating Term Loan Aug 2021
2017 2018 2019 2020 2021
(j) GBP S$115.2M Floating Term Loan Aug 2021
SGD USD GBP JPY AUD
(1) Numbers may not add up due to rounding
(2) Based on exchange rates of A$1 = S$1.0698, US$1 = S$1.3966, £1 = S$1.7328 and S$1 = ¥79.5545
(3) The multi-currency RCF includes a small amount of USD borrowings 15Debt Profile as at 31 March 2017
Prudent capital management with fixed rate borrowings comprising 61.2% of total borrowings as at 31
March 2017
Debt Currency Profile (1)(2) Interest Rate Profile as at 31 Mar 2017 (1)(2)
Fixed Rate Floating Rate
JPY Borrowings Borrowings
8.7%
SGD 43.8% 56.2%
AUD
10.8%
USD 100.0% -
SGD
GBP 46.9% GBP - 100.0%
12.5%
AUD 100.0% -
JPY 100.0% -
USD
21.2%
Blended Total 61.2% 38.8%
(1) Numbers may not add up due to rounding
(2) Based on exchange rates of A$1 = S$1.0698, US$1 = S$1.3966, £1 = S$1.7328 and S$1 = ¥79.5545 16Singapore Market
17CDLHT Singapore Properties Performance
CDLHT Singapore Hotels 1Q ’17 1Q ’16 YoY Change
Occupancy 88.4% 83.9% 4.5pp
ARR S$180 S$191 -5.9%
RevPAR S$159 S$161 -0.8%
Despite absence of biennial Singapore
Airshow event, occupancy improved
during the quarter and RevPAR remained
largely stable
Competitive trading environment due to:
− Subdued corporate activity as a result
of continued global economic
uncertainty, in particular, the Offshore &
Marine and Financial sectors
− Pricing competition stemming from new
hotel supply
As at 31 Mar 2017, committed occupancy
of Claymore Connect was 90% Grissini, GCW
18Visitor Arrivals Up 3.4% and Visitor Days Up 2.0%
For 2017, STB estimates moderate growth in visitor arrivals of up to 2% to 16.7 million (1)
For YTD Feb 2017, visitor arrivals grew 3.4% yoy due to growth in the top source market, China
A S$34 million investment was recently announced by STB, SIA and Changi Airport Group strengthen
Singapore’s destination appeal and woo business and MICE visitors (2)
International Visitor Arrivals to Singapore (3)
Million 10-year CAGR = 5.3%
16.4 to
18.0 16.4 16.7 (1)
15.6 15.1 15.2
16.0 14.5
14.0 13.2
11.6
12.0 10.3
9.8 10.1 9.7
10.0
8.0
6.0
4.0 2.7 2.8
2.0
0.0
2006 2007 2008 2009 2010 2011 2012 2013 2014 2015 2016 2017
IPO Sub-Prime
Full Year Visitor Arrivals STB Forecast Arrivals YTD Feb Visitor Arrivals
(1) STB, “Singapore Achieves Record Tourism Sector Performance in 2016”, 14 Feb 2017
(2) STB, “$34m three-year tripartite partnership to strengthen Singapore’s destination appeal and drive visitor traffic”, 17 Apr 2017
(3) STB 19Geographical Mix of Top Markets (Singapore)
For YTD Feb 2017, visitor arrivals increased mainly on the back of growth in Chinese arrivals (+15.5%),
Singapore’s top source market
Overall, 6 of the top 10 source markets recorded YoY growth
Geographical Mix of Visitor Arrivals Top 10 Inbound Markets
For YTD Feb 2017 (1) YoY Change for YTD Feb 2017 (1) (2)
Others China China 15.5%
26% 21%
USA 10.2%
India 6.8%
Philippines 6.3%
Philippines Australia 4.7%
3% Indonesia UK 4.1%
UK 16%
-0.6% Indonesia
4%
USA -1.5% Japan
4% Australia
7% -2.1% Malaysia
South Korea Malaysia
4% Japan India -8.6% South Korea
6%
4% 5% -15.0% 0.0% 15.0% 30.0%
(1) Based on STB’s statistics published on 13 Apr 2017
(2) The top 10 inbound markets are ranked according to growth rates in descending order 20Singapore – A Leading MICE Destination
Singapore has retained its spot as the top international meeting city for the ninth year running (1)
Its attractiveness is due to the country’s excellent infrastructure, security, as well as its leading hub status in Asia
As a high yield segment, MICE remains STB’s key pillar of growth
It is growing its status as a leading MICE destination with prominent events being added to its calendar
Marquee Events Biennial Events
New Events / Exhibitions / Conferences
Launched by ASEAN to raise
These technology and events are held in Designated South East tourist arrivals by 10% to the
Singapore and Southeast Asia for the first time Asia host for next 4 years region to 121 million (2)
(1) Travel Biz, “Singapore crowned Top International Meeting City by UIA”, 30 Sep 2016
(2) Channel NewsAsia, “ASEAN can work together to increase tourism numbers, says PM Lee”, 18 Jan 2017 21World-Class Infrastructure and Attractions
Changi Airport Terminal 4 and Project Jewel National Gallery Singapore Sports Hub
Singapore Botanic Gardens - UNESCO World Heritage Site Transformation of Orchard Road precinct Makeover of Mandai nature precinct – Artist's
impression of the Rainforest Walk
Image Credits: Changi Airport Group, W-Architects, National Gallery, STB, Mandai Park Holdings 22Singapore Hotel Room Supply
According to STB, an estimated 2,942 rooms were added in 2016, representing a 4.8% increase over 2015
Operating environment is expected to be competitive with close to 3,800 rooms (1) opening in 2017
New room supply is expected to gradually taper off from 2018
New room supply is forecast to grow at a CAGR of 2.7% between 2016 and 2019
Current and Expected Hotel Room Supply in Singapore (1)
No. of Hotel Rooms
3-year CAGR = 2.7%
75,000
69 1,462
70,000 3,767 2.2% 69,148
5.9% 0.1%
63,850 67,617 67,686
65,000
63,850
60,000
55,000
50,000
End-2016 2017 2018 2019 End-2019
Hotel Supply as at End-2016 Estimated Future Hotel Supply Estimated Hotel Supply by End-2019
(1) New supply of rooms is a summation of new rooms deducted by existing rooms taken out of inventory for redevelopment
Sources: STB, Horwath HTL (as at Jan 2017) and CDLHT research 23Potential Supply of New Singapore Hotel Rooms
Until 2019
No. of Horwath Expected No. of Horwath Expected
Name of Hotel Location Name of Hotel Location
Rms Rating Opening Rms Rating Opening
Outside City
Villa Samadhi 20 Upscale/Luxury Opened Dusit Thani Hotel & Resort 197 Upscale/Luxury Outside City Centre 1H 2017
Centre
The Ascott Orchard Singapore* 110 Upscale/Luxury City Centre Opened
Andaz Singapore (DUO Project) 342 Upscale/Luxury City Centre 3Q 2017
Outside City
Aqueen Hotel Little India 83 Economy 2Q 2017
Centre Duxton Terrace (Murray House) 138 Upscale/Luxury City Centre 4Q 2017
Novotel Singapore on Stevens 254 Upscale/Luxury City Centre 2Q 2017
Duxton House (Blakes / formerly
InterContinental Singapore 50 Upscale/Luxury City Centre 4Q 2017
Duxton Hotel)
Robertson Quay (formerly Gallery 225 Upscale/Luxury City Centre 2Q 2017
Hotel)
Grand Park City Hall** 181 Mid-Tier City Centre 4Q 2017
Sofitel Singapore City Centre
222 Upscale/Luxury City Centre 2Q 2017
(Tanjong Pagar Centre) Aqueen Hotel Geylang 100 Economy Outside City Centre 2H 2017
The Patina Capitol Singapore 157 Upscale/Luxury City Centre 2Q 2017
Aqueen Hotel Lavender
Ibis Singapore on Stevens 528 Mid-Tier City Centre 2Q 2017 69 Economy Outside City Centre 2018
(Additional Rooms)
Premier Inn Singapore -300 Economy City Centre 2Q 2017
The Outpost @ Sentosa 230 Upscale/Luxury Sentosa 2019
Destination Singapore Beach
300 Mid-Tier City Centre 2Q 2017
Road (fmr Premier Inn) Village Hotel Sentosa 620 Economy Sentosa 2019
Outside City
Park Hotel Farrer Park 300 Mid-Tier 2Q 2017
Centre The Clan 292 Mid-Tier City Centre 2019
Outside City
Courtyard Marriott at Novena 250 Mid-Tier 2Q 2017 YOTEL Changi Jewel 130 Economy Outside City Centre 2019
Centre
YOTEL Orchard Road 610 Economy City Centre 2Q 2017 THE EDITION by Marriott 190 Upscale/Luxury City Centre 2019
Year No. of Rms Upscale/Luxury Mid-Tier Economy
2017 3,767 1,715 46% 1,559 41% 493 13%
2018 69 0 0% 0 0% 69 100%
2019 1,462 420 29% 292 20% 750 51%
Total (2017 – 2019) 5,298 2,135 40% 1,851 35% 1,312 25%
* Property soft opened in Dec 2016 with half the total inventory and fully opened in 1Q 2017
** 181 rooms will be added back after the renovation is completed
Sources: Horwath HTL and CDLHT research 24Maldives Market
25CDLHT Maldives Resorts Performance
The Maldives Resorts recorded a YoY collective RevPAR (USD) decline of 8.8% in 1Q 2017 due to:
− Pricing pressures amidst an increase in new resort supply and aggressive promotional offers to secure
market share of declining Chinese arrivals, a key source market
− Relative strength of USD against currencies of some of the top source markets, which has made
Maldives a more expensive travel destination as the rates are priced in USD
The decline in NPI was partially mitigated mainly by the recognition of minimum rent for Angsana Velavaru (1)
Working with operators of both resorts to improve the market mix as well as taking cost containment
measures
InOcean Villa, Angsana Velavaru Ocean Sanctuary, Jumeirah Dhevanafushi
(1) Pro-rated minimum rent of US$1.5 million is recognised each quarter 26Maldives Tourism Market Update
For YTD Feb 2017, visitor arrivals grew 7.6% YoY but Chinese arrivals declined 4.6% YoY
The Maldives is planning to launch its own travel show, Travel Trade Maldives, in July 2017, to help
towards achieving two million tourists a year by 2020 (1)
Looking ahead, Maldives hospitality sector may continue to experience uncertainty due to:
− Relative strength of USD against some of the top source markets
− New resort supply
− Slowdown in luxury spending and moderating growth in China
International Visitor Arrivals to Maldives (2)
Thousand
1,400 8-year CAGR = 8.2% 1,286
1,205 1,234
1,200 1,125
931 958
1,000
792
800 683 656
600 7.6%
400 246
229
200
0
2008 2009 2010 2011 2012 2013 2014 2015 2016 2017
Full Year Visitor Arrivals YTD Feb Visitor Arrivals
(1) TTG, “What next for tourism in the Maldives?”, 8 Nov 2016
(2) Ministry of Tourism, Republic of Maldives 27Japan Market
28CDLHT Japan Hotels Performance
The Japan Hotels’ occupancies remained strong due to increase in arrivals
However, average room rates were affected by:
− Price sensitivity of the market
− Relative strength of JPY against many currencies
Consequently, the Japan Hotels registered a combined YoY RevPAR (JPY) decline of 7.2% for 1Q 2017
Double Room, Hotel MyStays Asakusabashi Twin Room, Hotel MyStays Kamata
Image Credit: Dave Powell (http://bit.ly/1ynUN9P) 29Japan Tourism Market Update
Long-term outlook for the hospitality sector is expected to be positive, supported by:
− Government’s aim for 40.0 million foreign visitors by 2020 (1) , in conjunction with Tokyo Olympics
− Approval of the integrated resorts
− Recent announcement to further relax visa requirements for Chinese tourists from May 2017, in
particular, issuance of multiple-entry visas to applicants who are currently only eligible for single-entry
visas (2)
International Visitor Arrivals to Japan (1) (3)
Million
4-year CAGR: 40.0
40.0
13.6%
35.0
30.0 11-year CAGR: 12.3%
24.0
25.0
19.7
20.0
15.0 13.4 13.6%
10.4
10.0 7.3 8.3 8.4 8.6 8.4
6.7 6.8 6.2 5.8 6.5
5.0
0.0
2005 2006 2007 2008 2009 2010 2011 2012 2013 2014 2015 2016 2017 2020
Full Year Visitor Arrivals Forecast Arrivals YTD Mar Arrivals
(1) Nikkei Asian Review, “Japan prepares for mass influx of tourists”, 11 Jan 2017
(2) Ministry of Foreign Affairs of Japan, “Relaxation of Visa Requirements for Chinese Citizens”, 21 Apr 2017
(3) Japan National Tourism Organization (JNTO) 30Geographical Mix of Top Markets (Japan)
South Korea is the top source market for Japan with a market share of 26%
South Korea, China, Taiwan and Hong Kong arrivals constitute 75% of total arrivals
All top 10 source markets saw growth in arrivals but growth pace for total arrivals has slowed down to
13.6% yoy for YTD Mar 2017 (+39.3% for YTD Mar 2016)
Geographical Mix of Visitor Arrivals Top 10 Inbound Markets
for YTD Mar 2017(1) YoY Change for YTD Mar 2017 (1) (2)
Indonesia Others
Indonesia 45.5%
Philippines 1% 11%
South Korea 24.2%
Malaysia 1%
2% Malaysia 19.3%
Australia
Philippines 16.4%
2% South Korea
Thailand 26% Thailand 13.4%
4%
U.S.A. 12.7%
U.S.A. Hong Kong 12.1%
4%
China China 12.0%
Hong Kong 25%
8% Australia 6.0%
Taiwan 3.5%
Taiwan 0.0% 10.0% 20.0% 30.0% 40.0% 50.0%
16%
(1) Based on JNTO’s statistics published on 20 Apr 2017
(2) The top 10 inbound markets are ranked according to growth rates in descending order 31United Kingdom Market
32CDLHT UK Hotel Performance
Hilton Cambridge City Centre recorded robust YoY RevPAR (GBP) growth of 17.9% in 1Q 2017
The strong underlying performance of the hotel was fuelled by healthy demand in the Cambridge hospitality
market
NPI in constant currency terms recorded an increase
However, negative currency translation due to a weaker GBP resulted in marginally lower NPI contribution
Hilton Cambridge City Centre Executive Lounge - Hilton Cambridge City Centre
33UK Tourism Market Update
In United Kingdom, the weaker pound is likely to improve tourist arrivals in 2017 (1)
However, there is economic uncertainty due to the commencement of the formal EU exit negotiations from
March 2017 (2) which may affect corporate demand
Emerging new rooms supply in 2017 may also have an impact on performance
Continued Growth in Cambridge – One of Europe’s largest
International Visitor Arrivals to UK (3) life science and healthcare clusters (4)
Million
50.0 6-Year CAGR = 3.8%
(1)
40.0 37.3 38.1
34.4 36.1
31.1 32.7
29.8 30.8
30.0
20.0
10.0
0.0
2010 2011 2012 2013 2014 2015 2016 2017
Full Year Arrivals VisitBritain Forecast Artist’s Impression of AstraZeneca £330 million Corp. HQ & Global R&D Centre
(1) TTG, “2017 could be 'record year' for inbound tourism”, 30 Dec 2016
(2) The New York Times, “British Firms Await Brexit Plans, Poised to Relocate”, 15 Jan 2017
(3) Office for National Statistics – UK
(4) Image credit: CB1 Cambridge Website 34Australia Market
35CDLHT Australia Hotels Performance
NPI for 1Q 2017 decreased 5.1% YoY largely due to lower variable rent applicable for 2016
Outlook for natural resource sector remains subdued over the short to medium term
Coupled with the increase in new hotel rooms supply in Perth and Brisbane, trading performance of the
hospitality sector will likely remain challenging
However, any weakness is mitigated by the defensive lease structure which provides CDLHT with a high
proportion of fixed rent
Lobby, Novotel Brisbane MRepublic Restaurant, Mercure Brisbane
36New Zealand Market
37CDLHT New Zealand Hotel Performance
NPI for 1Q 2017 increased 90.2% YoY mainly due to:
− Strong underlying performance of the hotel with a stellar YoY RevPAR (NZD) growth of 27.6%
− Higher variable income as a result of the new lease which offers significant upside from the buoyant
tourism market in New Zealand
− Strengthening of NZD against SGD
NPI
S$ million
6.0 5.4
90.2%
5.0
4.0
2.9 3.9
3.0
0.5
2.0
1.0 2.4
1.5
0.0
1Q 2016 1Q 2017
Fixed Rent Variable Rent Lobby, Grand Millennium Auckland
38CDLHT New Zealand Hotel – Capturing Growth The growth momentum of New Zealand’s hospitality market is supported by increase in international air services, a strong events calendar and its safe haven appeal Increase in supply of new hotel rooms remains limited in Auckland for the next couple of years CDLHT is positioned to benefit from the growth trajectory in the Auckland hospitality market where the full positive impact of Grand Millennium Auckland’s variable lease structure (1) will be felt in FY 2017 (1) The rent is equivalent to the net operating profit of the hotel, subject to an annual base rent of NZ$6.0 million 39
New Zealand Tourism Market Update
For 2016, visitor arrivals grew 11.8% YoY to a record 3.5 million
For YTD Feb 2017, visitor arrivals have grown 6.2% YoY to 0.8 million
New measures to boost Chinese tourists including a 20% increase in the number of flights from China, new
visa rules, and ease of movement through New Zealand airports, with 2019 declared as an official year of
China-New Zealand tourism (1)
International Visitor Arrivals to New Zealand (2)
Thousand
5-year CAGR = 6.1% Record high
4,000
3,500
3,132
3,000 2,857
2,601 2,718
2,565
2,000
6.2%
1,000 717 761
0
2011 2012 2013 2014 2015 2016 2017
Full Year Visitor Arrivals YTD Feb Visitor Arrivals
(1) NZ Herald, “Package for Chinese tourism welcomed by industry group”, 27 Mar 2017
(2) Statistics – Tourism New Zealand 40New Zealand Tourism Market Update
New International Air Services (1)* Strong Events Calendar in 2017 (2)*
Start Date Carrier Route Event / Date Category
Mar 16 Emirates Dubai – Auckland
ASB Classic (Tennis) (Jan 2017) Sports
Jun 16 American Airlines Los Angeles – Auckland
Splore Music and Arts Festival (Feb 2017) Music
Nov 16 United Airlines San Francisco – Auckland
Nov 16 Hong Kong Airlines Hong Kong – Auckland World Masters Games (Apr 2017) Sports
Dec 16 Hainan Airlines Shenzhen - Auckland
Lions Tour (Rugby) (Jun – Jul 2017) Sports
Dec 17 Tianjin Airlines Tianjin - Chongqing - Auckland
Feb 17 Qatar Airlines Doha - Auckland McKayson NZ Women's Open (First LGPA Tour) (Sep -
Sports
Oct 2017)
Jun 17 Sichuan Airlines Chengdu - Auckland
Jul 17 Air New Zealand Tokyo - Auckland Rugby League World Cup (Oct – Dec 2017) Sports
Auckland, the gateway city to New Zealand, is expected to benefit from the addition of new international air
services
The strong events line-up will feature a diverse range of sporting, arts and cultural events. Of significance is
the hosting of three global sporting events in 2017, World Masters Games, Lions Tour and Rugby League
World Cup, which are expected to bring significant number of visitors into Auckland
*Selected information only, not exhaustive list.
(1) Sabre Market Intelligence, Tourism New Zealand
(2) ATEED 41Asset Enhancement Plans
42Asset Enhancement Plans
All M&C Hotels: The wireless infrastructure will be upgraded in 2017 which will
Singapore
allow for a more comprehensive experience for corporate guests
Hilton Cambridge City Centre: New Executive Lounge opened in early 2017. The
United Kingdom restaurant and lobby will continue to be enhanced, including the launch of a new
restaurant concept
Mercure Perth: Renovation of bar into an Italian café, Cucina on Hay, has been
Australia
completed and opened
New Zealand Grand Millennium Auckland: Ongoing public area enhancement works in 2017
43Asset Enhancement Plans
Hilton
Cambridge
City Centre
New Executive
Lounge
(Opened in
early 2017)
44Asset Enhancement Plans
Hilton
Cambridge
City Centre
After
Newly
renovated gym,
LivingWell
Fitness
Before
45Asset Enhancement Plans
Mercure Perth
After
Renovation of
bar into Italian
café, Cucina on
Hay
Before
46Background and Structure
of CDL Hospitality Trusts
47Background on CDLHT
Background Post IPO Performance
IPO on 19 July 2006
Listed on SGX
Mainboard
Sponsored by
Millennium &
Copthorne Hotels plc
(listed on LSE)
First Hotel REIT in
Asia ex Japan
Market Capitalisation
S$1.48 billion as of 21
Apr 2017
Source: Bloomberg 48CDLHT Structure
Sponsor Investors
≈36.66% Holdings of Stapled Securities ≈63.34%
as at 31 Mar 2017 as at 31 Mar 2017
H-REIT Distributions HBT
Acts on behalf of
DBS Trustee the holders of H-
REIT Units
Stapling
Deed
Management
Management services
M&C REIT services M&C Business Trust
Management Limited H-REIT Rent HBT Acts on behalf
Management Limited
(H-REIT Manager) (owner and lessor) (owner or lessee) of the holders of (HBT Trustee-Manager)
Lease of the HBT Units
Hotels
Lease of
Rent
Hotels
Master
Active asset management Lessees
in close collaboration
with master lessees
Hotel Manager Hotel Manager
Note: For simplicity, the diagram does not include the relationships in relation to Claymore Connect. The H-REIT Manager manages Claymore Connect directly, hence the
various tenants of the retail units at Claymore Connect make rental payments directly to H-REIT under the terms of their respective leases. 49Blue Chip Sponsor and Parentage
Millennium & Copthorne Hotels plc City Developments Limited
One of the largest property developers in
Listed on the London Stock Exchange with
Singapore with a market capitalisation of ~ S$9.3
market capitalisation of ~ £1.5 billion (1)
billion (1)
Debt to assets ratio of 22.1% as at 31 Dec 2016
Debt to assets ratio of 29.0% as at 31 Dec 2016
(1) As at 21 Apr 2017
Source: Bloomberg 50Management Strategy
Acquisition Growth Strategy Asset Management Strategy
Pursue yield accretive, quality assets with Work closely with master lessees and/or
investment rigour and discipline hotel managers to implement active
Tap on potential pipeline from M&C / CDL revenue and cost management
Tap on global network for third party assets Implement asset enhancement initiatives
to optimise asset potential
Financial
Foundation
Capital Management Strategy
Maintain a healthy balance sheet
Enhance financial flexibility by maintaining
diversified sources of funding
51CDLHT Asset Portfolio – Singapore
Grand Novotel
Copthorne Claymore Singapore
Properties Orchard Hotel Copthorne M Hotel Singapore Studio M Hotel
King’s Hotel Connect Portfolio
Waterfront Hotel Clarke Quay
Located on
One of the largest Located in the Located within
Orchard Road, Stylish and Re-positioned as
conference heart of financial close proximity to Located next to
with a large pillar- contemporary a family-friendly
facilities in district with strong CBD, Orchard Singapore’s
Description less ballroom and design catering to mall with -
Singapore – well- following of Road, Robertson premier
extensive business and enhanced retail
positioned for the business Quay and Clarke entertainment hub
conference leisure segments offerings
MICE market travellers Quay
facilities
Rooms 656 574 415 310 403 360 - 2,718
Date of
19 July 2006 19 July 2006 19 July 2006 19 July 2006 7 June 2007 3 May 2011 19 July 2006
Purchase
Title /
Leasehold Leasehold Leasehold Leasehold Leasehold Leasehold Leasehold
Remaining
interest / interest / interest / interest / interest / interest / interest / -
Term of Land
65 years 65 years 65 years 50 years 60 years 89 years 65 years
Lease (1)
Valuation (1) S$424.0M S$348.0M S$234.0M S$116.0M S$319.0M S$153.0M S$90.0M S$1,684M
(1) As at 31 Dec 2016 52CDLHT Asset Portfolio – Overseas
Novotel Brisbane Mercure Brisbane Ibis Brisbane Mercure Perth Ibis Perth
Properties Australia Portfolio
(Australia) (Australia) (Australia) (Australia) (Australia)
Comprehensive Situated in Perth’s CBD
Well-situated in the heart of the government and Located steps away
conference and leisure and within walking
corporate precinct, steps away from the Queen from the Murray and
Description facilities of 11 dedicated distance to the Swan -
Street Mall and Brisbane Convention and Exhibition Hay Street shopping
rooms with capacity for River, shopping and
Centre belt within Perth’s CBD
up to 350 delegates entertainment districts
Rooms 296 194 218 239 192 1,139
Date of Purchase 18 February 2010 18 February 2010 18 February 2010 18 February 2010 18 February 2010
Title / Remaining
Strata Volumetric
Term of Land Freehold Freehold Strata Freehold Freehold -
Freehold
Lease (1)
A$62.0M / S$64.8M
Valuation (1) A$68.0M / S$71.1M A$46.0M / S$48.1M A$32.0M / S$33.5M A$208.0M / S$217.4M
(Both hotels are valued together)
(1) As at 31 Dec 2016
Based on exchange rate of A$1 = S$1.0454 53CDLHT Asset Portfolio – Overseas (con’t)
Jumeirah Hotel MyStays Hotel MyStays
Angsana Velavaru
Properties Dhevanafushi Maldives Portfolio Asakusabashi Kamata Japan Portfolio
(Maldives)
(Maldives) (Japan) (Japan)
Located in central
Tokyo, with easy
All-suite luxury resort, Located near Keikyu-
Upmarket resort offering access to Asakusa &
with extremely spacious Kamata Station which is
Description a wide range of dining, - Akihabara. A few -
villas which are amongst only a 10-min train ride
leisure and spa options stations away from
the largest in Maldives from Haneda Airport
several popular
sightseeing spots
113 37
Rooms (79 beachfront villas and (21 beachfront villas and 150 139 116 255
34 overwater villas) 16 overwater villas)
Date of Purchase 31 January 2013 31 December 2013 19 December 2014 19 December 2014 -
Title / Remaining
Leasehold interest / Leasehold interest /
Term of Land - Freehold Freehold -
31 years 39 years
Lease (1)
US$115.5M /
Valuation (1) US$66.0M / S$95.7M US$49.5M / S$71.8M ¥3.80B / S$46.9M ¥2.74B / S$33.8M ¥6.54B / S$80.7M
S$167.5M
(1) As at 31 Dec 2016
Based on exchange rate of US$1 = S$1.4505 and S$1 = ¥81.0373 54CDLHT Asset Portfolio – Overseas (con’t)
Grand Millennium Auckland Hilton Cambridge City Centre
Properties CDLHT Portfolio
(New Zealand) (United Kingdom)
Overlooking the Auckland Central Business Newly refurbished upper upscale hotel and
District, Grand Millennium Auckland is New boasts a prime location in the heart of
Description Zealand’s largest deluxe hotel located within Cambridge city centre, located 1.6 km from -
walking distance to Auckland’s convention Cambridge railway station and is within the
and retail precincts vicinity of popular tourist destinations
Rooms 452 198 4,912
Date of Purchase 19 December 2006 1 October 2015 -
Title / Remaining Term of Land Leasehold interest /
Freehold -
Lease (1) 99 years (2)
Valuation (1) NZ$177.0M / S$177.8M £62.3M / S$110.9M S$2,438M
(1) As at 31 Dec 2016
(2) The lease term may be extended for a further term of 50 years pursuant to lessee’s (CDLHT) option to renew under the lease granted by the head lessor (Cambridge City Council).
Based on exchange rates of NZ$1 = S$1.0047 and £1 = S$1.7808. 55Summary of Leases
Orchard Hotel, Grand Copthorne Waterfront Hotel, M Hotel, Copthorne King’s Hotel:
Rent: 20% of Hotel's revenue + 20% of Hotel’s gross operating profit, with a fixed rent floor of S$26.4 million
Term of 20 years from Listing (19 July 2006) with 20-year option
Claymore Connect:
H-REIT receives rents direct from tenants
Singapore IPO
Portfolio & Studio M
Studio M Hotel:
Rent: 30% of Hotel’s revenue + 20% of Hotel’s gross operating profit, with a fixed rent floor of S$5.0 million for the initial
10 years of the lease
Term of 20 years from 3 May 2011 with 20+20+10 years option
Novotel Singapore Clarke Quay:
Rent: Hotel’s gross operating profit less Accor’s management fee, subject to minimum rent
Variable rental payment of more than 90% of gross operating profit, depending on Novotel Singapore Clarke Quay’s
Singapore NCQ performance
Minimum rent of S$6.5 million per year guaranteed by master lessee / Accor S.A., subject to maximum rent reserve of
S$6.5 million for the lease term
Term ~ 13.5 years from 7 June 2007, expiring 31 December 2020
56Summary of Leases
New Zealand Grand Millennium Auckland:
Rent: Net operating profit of the hotel with an annual base rent of NZ$6.0 million
Grand Millennium Term of 3 years from 7 September 2016, expiring 6 September 2019
Auckland Lease provides for two 3-year renewal terms, subject to mutual agreement
Novotel, Mercure & Ibis Brisbane, Mercure & Ibis Perth:
Base rent + Variable rent
Australia Portfolio Base rent: A$13.7 million per annum
Variable rent: 10% of portfolio’s net operating profit in excess of base rent
Term ~ 11 years from 19 February 2010, expiring 30 April 2021
57Summary of Lease and Management Agreement
Angsana Velavaru:
Rent: Hotel’s gross operating profit less lessee’s management fee, subject to minimum rent
Minimum rent of US$6.0 million per year guaranteed by lessee / Banyan Tree Holdings Limited, subject to maximum rent
Maldives
reserve of US$6.0 million for the lease term
Angsana Velavaru Tiered lessee’s management fee offers further downside protection to CDLHT and incentivises lessee to drive growth in
gross operating profit while allowing CDLHT to enjoy a substantial share of the upside
Term of 10 years from 1 February 2013, expiring 31 January 2023
Jumeirah Dhevanafushi:
Maldives CDL Hospitality Business Trust (“HBT”) activated as the master lessee (“HBT Lessee”) for the resort's operations
Jumeirah Jumeirah is the hotel manager of the resort and is engaged by HBT Lessee
Term of hotel management agreement with Jumeirah: 35 years from 1 November 2011, expiring 31 October 2046
Dhevanafushi Typical management fees apply
58Summary of Management Agreement
Hotel MyStays Asakusabashi and Hotel MyStays Kamata:
HBT is the master lessee (“HBT Lessee”) for the hotels’ operations
MyStays Hotel Management Co., Ltd. is the hotel manager of the hotels and is engaged by HBT Lessee
Japan Portfolio Hotel management agreements will expire 18 Jul 2019 (automatically renewed for 3-year term unless notice of
termination is made by either parties)
Typical management fees apply
59Summary of Management Agreement
Hilton Cambridge City Centre:
United Kingdom HBT is the asset owner and currently responsible for the hotel’s operations
Hilton Cambridge Hilton UK Manage Limited (an affiliate of Hilton Worldwide Inc.) has been appointed as the hotel manager by HBT
Term of 12.25 years from 1 October 2015, expiring on 31 December 2027
City Centre Typical management fees apply
60Location of
CDL Hospitality Trusts Properties
61Hotels in Strategic Locations
Singapore Hotels New Zealand Hotel
Orchard Hotel & Grand Copthorne Novotel
Shopping Arcade Waterfront Hotel Singapore Grand Millennium
Clarke Quay Auckland
(previously known
as Rendezvous
H
Hotel Auckland)
H
H H
H
SINGAPORE
RIVER
CENTRAL MARINA BAY
BUSINESS SANDS H
DISTRICT
H
BUSINESS &
FINANCIAL
CENTRE SITE
Copthorne King’s Studio M Hotel M Hotel
Hotel AUCKLAND CITY CENTRE
62Hotels in Strategic Locations
Australia Hotels
Mercure Ibis Novotel Mercure
Brisbane Brisbane Brisbane Ibis Perth Perth
Brisbane CBD Perth CBD
H
H
H H
H
CBD AREA
63Resorts in Premium Destination
Angsana Velavaru
Malé Atoll
40 min
seaplane
flight
55 min
domestic
flight +
15 min
R speedboat Jumeirah Dhevanafushi
ride
South
Nilandhe
Atoll
R
Gan International Airport
64Hotels in Japan’s Gateway City of Tokyo
Japan Hotels
Hotel MyStays Hotel MyStays
Asakusabashi Kamata
Asakusabashi Kamata
H
H
65Hotel in Cambridge, United Kingdom
United Kingdom Hotel
Cambridge
H
Hilton Cambridge City Centre
(previously known as Cambridge City Hotel)
66THANK YOU
67You can also read