CAPITALAND INTEGRATED COMMERCIAL TRUST - 1Q 2021 Business Update 26 April 2021 - CapitaLand Integrated ...
←
→
Page content transcription
If your browser does not render page correctly, please read the page content below
CAPITALAND INTEGRATED COMMERCIAL TRUST
1Q 2021 Business Update
26 April 2021
Disclaimer
This presentation may contain forward-looking statements. Actual future performance, outcomes and results may differ materially from those
expressed in forward-looking statements as a result of a number of risks, uncertainties and assumptions. Representative examples of these factors
include (without limitation) general industry and economic conditions, interest rate trends, cost of capital and capital availability, availability of real
estate properties, competition from other developments or companies, shifts in customer demands, shifts in expected levels of occupancy rate,
property rental income, charge out collections, changes in operating expenses (including employee wages, benefits and training, property
operating expenses), governmental and public policy changes and the continued availability of financing in the amounts and the terms necessary
to support future business.

You are cautioned not to place undue reliance on these forward-looking statements, which are based on the current view of management
regarding future events. No representation or warranty expressed or implied is made as to, and no reliance should be placed on, the fairness,
accuracy, completeness or correctness of the information or opinions contained in this presentation. Neither CapitaLand Integrated Commercial
Trust Management Limited (“Manager”) nor any of its affiliates, advisers or representatives shall have any liability whatsoever (in negligence or
otherwise) for any loss howsoever arising, whether directly or indirectly, from any use, reliance or distribution of this presentation or its contents or
otherwise arising in connection with this presentation.

The past performance of CapitaLand Integrated Commercial Trust (“CICT”) is not indicative of future performance. The listing of the units in the CICT
(“Units”) on the Singapore Exchange Securities Trading Limited (the “SGX-ST”) does not guarantee a liquid market for the Units. The value of the Units
and the income derived from them may fall as well as rise. Units are not obligations of, deposits in, or guaranteed by, the Manager or any of its
affiliates. An investment in the Units is subject to investment risks, including the possible loss of the principal amount invested. Investors have no right
to request that the Manager redeem or purchase their Units while the Units are listed on the SGX-ST. It is intended that holders of Units may only deal
in their Units through trading on the SGX-ST.

This presentation is for information only and does not constitute an invitation or offer to acquire, purchase or subscribe for the Units.

                                                                                                                                                               2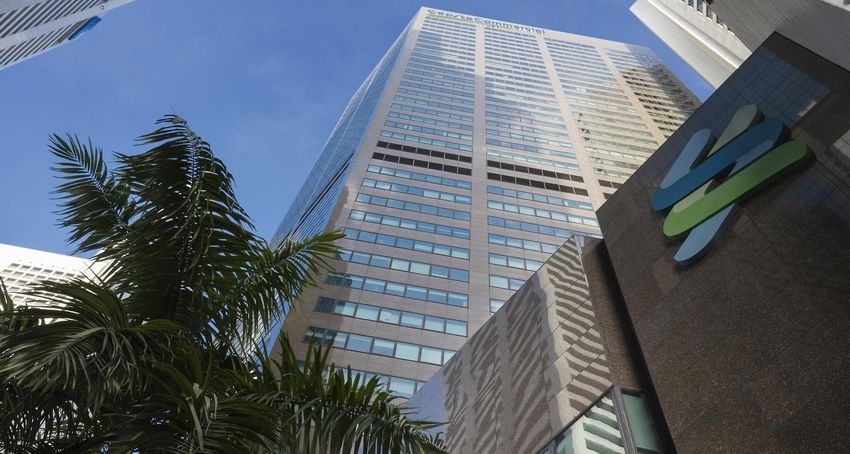
Contents
                                                                                                                  Slide No.
1.      Highlights                                                                                                 04
2.      Financial Performance                                                                                      09
3.      Portfolio Performance                                                                                      13
4.      Information by Asset Type                                                                                  17
5.      Creating Value                                                                                             32
6.      Summary                                                                                                    41
7.      Market Information                                                                                         43

* Any discrepancies in the tables and charts between the listed figures and totals thereof are due to rounding.

                                                                                                                              3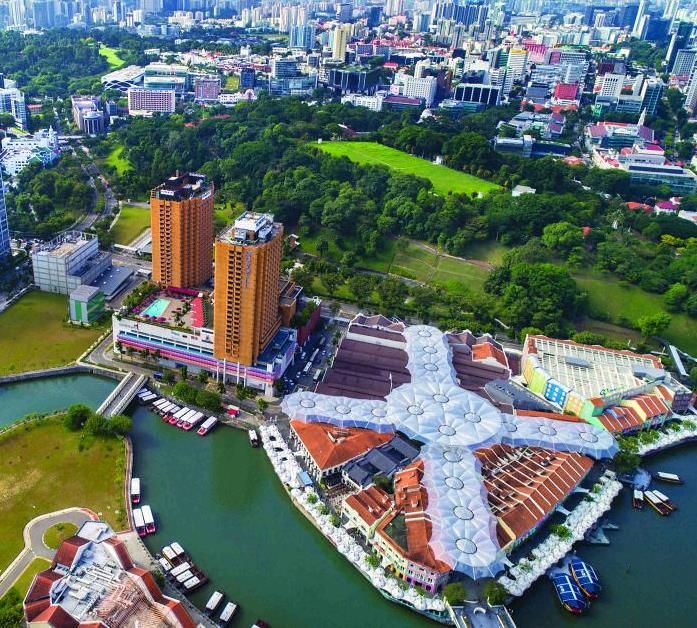
Highlights

             Plaza Singapura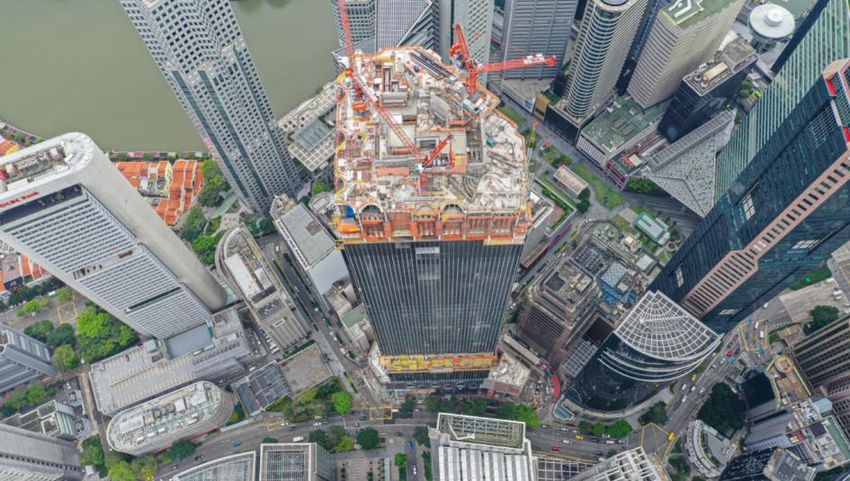
1Q 2021 financial performance
Gross Revenue Net Property Income
S$334.8 million S$247.1 million
▲63.9% Y-o-Y ▲66.6% Y-o-Y
Retail Asset Performance Office Asset Performance (1) Integrated Development
(S$ m) (S$ m) Performance (2)
(S$ m)
153.5
142.2
110.2 96.5
101.2
96.1
74.0 71.9
50.8
38.1
Gross Revenue NPI Gross Revenue NPI Gross Revenue NPI
1Q 2020 1Q 2021 1Q 2020 1Q 2021
1Q 2021
Notes:
(1) Income contribution from office assets is from 21 October 2020 onwards. Hence, there is no data for 1Q 2020. Income contribution excludes One George Street as it is a joint venture.
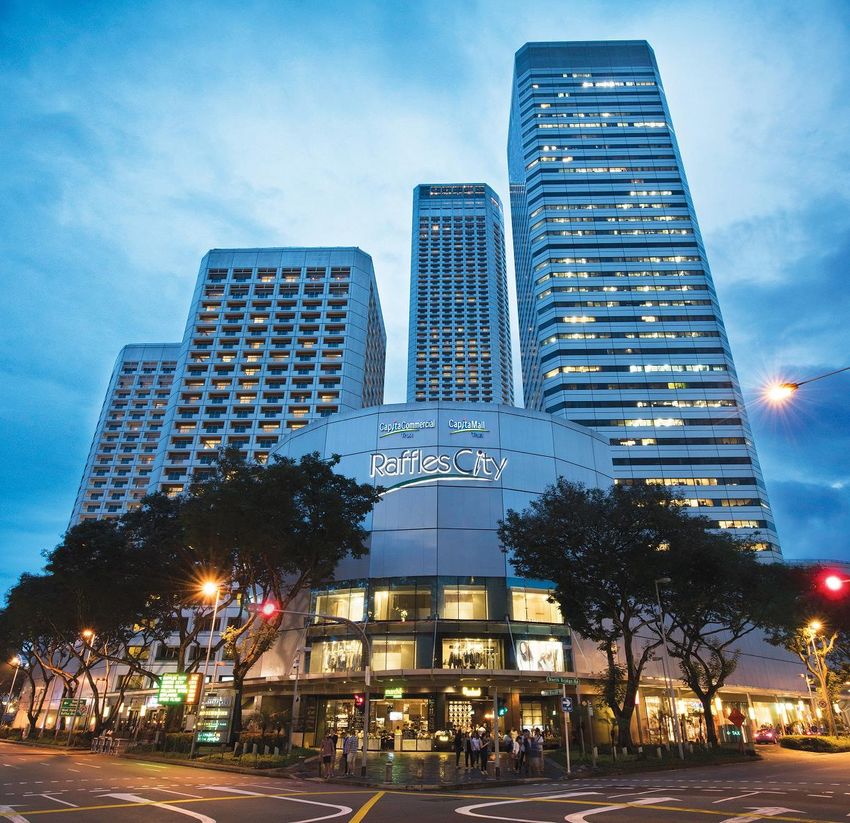
(2) Income contribution from Raffles City Singapore is on a 100.0% basis for 1Q 2021. Excludes income contribution from Raffles City Singapore for 1Q 2020 as it was a joint venture of CICT on a 40.0%
basis prior to the merger.
5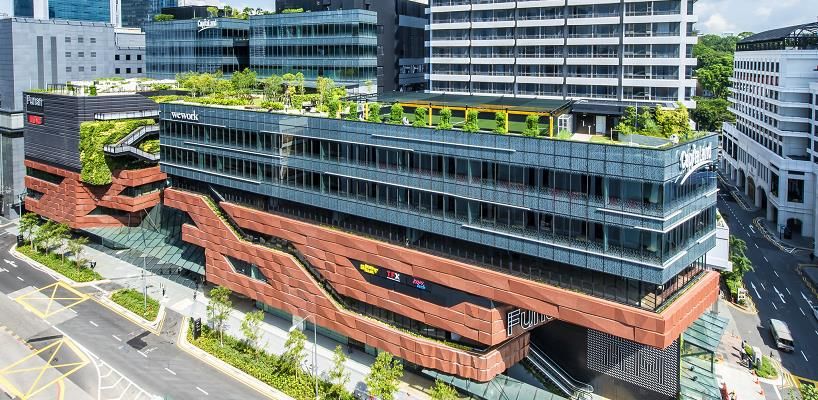
Key operating metrics for 1Q 2021
Proactive leasing strategy remains a priority while striking a right balance between
occupancy and rents

                       Portfolio                                                                      Portfolio Weighted Average Lease
          Committed Occupancy                                                                             Expiry by Gross Rental Income
                         (as at 31 March 2021)               95.9%                                                                      (as at 31 March 2021)                3.1 years            (1)

                  Retail Tenants’ Sales                                                                            Return of Office Community
                                                             ▲ 2.9%                                                                                                          51.3%
                                                                                  (2)
                                      (for 1Q 2021)                                                        (average for week ended 16 April 2021)

Notes:
(1) Based on 50.0% interest in One George Street, Singapore and 94.9% interest in Gallileo and Main Airport Center, Frankfurt; and WeWork’s 7-year lease at 21 Collyer Quay. Excludes gross turnover rents.
(2) Year-on-year comparison of tenants sales per square foot per month and adjusted for non-trading days.

                                                                                                                                                                                                              6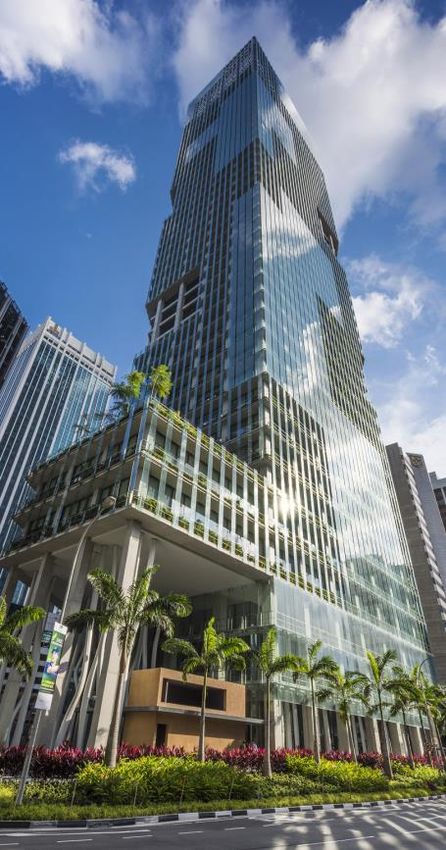
Key financial indicators
                                                                                                          As at                                      As at
                                                                                                      31 March 2021                            31 December 2020

Unencumbered Assets as % of Total Assets                                                                      95.8%                                        95.8%
Aggregate Leverage(1)                                                                                         40.8%                                        40.6%
Net Debt / EBITDA(2)                                                                                           N.M.                                         N.M.
Interest Coverage(3)                                                                                           3.7x                                          3.8x
Average Term to Maturity (years)                                                                                4.4                                           4.1
Average Cost of Debt(4)                                                                                        2.4%                                         2.8%
CICT’s Issuer Rating(5)                                                                              ‘A3’ by Moody’s                             ‘A3’ by Moody’s
                                                                                                       ‘A-’ by S&P                                 ‘A-’ by S&P

Notes:
(1) In accordance with Property Funds Appendix, CICT’s proportionate share of its joint ventures’ borrowings and deposited property values are included when computing aggregate leverage.
    Correspondingly, the ratio of total gross borrowings to total net assets is 71.7%.
(2) Net Debt comprises Gross Debt less total cash and EBITDA refers to earnings of CICT Group, before interest, tax, depreciation and amortisation (excluding effects of any fair value changes of
    derivatives and investment properties, foreign exchange translation and non-operational gain/loss), on a trailing 12-month basis.
(3) Ratio of earnings of CICT Group, before interest, tax, depreciation and amortisation (excluding effects of any fair value changes of derivatives and investment properties, foreign exchange
    translation and non-operational gain/loss) over interest expense and borrowing-related costs, on a trailing 12-month basis.
(4) Ratio of interest expense over weighted average borrowings.
(5) Moody’s Investors Service downgraded CICT’s issuer rating to ‘A3’ on 1 October 2020. S&P Global Ratings assigned ‘A-’ issuer rating to CICT on 30 September 2020.

N.M.: Not meaningful

                                                                                                                                                                                                     7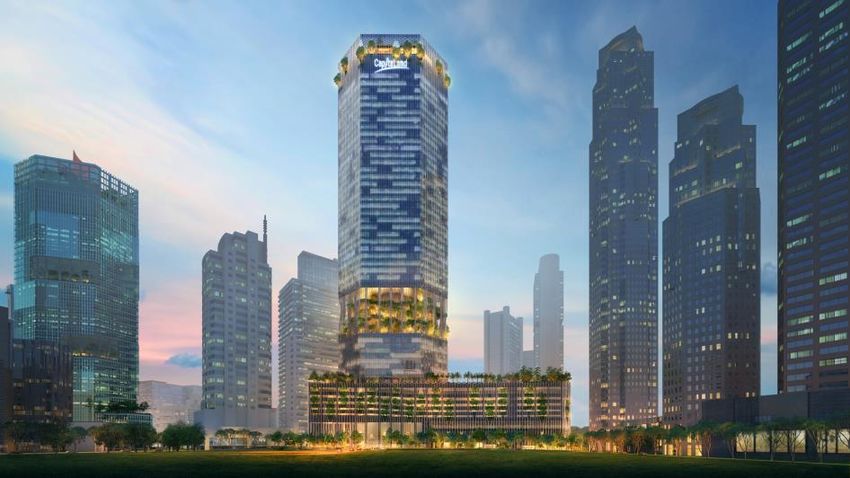
CICT debt maturity profile as at 31 March 2021
Average term to maturity extended to 4.4 years
 S$ million
                                                                                                          Issued two long tenor notes with lower interest rates
   1,800                                        17%                                                       through its unsecured S$7.0 billion Multicurrency Medium
             Refinancing completed                             17%
                   in 1Q 2021                                                                             Term Note Programme (MTN Programme) in 1Q 2021:
                                               1,603
   1,600                                                      1,576
                                                                      14%
                                                                                                          •   Issued S$460 million fixed rate notes due 8 March
   1,400          4%                                                  1,345                                   2028 through MTN Programme at 2.10% per annum.
                 355             12%
                                                                                        11%               •   Issued HK$713 million 2.53% fixed rate notes due 1
   1,200                                                                                                      February 2033 through MTN Programme which was
                                1,105           870
                                                               900                     1,066
                                                                              10%                             swapped to S$125 million at 2.15% per annum.
   1,000                                                                      917
                                 265
                                                                       832
                                                                                        418
     800          857                                                         299

     600                         459
                                                                                                    5%
                                                                              186                               4%
                                                                                        290
     400                                                               213
                                                733            676                                                                              2%
                  175                                                                                                                 2%
                                                                              432                  460                     1%                              1%
     200                         381                                                    358                     407
                                                                       300                                                                      250
                  180                                                                                                                 150                  125
                                                                                                                           75
        0
                 2021           2022           2023           2024    2025    2026     2027        2028        2029       2030        2031     2032       2033
                                       Medium Term Notes (“MTN”)              Secured Bank Loans               Unsecured Bank Loans
Note:
(1) Please visit CICT website for details of the respective MTN.
                                                                                                                                                                     8
Financial
Performance

              Capital Tower
1Q 2021 gross revenue(1)
DORSCON level was raised to Orange on 7 February 2020; travel restrictions and safe
distancing measures were imposed and still in force as at 31 Mar 2021
(S$ m) 54.1
47.7
26.5
24.4
22.722.2 22.5 21.6
20.4 19.7 21.1
20.3 18.8
17.6 15.8 15.7 17.6
15.4 14.2 13.7
14.7 12.7 12.4 12.5 13.7
10.4 11.5
10.0 9.5 8.3 7.8 7.2 6.7
3.8
-
21 Collyer Quay (4)
Other Assets (2)
Raffles City Singapore (3)
Gallileo
CapitaGreen
Six Battery Road
Capital Tower
Main Airport Center
Funan
Asia Square Tower 2
Bedok Mall
Bugis Junction
Clarke Quay
IMM Building
Bugis+
Junction 8
Lot One Shoppers' Mall
Tampines Mall
Westgate
Plaza Singapura
The Atrium@Orchard
1Q 2020 1Q 2021 1Q 2020 1Q 2021 1Q 2021
Notes:
(1) Income contribution from office assets is from 21 October 2020 onwards and excludes One George Street, a joint venture.
(2) Comprises JCube and Bukit Panjang Plaza.
(3) For 1Q 2020, income contribution from Raffles City Singapore is on a 100.0% basis and for illustration only. Actual income contribution from Raffles City Singapore was on a 40.0% basis as it was a
joint venture of CICT prior to the merger. For 1Q 2021, income contribution from Raffles City Singapore is on a 100.0% basis.
(4) 21 Collyer Quay is currently undergoing upgrading. 101Q 2021 operating expenses(1)
(S$ m)
11.7
(4)
7.4
6.3 6.3
5.5 5.7
5.3 5.2 5.5 5.4
5.3 5.1 4.7
4.9 4.5 4.6
4.2 4.3
4.0 4.0
3.8 3.7 3.6
3.3 3.2 3.0 3.3
3.1 2.7 2.8 2.4
2.4
2.1
1.2
0.6
Raffles City Singapore(3)
Other Assets(2)
Funan
Gallileo
CapitaGreen
Six Battery Road
Asia Square Tower 2
Capital Tower
21 Collyer Quay
Main Airport Center
Bedok Mall
Bugis Junction
Clarke Quay
IMM Building
Bugis+
Lot One Shoppers' Mall
Junction 8
Tampines Mall
Westgate
Plaza Singapura
The Atrium@Orchard
1Q 2020 1Q 2021 1Q 2020 1Q 2021 1Q 2021
Notes:
(1) Operating expenses from office assets is from 21 October 2020 onwards and excludes One George Street, a joint venture.
(2) Comprises JCube and Bukit Panjang Plaza.
(3) For 1Q 2020, operating expenses from Raffles City Singapore is on a 100.0% basis and for illustration only. Actual operating expenses from Raffles City Singapore was on a 40.0% basis as it was a joint
venture of CICT prior to the merger. For 1Q 2021, operating expenses from Raffles City Singapore is on a 100.0% basis.
(4) 1Q 2020 operating expenses for Raffles City Singapore include property tax rebate. 111Q 2021 net property income(1)
46.7
(S$ m)
36.0
20.8 19.8
16.4 15.9 17.0 16.2
15.114.5 15.6
15.0 13.7
12.7 11.6 11.0 13.3
11.410.9 10.510.1
9.5 8.7 10.4
8.2 8.4
7.1 6.9 6.3 5.9 5.7 6.0 4.3
1.1 -0.6
Raffles City Singapore(3)
21 Collyer Quay(4)
Other Assets(2)
Asia Square Tower 2
Funan
Gallileo
CapitaGreen
Six Battery Road
Capital Tower
Main Airport Center
Bedok Mall
IMM Building
Clarke Quay
Bugis+
Junction 8
Lot One Shoppers' Mall
Tampines Mall
Westgate
Bugis Junction
Plaza Singapura
The Atrium@Orchard
1Q 2020 1Q 2021 1Q 2021
1Q 2020 1Q 2021
Notes:
(1) Income contribution from office assets is from 21 October 2020 onwards and excludes One George Street, a joint venture.
(2) Comprises JCube and Bukit Panjang Plaza.
(3) For 1Q 2020, income contribution from Raffles City Singapore is on a 100.0% basis and for illustration only. Actual income contribution from Raffles City Singapore was on a 40.0% basis as it was a
joint venture of CICT prior to the merger. For 1Q 2021, income contribution from Raffles City Singapore is on a 100.0% basis.
(4) 21 Collyer Quay is currently undergoing upgrading. 12Portfolio
Performance
Plaza SingapuraKey market updates
Gradual easing of safe management measures positive for both retail and office
segments
COVID-19 • Phase 3 reopening on 28 December 2020:
Situation in ― Capacity limits in malls and large standalone stores increased from 10m2 to 8m2
Singapore per person; and
― Group size for gatherings increased from 5 to 8 person.
• From 5 April 2021, up to 75% of staff can return to office as working from home is no
longer default mode.
• Nationwide rollout of vaccination in progress. As at 29 March 2021, about 1.3 million
Singaporeans have received at least the first dose of vaccination.
Fair Tenancy • Effective from 1 June 2021, landlords and tenants have to abide by the Code of
Framework Conduct (CoC) which provides a set of clear leasing guidelines and negotiation
principles which is fair to both parties. This will lead to a more collaborative, open,
(Retail) honest, and transparent relationship which is mutually beneficial.
(the CoC can be found here)
14Portfolio
Portfolio lease expiry profile(1)(2) as at
31 March 2021
Portfolio Weighted Average Lease Expiry by Monthly Gross Rental Income
3.1 Years
20.5%
13.4%
12.4%
9.8%
8.5%
6.3% 7.0% 6.3%
5.2% 4.6%
1.8% 2.4% 1.8%
2021 2022 2023 2024 2025 2026 and
beyond
Retail Office Hospitality
Notes:
(1) Excludes gross turnover rents.
(2) Based on 50.0% interest in One George Street, Singapore and 94.9% interest in Gallileo and Main Airport Center, Frankfurt; and WeWork’s 7-year lease at 21 Collyer Quay.
15Portfolio
No single tenant contributes more than 5.0% of
CICT’s total gross rental income(1)
% of Total
Ranking Top 10 Tenants for March 2021 Trade Sector
Gross Rent
1 RC Hotels (Pte) Ltd 5.0% Hotel
Supermarket / Beauty & Health / Services /
2 NTUC Enterprise Co-operative Limited 2.2%
Food & Beverage / Education / Warehouse
3 Temasek Holdings (Private) Limited 2.0% Financial Services
4 Commerzbank AG(2) 1.9% Banking
5 GIC Private Limited 1.7% Financial Services
Supermarket / Beauty & Health / Services /
6 Cold Storage Singapore (1983) Pte Ltd 1.7%
Warehouse
7 Mizuho Bank, Ltd 1.6% Banking
8 BreadTalk Group Limited 1.6% Food & Beverage
9 JPMorgan Chase Bank, N.A. 1.3% Banking
10 BHG (Singapore) Pte. Ltd. 1.2% Department Store
Total top 10 tenants’ contribution 20.2%
Notes:
(1) For month of March 2021 and excludes gross turnover rent.
(2) Based on 94.9% interest in Gallileo, Frankfurt.
16Information by
Asset Type
Please note:
The retail and office asset information
included the respective retail and
office components of integrated
developments unless stated
otherwise, in order to show the
operating metrics and trends
CapitaGreenRetail
Retail performance overview
Retail 1Q 2021 New Retail Openings by NLA
Occupancy(1) IT &
Services, 1.2%
97.1%
Telecommunication,
Home Furnishing, 1.1%
1.4% Others,
as at 31 March 2021 1.4% Shoes & Bags,
Beauty & Health, 0.9%
3.3%
Education, 6.2%
Shopper Tenants’ Sales
Traffic Per Square Foot Food &
Recovered to Electrical &
Beverage,
42.2%
75.3% ▲2.9%
Electronics,
17.8%
of the level a year ago Y-o-Y
1Q 2021 1Q 2021
Fashion, 24.5%
Note:
(1) Retail occupancy includes retail only properties and the retail components within integrated developments.
18Retail
Retail committed occupancy at 97.1%(1)
Above Singapore retail occupancy rate of 91.5% for 1Q 2021 based on URA’s island-
wide retail space vacancy rate
99.6% 99.9% 100.0% 99.4% 98.7% 98.4% 99.4% 99.9% 99.9% 99.0% 99.3% 98.5% 98.4% 99.2% 100.0% 98.2% 98.9% 97.1% 98.8% 98.7%
98.7% 96.9%
95.5% 94.2% 95.9% 94.8%
90.9%
84.7%
Clarke Quay(2)
Other assets(3)
Bugis +
Bugis Junction
Westgate
Junction 8
Bedok Mall
Shoppers' Mall
Tampines Mall
The Atrium
Funan
IMM Building
Plaza Singapura
Raffles City
@Orchard
Singapore
Lot One
As at 31 March 2020 As at 31 March 2021
Notes:
(1) Retail occupancy includes retail only properties and the retail components within integrated developments.
(2) Clarke Quay’s occupancy was affected by government-stipulated restrictions on trading hours and sales of alcohol at nightlife venues like clubs, karaoke joints and bars without food licenses.
(3) Comprises JCube and Bukit Panjang Plaza.
19Retail
Retail lease expiry profile(1)
Weighted Average Lease Expiry by
1.8 Years
Monthly Gross Rental Income
Monthly Gross Rental Income(2)
As at 31 March 2021 Number of Leases S$’000 % of Total
2021 764 13,541 21.8
2022 1,006 22,370 36.1
2023 693 14,587 23.5
2024 325 7,665 12.3
2025 42 1,974 3.2
2026 and beyond 28 1,916 3.1
Total 2,858(3) 62,053 100.0
Notes:
(1) Based on committed leases in retail properties and retail components in Integrated Development.
(2) Excludes gross turnover rent.
(3) Of which 2,519 leases are retail leases.
20Retail
Shopper traffic and tenants’ sales(1) on positive
trajectory
Following Phase 3 reopening on 28 Dec 2020, shopper traffic recovery gained momentum
while tenants’ sales rebounded in 1Q 2021
Year-on-year recovery levels for tenants’ sales and shopper traffic
in CICT retail portfolio
102.9%
92.5% 88.6% 94.5%
100%
75.3%
90.9% 68.6% 67.9%
59.7%
28.1%
(2) (2)
1Q 2020 2Q 2020 3Q 2020 4Q 2020 1Q 2021
Shopper Traffic (Y-o-Y) Tenant Sales $psf/month (Y-o-Y)
Suburban mall recovery Downtown mall recovery Suburban mall recovery Downtown mall recovery
Shopper Tenants’ 99.2% to 113.5% 49.6% to 109.6%
64.5% to 95.1% 61.7% to 85.1%
Traffic Average: 75.8% Average: 74.8% Sales Average: 104.3% Average: 98.8%
Notes:
(1) Tenants’ sales are adjusted for non-trading days.
(2) For comparable basis, CICT portfolio excludes Funan which was closed in July 2016 for redevelopment and reopened in June 2019.
21Retail
Most trade categories saw Y-o-Y improvement
in 1Q 2021
Top five trade categories(1) 1Q 2021 tenants’ sales $ psf/month(2) 0.7% Y-o-Y
(by gross rental income for retail segment)
: Percentage of total retail gross rental income(3) > 69%
47.5%
1Q 2021 Tenants’ Sales by Trade Categories
Y-o-Y Variance of Tenants’ Sales $ psf/month (%)
14.4% 11.0% 10.7% 9.0% 6.0% 5.5% 2.8% 1.7% 0.8%
-2.6%
-6.6%
-14.1% -17.7%
-47.9%
(4)
Services (3)
Books & Stationery
Education
Sporting Goods
Beauty & Health
Jewellery & Watches
Home Furnishing
Fashion
IT & Telecommunications
Food & Beverages
Shoes & Bags
Department Store
Leisure & Entertainment
Supermarket
Electrical & Electronics
Notes:
(1) The top five trade categories for 1Q 2021 include Food & Beverage, Beauty & Health, Fashion, Supermarket and IT & Telecommunications.
(2) For the period January to March 2021. Excludes gross turnover rent.
(3) Includes convenience stores, bridal shops, optical shops, film processing shops, florists, magazine stores, pet shops, travel agencies, cobblers/locksmiths, laundromats and clinics.
(4) Leisure & Entertainment was impacted by government-stipulated restrictions on trading hours and sales of alcohol at nightlife venues like clubs, karaoke joints and bars without food licenses. 22Office
Office performance overview
Singapore and Germany office assets Increase in leasing enquiries for
expansion and new set-up space
Office Total New and Renewal Leases Q-o-Q(4)
Occupancy(1) (sq ft) 10%
2%
94.9% 291,800 8%
42%
as at 31 March 2021 1Q 2021 7%
(New leases: 5.3%(2)) 23%
46%
Singapore office assets 63%
Office Average Return of office
4Q 2020 1Q 2021
Occupancy(1) SG Office Rent(3) community for week
ended 16 Apr 2021 Relocation Expansion Consolidation New set-up
94.8% S$10.28psf 51.3% Top three business sectors by space requirement
as at 31 March 2021 as at 31 March 2021 1) IT, Media and Telecommunications (mainly
(CBRE SG Core CBD technology)
occupancy: 93.9%) 2) Banking, Insurance and Financial Services
3) Business Consultancy
Notes:
(1) Based on committed occupancy as at 31 March 2021.
(2) NLA of new leases in 1Q 2021 is approximately 15,500 square feet, including Raffles City Tower and One George Street. Trade sectors of new committed leases are from Maritime and Logistics, Financial
Services, Food and Beverage.
(3) Excludes Funan and The Atrium@Orchard. If including Funan and The Atrium@Orchard, the average Singapore office rent would be S$9.97psf.
(4) Observation based on leasing enquiries seen in CICT’s office portfolio. Percentages were based on required space and intention indicated by prospects and does not take into account their existing
space.
23Office
Occupancy rate of office portfolio at 94.9%
Occupancy for Singapore: Occupancy for Germany:
CICT’s office portfolio: 94.8% CICT’s portfolio: 95.4%
Core CBD: 93.9% Frankfurt Market: 93.6%(3)
96.9% 97.4% 100.0% 96.8% 100.0% 100.0% 100.0% 97.9% 100.0% 100.0% 100.0% 100.0% 100.0% 100.0%
96.4% 95.5%
92.2% 94.9% 92.2% 92.3%
78.5% 78.2%
Asia Square Tower CapitaGreen Capital Tower Six Battery Road(1) 21 Collyer Quay(2) One George Street Raffles City Tower Funan (Office) The Atrium@ Gallileo Main Airport
2 Orchard (Office) Center
As at 31 Mar 2020 As at 31 Mar 2021
Notes:
(1) Six Battery Road’s occupancy expected to remain as such until partial upgrading is completed in phases.
(2) 21 Collyer Quay is currently undergoing upgrading; WeWork has leased the entire NLA and the term is expected to commence in 4Q 2021 on a gross rent basis.
(3) Frankfurt office market occupancy as at 4Q 2020.
24Office
Office rents committed above market levels
Market Rents of
Average Committed Comparative Sub-Market (S$)
Building Expired Rents Rents in 1Q 2021 Sub-Market
(S$) (S$) Cushman &
Knight Frank(2)
Wakefield(1)
Grade A
CapitaGreen 10.85 10.35 – 11.25 9.58 9.10 – 9.60
Raffles Place
Grade A
Six Battery Road 11.58 9.60 – 12.60 9.58 9.10 – 9.60
Raffles Place
Grade A
One George Street 9.22 8.80 – 9.90 9.58 9.10 – 9.60
Raffles Place
Notes:
(1) Source: Cushman & Wakefield 1Q 2021.
(2) Source: Knight Frank 1Q 2021; based on leases of a whole floor office space on the mid-floor levels of office properties and accounting for rent free period and other concessions.
For reference only: CBRE Pte. Ltd.’s 1Q 2021 Grade A core CBD rent is S$10.40 psf per month and they do not publish sub-market rents.
25Office
Proactively engaged with tenants to manage
their requirements
Weighted Average Lease to Expiry
3.0 Years
By Monthly Gross Rental Income
Total Office Portfolio(1) Lease Expiry Profile as at 31 March 2021
25.4% 26.2% 25.3%
22.0%
11.7%
10.0% 16.4% 16.1%
13.6%
11.5%
16.3% (2) 6.3% 7.0%
13.9%
2021 2022 2023 2024 2025 2026 and beyond
Monthly Gross Rental Income Net Lettable Area Completed
Notes:
(1) Includes Raffles City Tower, Funan (office), The Atrium@Orchard (office), Gallileo and Main Airport Center’s leases; and WeWork’s 7-year lease at 21 Collyer Quay which is expected to
commence in 4Q 2021.
(2) Includes JPM’s lease which constitutes 3% of total office NLA.
26Office
Addressing tenant space and leasing
requirements with flexibility and optionality
1Q 2021 Grade A office market rent at S$10.40 psf per month (1)
2021
Average rent of leases expiring is S$10.41 psf
(2) Period 1H 2021 2H 2021
20% 16
Rental Rental
% of % of
Rates of Rates of
11.60 Building Expiring Expiring
11.46 Expiring Expiring
15% 10.48 12 Leases Leases
Leases (S$) Leases (S$)
8.31
Asia Square Tower 2 2.8% 11.56 0.6% 11.84
10% 8
Capital Tower 3.5% 8.31 - -
5.5%
5% 4 CapitaGreen 2.6% 10.86 2.9% 12.08
3.4% 3.5%
2.6%
Six Battery Road 0.5% 10.09 2.1% 10.59
0% 0 Total Percentage/
Asia Square Tower 2
(3)
Capital Tower CapitaGreen Six Battery Road 9.4% 9.89 5.6% 11.44
Weighted Average
Average monthly gross rental rate for expiring leases (S$ psf / month)
Monthly gross rental income for leases expiring at respective properties X 100%
Monthly gross rental income for office portfolio
Notes:
(1) Source: CBRE Pte. Ltd. as at 1Q 2021.
(2) Four Grade A buildings only.
(3) Excludes ancillary retail leases.
27Office
Continue to proactively manage major leases
2022 2023
(1) (1)
Average rent of leases expiring is S$9.22 psf Average rent of leases expiring is S$11.00 psf
20% 16 20% 16
12.19 11.88
15% 11.00 11.32 12 15% 11.06 12
10.75
8.56
10% 8 10% 8
6.18
4.8% 4.5%
5% 4 5% 4.2% 4
3.2% 3.4% 3.5%
2.0%
0.2%
0% (2)
0 0% (2)
0
Asia Square Tower 2 Capital Tower CapitaGreen Six Battery Road Asia Square Tower 2 Capital Tower CapitaGreen Six Battery Road
Average monthly gross rental rate for expiring leases (S$ psf / month)
Monthly gross rental income for leases expiring at respective properties X 100%
Monthly gross rental income for office portfolio
Notes:
(1) Four Grade A buildings only.
(2) Excludes ancillary retail leases.
28Integrated Development
Occupancy rate of Integrated Developments
at 96.5%
99.3% 99.0% 99.3% 98.5%
95.6% 92.8%
Raffles City Singapore (1) Funan (2) Plaza Singapura & The Atrium@Orchard (3)
As at 31 March 2020 As at 31 March 2021
Notes:
(1) Retail occupancy is 90.9% and office occupancy is 94.9% as at 31 March 2021.
(2) Retail occupancy is 98.4% and office occupancy is 100.0% as at 31 March 2021.
(3) Retail occupancy is 97.9% and office occupancy is 100.0% as at 31 March 2021.
29Integrated Development
Lease expiry profile(1) as at 31 March 2021
Weighted Average Lease Expiry
5.0 Years
by Monthly Gross Rental Income
23.9%
16.7%
15.5%
10.5%
8.9%
5.7% 5.0%
3.6% 4.3%
3.2%
0.8% 1.5%
0.4%
2021 2022 2023 2024 2025 2026 and
beyond
Retail Office Hospitality
Note:
(1) Excludes gross turnover rents.
30Integrated Development
Restructuring of RC Hotel lease
RC Hotel contributed 5.0% to CICT’s total gross rental income for March 2021
► Effective 1 January 2021
► No change to rent components: minimum
rent, service charge and variable rent
► Lease extended by additional five
years from 2036 to 2041
► Rebalancing fixed and variable
components
► Next rent review: January 2027
31Creating Value
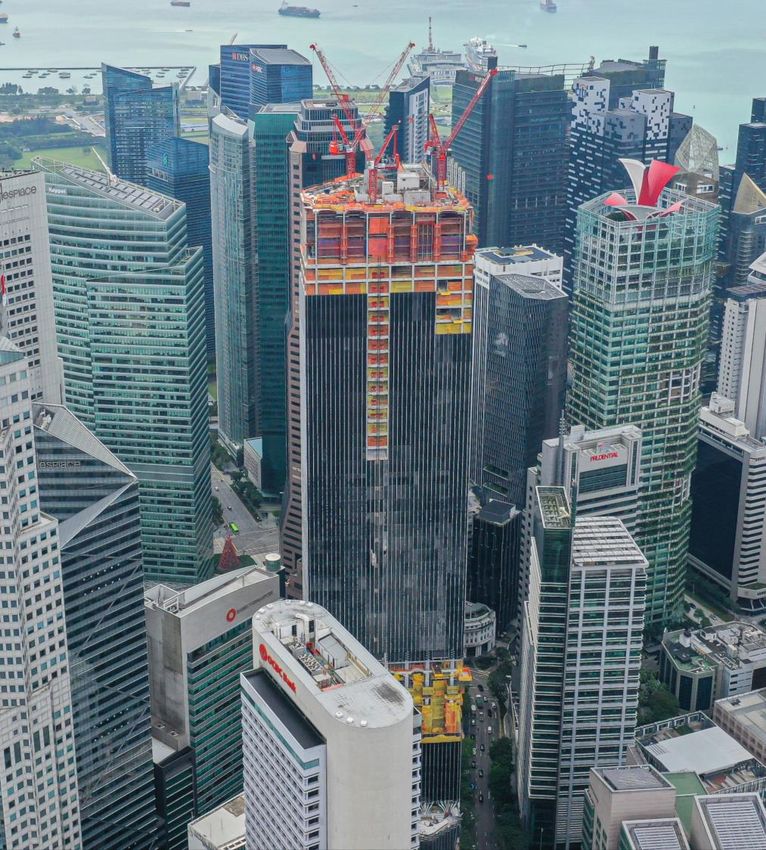
WestgateCapitaSpring on track to complete in 2H 2021;
50% of total NLA inked as at 15 Apr 2021
• Achieved a committed occupancy of 50% as
at 15 April 2021, with another 15% under
advance negotiation
Leasing Breakdown by Sectors based on
committed NLA
Legal, 2%
Real Estate and
Property
Services, 14%
Financial
Services, 14%
Banking, 70%
33CapitaSpring- Development for future growth
CapitaSpring has drawn down S$46.0 mil in 1Q 2021 –
CICT’s 45.0% share amounts to S$20.7 mil
CICT’s 45% interest in
Drawdown (2)
CICT’s 45% interest Glory Office Trust and
as at Mar 2021
Balance
Glory SR Trust
Debt at Glory Office
Trust and Glory SR S$531.0m (S$459.0m) S$72.0m
(1)
Trust
Equity inclusive of
unitholder’s loan
S$288.0m (S$245.3m) S$42.7m
Total S$819.0m (S$704.3m) S$114.7m
CapitaSpring: Artist’s impression and site progress
Notes:
(1) Glory Office Trust and Glory SR Trust have obtained borrowings amounting to S$1,180.0m (100% interest).
(2) Balance capital requirement until 2022.
34Ongoing asset enhancements to complete in
2021
SIX BATTERY ROAD 21 COLLYER QUAY LOT ONE SHOPPERS’ MALL
Artist’s impression: New 24/7 through-block link Artist’s impression: new lift lobby facade Artist’s impression: Expansion of library
✓ Revised target completion end-2021 ✓ 7-year lease to WeWork: ✓ TOP obtained on 29 October 2020
• Lease targeted to commence in and handed over to tenants for
✓ Leasing to be in tandem with 4Q 2021 internal fit-out works
phased works
✓ Achieved BCA Green Mark ✓ Cinema and library expected to
✓ Maintained BCA Green Mark Platinum open in 2H 2021
Platinum
✓ Cost: ~$45 million
✓ Cost: ~$35 million
35Refreshing shopper experience at Raffles City
Singapore
Level 1: New 24-hour café Level 1 and 2: New concept store Level 2: New fashion store
The Coffee Bean and Tea Leaf ONE ASSEMBLY - Collaboration between BHG and Raffles City Singapore PALEM
Basement 1: New F&B offerings Level 3: Online to offline
Tenjin Tarte by Cheryl Koh Hang Heung Lazada pop-up store
36Curating new retail experiences in 1Q 2021
Best Denki at Plaza Singapura Fluff Stack at Westgate Typhoon Café at Bugis+
Café Aux Bacchanales at Plaza Singapura KOMME at Plaza Singapura Levi's® Outlet at IMM Building
37Plan to align Clarke Quay's mall positioning with
upcoming changes in the vicinity
► Ongoing redevelopment of old Liang Court adjacent to
Clarke Quay will have higher residential component
► Clarke Quay tenants more affected by government-
stipulated restrictions on trading hours and sales of alcohol
at nightlife venues like clubs, karaoke joints and bars
without food licenses
► Reviewing asset plan for tenant mix change to be ready Aerial view of the Clarke Quay vicinity
for rejuvenation of the area
► Ongoing marketing plan to attract visitors
✓ Rediscover Clarke Quay via CapitaLand’s promotional
activity, Explore the City, where shoppers can join a walking
tour or participate in food thrills, among others, from 1 April
to 30 June
✓ Leverage Singapore Tourism Board's efforts - Slingshot, a thrill
ride where riders are rocketed almost 70m above ground,
will open in 2H 2021 Artist’s impression of Slingshot at Clarke
Quay. Photo credit: Slingshot
38Engaging our mall & workplace community
Promote CapitaStar loyalty Draw online shoppers to a
Sustainability programme to spur use of platform different offline experience at
and spending at our malls our malls
Earth Hour 2021 Spring to Joy AR Virtual Lion Dance Explore the City
In conjunction with Earth Hour and Earth Day , CapitaLand’s first Augmented Reality Lion Dance Rediscover the wonders of the city circuit
this campaign aimed at rallying our performance where shoppers can enjoy the at CapitaLand malls, with endless layers of
Workspace community to start acting performance and snap a photo to send their surprises and curated experiences waiting
sustainably and encourage creative ways to loved ones personalized CNY Greetings on their to be unravelled! Shoppers can redeem
adopt green habits in our daily routine. mobile devices. Shoppers won over 188,000 sets of their SingaporeRediscover Vouchers to
exciting rewards worth over 20 million STAR$ embark on the featured Civic Colours and
redeemable via the CapitaStar App. Bugis #InstaWAlk Tours by Tribe Tours.
39Future-proofing our retail ecosystem via CapitaStar’s platform
More than Monthly App Traffic
1.1 Million 5.4 Million You can now offset your
A NEW
CapitaStar Members In December 2020
shopping and dining
with eCapitaVouchers
CAPITASTAR and STAR$
EXPERIENCE
Total number of eDeals Redeemed in 2020
Key Highlights
> 13,755,298 More than 560 brands
are now onboard eCapitaMall and Capita3Eats since launch in
Popular Malls Favourite Brands June 2020
Bugis Junction BHG
IMM Building Hai Di Lao
Plaza Singapura Sephora
Raffles City Singapore Uniqlo Most Clarins Most Afuri
Westgate Watsons Popular GameMartz Popular Ajisen Ramen
Brands Muji Brands Nando’s
40Summary
Raffles City SingaporeRoadmap supported by economic recovery
in 2021 Immediate to medium-long term plan:
• Complete ongoing AEIs in 2021
• Complete CapitaSpring redevelopment in 2021
• Proactive leasing and tenant mix repositioning
Enhancing Portfolio • Portfolio reconstitution and capital recycling
Quality • Seek accretive acquisition
• Explore AEI plans for selected existing assets
• Explore redevelopment of selected existing assets (longer planning and execution timeline)
• Limited new supply in the retail and office markets to mitigate any softening demand
Singapore • Poised to benefit from improvement in economic activity and consumer/business sentiment
on the back of the vaccination rollout
Retail and Office
Outlook
• 1Q 2021 GDP growth was 0.2% year-on-year, the first quarterly growth since 4Q 2019(1)
• 2021 GDP growth forecast is 4.0% to 6.0%(1)
• Overall unemployment rate has been falling as the economy recovers, with 3.0% recorded for
Singapore February 2021
Economy
(1) Source: Ministry of Trade and Industry. 42Market
Information
Six Battery RoadRetail
CICT Market Share
Largest owner of private retail stock in Singapore(1)
CICT, 9.2%
Frasers Centrepoint Trust, 4.4%
Mercatus, 4.3%
Far East Organization, 3.3%
Lendlease, 3.0%
Mapletree Commercial Trust, 2.4%
City Developments Limited, 2.2%
Others/Unknown,
65.3% Changi Airport Group, 2.0%
United Industrial Corporation Limited, 2.0%
Suntec REIT, 1.9%
Notes:
(1) Based on the total private stock recorded by Urban Redevelopment Authority (URA).
Sources: URA, CBRE Singapore, 4Q 2020
44Retail
Limited retail supply between 2021 and 2023
• Total retail supply in Singapore averages approximately 0.3 million sq ft (2021 - 2023),
significantly lower than:
― Last 3-year historical annual average supply (2018 - 2020) of 0.86 million sq ft
― Last 5-year historical annual average supply (2016 - 2020) of 1.1 million sq ft
Singapore Retail Supply (million sq ft)
0.5
0.4
0.3 0.2
0.2
0.3 0.09
0.1
0.04 0.1
0.03
0 0.03 0.03
2021 2022 2023
Orchard Downtown Core Rest of Central Fringe Suburban
Source: CBRE Singapore, 4Q 2020
45Retail
Known future retail supply in Singapore (2021 – 2023)
Only two projects with more than 100,000 sq ft NLA located in the suburban area
Expected Proposed Retail Projects Location NLA (sq ft)
completion
2021 Grantral Mall @ Macpherson (Citimac A&A) Macpherson Road 67,500
2021 Shaw Plaza Balestier A/A) Balestier Road 68,900
2021 I12 Katong (A/A) East Coast Road 202,400
Subtotal (2021): 338,800
2022 Boulevard 88 Cuscaden Road/Orchard Boulevard 32,000
2022 One Holland Village Holland Road 86,800
2022 Forest Town (Tengah Estate) Bukit Batok Road 74,100
2022 Sengkang Grand Mall Sengkang Central 58,700
2022 Guoco Midtown Beach Road 30,000
2022 Komo Shoppes Upper Changi Road North/Jalan Mariam 24,800
2022 Club Street Retail/Hotel Development Club Street 21,800
2022 Wilkie Edge (A/A) Wilkie Road 21,200
2022 Le Meridien Singapore (A/A) Beach View 20,500
Subtotal (2022): 369,900
2023 Central Boulevard Towers Central Boulevard 30,000
2023 Dairy Farm Residences Dairy Farm Road 32,300
2023 The Woodleigh Mall Bidadari Park Drive / Upper Aljunied Road 103,800
Subtotal (2023): 166,100
Total forecast supply (2021-2023) 874,800
Sources: URA and CBRE Research
46Retail
Slight Q-o-Q drop in Orchard rents while
Suburban rents remain stable in 1Q 2021
Singapore Retail Rents and Quarterly GDP Growth
15.0% $40.00
$35.00
10.0%
$30.00
5.0%
$25.00
0.0% $20.00
Q1 2021(1)
$15.00
Q1 2011
Q4 2013
Q4 2016
Q3 2019
Q1 2010
Q2 2010
Q3 2010
Q4 2010
Q2 2011
Q3 2011
Q4 2011
Q1 2012
Q2 2012
Q3 2012
Q4 2012
Q1 2013
Q2 2013
Q3 2013
Q1 2014
Q2 2014
Q3 2014
Q4 2014
Q1 2015
Q2 2015
Q3 2015
Q4 2015
Q1 2016
Q2 2016
Q3 2016
Q1 2017
Q2 2017
Q3 2017
Q4 2017
Q1 2018
Q2 2018
Q3 2018
Q4 2018
Q1 2019
Q2 2019
Q4 2019
Q1 2020
Q2 2020
Q3 2020
Q4 2020
-5.0%
$10.00
-10.0%
$5.00
-15.0% $0.00
GDP Q/Q growth Orchard Suburban Linear (GDP Q/Q growth)
Notes:
(1) CBRE revised its basket of prime retail properties in 1Q 2021 by removing some of the older malls in Orchard Road. Subsequent to this change, on a Q-o-Q basis retail rents in Orchard Road dropped
0.2% while the same for Suburban were maintained for 1Q 2021.
Sources: CBRE, Department of Statistics Singapore.
47Retail
Singapore retail sales performance
Retail sales recorded first positive growth following 12 consecutive months of contraction
while online sales proportion remain in low teens for February 2021
(S$ billion)
4.0 30.0%
3.5 3.6
3.5 26.2%
3.2 25.0%
3.1
3.0 2.9
2.8 2.8 2.8 2.8
21.0% 2.7
2.6 20.0% 20.0%
2.5
2.3
2.0 16.3%
2.0 13.4% 12.4% 15.0%
12.6% 12.7%
1.7 12.5% 12.0%
1.5 11.7%
10.5% 10.0%
9.0%
1.0
6.3%
5.0%
0.5
0.0 0.0%
Y-o-Y +0.6% -10.2% -9.7% -32.8% -45.2% -24.2% -7.7% -8.4% -12.7% -11.2% -2.9% -4.5% -8.4% +7.7%
Jan 2020
Jan 2021
Sep 2020
Apr 2020
Oct 2020
Nov 2020
Mar 2020
Dec 2020
Jun 2020
Jul 2020
Aug 2020
Feb 2020
May 2020
Feb 2021
Retail Sales (excl. motor vehicles) Online Sales Proportion
Source: Department of Statistics Singapore
48Office - Singapore
Singapore office stock as at end-2020
Island-wide office stock
Singapore Stock % of Grade A office
(sq ft) total Core CBD
Decentralised, Core CBD, stock
23.23% 50.68%
Core CBD 31.2 mil 50.68% 14.1 mil sq ft
(45.28% of Core
CBD stock)
Fringe CBD 16.1 mil 26.10%
Decentralised 14.3 mil 23.23%
Total 61.6 mil (22.94% of total
Fringe CBD,
island wide stock)
26.10%
Source: CBRE, 4Q 2020
Figures may not add up due to rounding.
49Office - Singapore
Annual new supply averages 0.7 mil sq ft over 5 years;
CBD Core occupancy at 93.9% as at end-March 2021
Singapore Private Office Space (Central Area)(1) – Net Demand & Supply
2.5 Forecast average annual gross new supply
2.2
(2021 to 2025): 0.7 mil sq ft
1.9
2.0 1.8 1.9
1.7 Includes
1.6 1.6 CapitaSpring
1.5 1.4
1.3
sq ft million
1.0 0.9 0.9
1.0 0.8
0.7 0.7 0.8
0.6 0.7
0.5 0.3 0.3
0.2 0.2 0.2 0.2 0.2
0.0
0.0
-0.03
-0.1
-0.2
-0.5 2010 2011 2012 2013 2014 2015 2016 2017 2018 2019 2020 1Q 2021 2021F 2022F 2023F 2024F 2025F
Net Supply Net Demand Forecast Supply
Periods Average annual net supply(2) Average annual net demand
2011 – 2020 (through 10-year property market cycles) 0.8 mil sq ft 0.9 mil sq ft
2016 – 2020 (through 5-year property market cycles) 1.0 mil sq ft 0.9 mil sq ft
2021 – 2025 (forecast gross new supply) 0.7 mil sq ft N.A.
Notes:
(1) Central Area comprises ‘The Downtown Core’, ‘Orchard’ and ‘Rest of Central Area’.
(2) Supply is calculated as net change of stock over the quarter and may include office stock removed from market due to conversi ons or demolitions.
Sources: Historical data from URA statistics as at 1Q 2021; Forecast supply from CBRE Research as at 4Q 2020.
50Office - Singapore
Known future office supply in Central Area (2021 – 2024)
No commercial sites on Government Land Sales Confirmed List (24 Jun 2020); Three white sites (1) on
reserve list, namely Marina View (Central Area), Kampong Bugis and Woodlands Ave 2 (Fringe Area)
Expected Proposed Office Projects Location NLA (sq ft)
completion
2021 Afro-Asia I-Mark Shenton Way 140,000
2021 CapitaSpring(2) Raffles Place 635,000
2021 Hub Synergy Point Redevelopment Anson Road 131,200
Subtotal (2021): 906,200
2022 Guoco Midtown City Hall 650,000
Subtotal (2022): 650,000
2023 Central Boulevard Towers Raffles Place/Marina 1,258,000
Subtotal (2023): 1,258,000
2024 Keppel Towers Redevelopment Tanjong Pagar Road 522,800
2024 Shaw Towers Redevelopment Beach Road / City Hall 407,000
Subtotal (2024): 929,800
Total forecast supply (2021-2024) 3,744,000
Notes:
(1) Details of the three white sites: (a) Marina View: Site area of 0.78 ha, gross plot ratio of 13.0; estimated 905 housing units, 540 hotel rooms and 2,000 sqm commercial space (on reserve list since 4Q
2018); (b) Kampong Bugis: GFA of 390,000 sqm; up to 4,000 housing units and commercial GFA of 10,000 sqm (on reserve list since 4Q 2019);
(c) Woodlands Ave 2: Site area of 2.75 ha, gross plot ratio of 4.2; estimated 440 housing units, 78,000 sqm commercial space (on reserve list since 4Q 2018).
(2) CapitaSpring reported committed take-up at 50% of the development’s NLA as at 15 April 2021.
Sources: URA, CBRE Research and respective media reports.
51Office - Singapore
Grade A office market stable Q-o-Q
1Q 19 2Q 19 3Q 19 4Q 19 1Q 20 2Q 20 3Q 20 4Q 20 1Q 21
Mthly rent (S$ / sq ft ) 11.15 11.30 11.45 11.55 11.50 11.15 10.70 10.40 10.40
% change 3.2% 1.3% 1.3% 0.9% -0.4% -3.0% -4.0% -2.8% 0%
$20
S$18.80
$18
Monthly gross rent by per square foot
$16
S$11.55
$14 S$11.06 S$11.40
$12
$10
S$10.40
$8
$6
S$9.55 S$8.95
$4 S$8.00
$2
S$4.48
Global financial Euro-zone
Post-SARs, Dot.com crash crisis crisis
$0
1Q02
3Q02
4Q02
1Q03
2Q03
3Q03
4Q03
2Q04
3Q04
4Q04
1Q05
2Q05
3Q05
4Q05
2Q06
3Q06
4Q06
1Q07
2Q07
3Q07
1Q08
2Q08
3Q08
4Q08
1Q09
2Q09
4Q09
1Q10
2Q10
3Q10
4Q10
1Q11
2Q11
4Q11
1Q12
2Q12
3Q12
4Q12
1Q13
3Q13
4Q13
1Q14
2Q14
3Q14
4Q14
2Q15
3Q15
4Q15
1Q16
2Q16
3Q16
4Q16
2Q17
3Q17
4Q17
1Q18
2Q18
3Q18
1Q19
2Q19
3Q19
4Q19
1Q20
2Q20
2Q02
1Q04
1Q06
4Q07
3Q09
3Q11
2Q13
1Q15
1Q17
4Q18
4Q 20
1Q 21
3Q 20
Source: CBRE Research (figures as at end of each quarter).
52Office - Germany
Information on Frankfurt and two submarkets
('000 sqm) Frankfurt Office (%)
800.0 16.0
700.0 14.0
600.0 12.0
500.0 10.0
400.0 8.0
300.0 6.4 6.0
200.0 4.0
100.0 2.0
0.0 0.0
2015 2016 2017 2018 2019 2020
Demand ('000 sqm) New Supply ('000 sqm) Vacancy rate (%)
(‘000 sqm) Banking District (%) Airport Office District (%)
(‘000 sqm)
800 16.0 800 16
700 14.0 700 14
600 12.0 600 12
500 10.0 500 10
400 8.0 400 8
300 6.0 300 6.2 6
4.7
200 4.0 200 4
100 2.0 100 2
0 0.0 0 0
2015 2016 2017 2018 2019 2020 2015 2016 2017 2018 2019 2020
Note: Demand for Banking District and Airport Office District is as at 1H 2020.
Source: CBRE Research, 4Q 2020.
53Office - Germany
New office supply in Frankfurt
About 68% and 35% of 2021F and 2022F new supply are owner-occupied or committed
(‘000 sq m)
300
Actual New Supply Forecast New Supply
250
200
5-Year (2016-2020) Average: 145,960 sq m
150
100
50
0
2012 2013 2014 2015 2016 2017 2018 2019 2020 2021F 2022F
Banking District New Supply Airport Office District New Supply Rest of Frankfurt New Supply
Source: CBRE Research, Frankfurt 4Q 2020.
54Office - Germany
Rental range in Frankfurt
Rental range by submarket
Frankfurt
West City CBD
(€ / square metre / month)
C
Westend B
44.0 44.0
D Gallileo
27.0 40.4
Banking
District
23.1
21.7
A5
B43
Niederrad
South
18.0 19.0
7.0
MAC A3 Frankfurt Frankfurt
Airport Office Frankfurt Total
Banking District
District
A (Region D)
(Region A)
ICE S-Bahn Expressway / Highway Weighted average
Source: CBRE Research, 4Q 2020.
55Thank you
For enquiries, please contact: Ms Ho Mei Peng, Head, Investor Relations
Direct: (65) 6713 3668 | Email: ho.meipeng@capitaland.com
CapitaLand Integrated Commercial Trust Management Limited (http://www.cict.com.sg)
168 Robinson Road, #25-00 Capital Tower, Singapore 068912
Tel: (65) 6713 2888 | Fax: (65) 6713 2999You can also read