ASCENDAS REIT 3Q FY2020 Business Updates 26 October 2020 - Investor ...
←
→
Page content transcription
If your browser does not render page correctly, please read the page content below
ASCENDAS REIT 3Q FY2020 Business Updates 26 October 2020

Disclaimers
•   This presentation may contain forw ard-looking statements. Actual future performance, outcomes and results may differ materially from
    those expressed in forward-looking statements as a result of a number of risks, uncertainties and assumptions. Representative examples
    of these factors include (w ithout limitation) general industry and economic conditions, interest rate trends, cost of capital and capital
    av ailability, av ailability of real estate properties, competition from other dev elopments or companies, shifts in customer demands, shifts in
    expected levels of occupancy rate, property rental income, charge out collections, changes in operating expenses (including
    employee w ages, benefits and training, property operating expenses), gov ernmental and public policy changes and the continued
    av ailability of financing in the amounts and the terms necessary to support future business.

•   You are cautioned not to place undue reliance on these forw ard-looking statements, w hich are based on the current v iew of
    management regarding future events. No representation or warranty express or implied is made as to, and no reliance should be
    placed on, the fairness, accuracy, completeness or correctness of the information or opinions contained in this presentation. Neither
    Ascendas Funds Management (S) Ltd (“Manager”) nor any of its affiliates, adv isers or representativ es shall have any liability whatsoever
    (in negligence or otherw ise) for any loss how soever arising, w hether directly or indirectly, from any use of, reliance on or distribution of this
    presentation or its contents or otherw ise arising in connection w ith this presentation.

•   The past performance of Ascendas Reit is not indicativ e of future performance. The listing of the units in the Ascendas Reit (“Units”) on
    the Singapore Exchange Securities Trading Limited (the “SGX-ST”) does not guarantee a liquid market for the Units. The v alue of the Units
    and the income deriv ed from them may fall as well as rise. Units are not obligations of, deposits in, or guaranteed by, the Manager. An
    inv estment in the Units is subject to inv estment risks, including the possible loss of the principal amount inv ested. I nvestors hav e no right to
    request that the Manager redeem or purchase their Units while the Units are listed on the SGX-ST. I t is intended that holders of Units may
    only deal in their Units through trading on the SGX-ST.

•   This presentation is for information only and does not constitute an inv itation or offer to acquire, purchase or subscribe for the Units.

                                                                                                                                                            2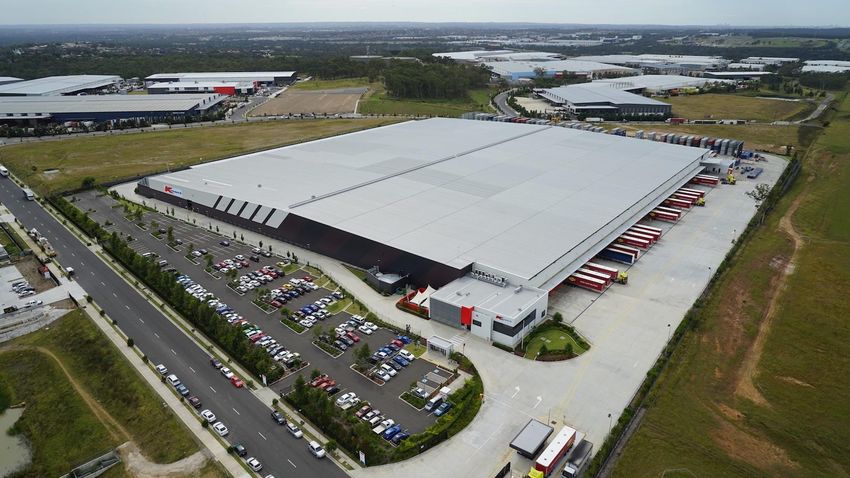
Agenda
3Q FY2020 Key Highlights                          5

Investment Management                             6

Capital Management                                13

Asset Management                                  18

COVID-19 Updates                                  33

Market Outlook                                    36

Appendix: Portfolio Resilience & Sustainability   39

                                                       3
3Q FY2020 Key Highlights

                           ONE@Changi City, Singapore
3Q FY2020 Key Highlights
Asset Management                                                                                   Capital Management

          Portfolio                                   Portfolio                                      Healthy Aggregate                                        High Level of
         Occupancy                                Rental Reversion#                                      Leverage                                            Natural Hedge
            91.9%                                           -2.3%                                                 34.9%                                              >76%
        30 Jun 2020: 91.5%                               2Q FY2020: +4.3%                                     30 Jun 2020: 36.1%                              30 Jun 2020: >77%

  Investment Management

  • Acquired two properties that are under development in Sydney, Australia
    (1 suburban office and 1 logistics property) for S$182.1 m
  • Completed the acquisition of a suburban office at 254 Wellington Road,
    Melbourne, Australia, for S$100.6 m
  • Completed two asset enhancement initiatives worth S$10.1 m
# Percentage change of the av erage gross rent ov er the lease period of the renewed leases again st the p receding av erage gross rent from lease start date. Ta kes into account renewed
leases in multi-tenant buildings that were signed in 3Q FY2020 and av erage gross rents are weighted by area renewed.                                                                        5
Investment
Management

             15378 Avenue of Science
              San Diego, United States
Investment Highlights
  ▪      Completed one acquisition (S$100.6 m) in Australia and two asset enhancement initiatives (S$10.1 m)
  ▪      Announced two fund-through acquisitions (S$182.1 m) in Australia (properties are under development)

                                                                                                            Land and Development    Completion
  3Q FY2020                                                              Country         Sub-segment           Cost / Total Cost
                                                                                                                    (S$m)             Date
  Completed Acquisition                                                                                             100.6
  254 Wellington Road                                          Melbourne, Australia     Suburban Office            100.6(1)         11 Sep 2020
  Acquisitions (under development)                                                                                  182.1

 Lot 7, Kiora Crescent, Yennora                                   Sydney, Australia         Logistics               21.1(2)        2Q 2021 (est.)

 MQX4, Macquarie Park                                             Sydney, Australia     Suburban Office            161.0(3)        Mid 2022 (est.)

 Asset Enhancement Initiatives                                                                                       10.1

 52 & 53 Serangoon North Avenue 4                                        Singapore       Light Industrial            8.5            22 Jul 2020

 197 – 201 Coward Street                                            Sydney, Australia   Suburban Office              1.6(4)         30 Sep 2020

(1)   Based   on exchange rate   of   A$1.000: S$0.9628   as at 31 July 2020
(2)   Based   on exchange rate   of   A$1.00: S$0.89957   as at 31 May 2020
(3)   Based   on exchange rate   of   A$1.000: S$0.9628   as at 31 July 2020
(4)   Based   on exchange rate   of   A$1.000: S$0.9830   as at 30 Sep 2020
                                                                                                                                            7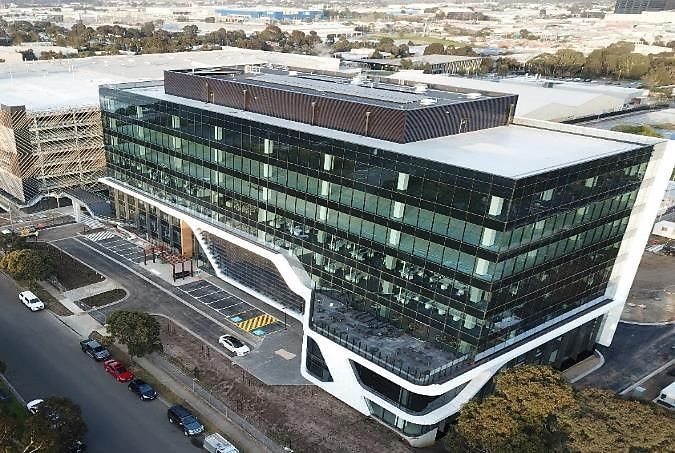
Acquisition (Completed) :
254 Wellington Road, Melbourne, Australia
      Land and Development Costs (1)(2)                                 A$104.5 m (S$100.6 m)
      Acquisition Fee(3) , Stamp duty and                               A$1.3 m (S$1.25 m)
      Other Transaction Costs
      Total Acquisition Cost                                            A$105.8 m (S$101.9 m)
      Vendor/Developer                                                  ESR FPA (Wellington Road) Pty
                                                                        Limited
      Valuation (as if complete basis) (4)                              A$104.5 m (S$100.6 m)
      Land Area                                                         11,113 sqm
      Land Tenure                                                       Freehold
                                                                                                                                         254 W ellington Road, Australia
      Net Lettable Area                                                 17,507 sqm
                                                                                                                            The Property:
      Occupancy Rate (5)                                                100%                                                • The 8-lev el state-of-the-art office w ith 17,507 sqm net
      Key Tenant                                                        Nissan                                                lettable area is expected to achiev e 5-star NABERS energy
                                                                                                                              rating and 5 Star Green Star Design.
      Initial Net Property Income Yield                                 5.9% pre cost (5.8% post cost)                      • Nissan has leased 65.2% of the space for a 10-year lease
                                                                                                                              period and the property will serv e as its head office and
      Completion Date                                                   11 Sep 2020                                           training centre with emphasis on electric v ehicles.
(1)    All S$ amounts are based on exchange rate of A$1.000: S$0.9628 as at 31 July 2020
(2)    Includes incentiv es to be reimbursed by the Vendor.                                                                 Located in innovation precinct:
(3)    In accordance to Ascendas Reit’s Trust Deed, the Manager is entitled to an acquisition fee of 1.0% of the            • Located 21km south east of the Melbourne CBD. Well
       purchase consideration (includes land and dev elopment cost) of the property.
(4)    The v aluation dated 1 Aug 2019 was commissioned by the Manager and The Trust Company (Australia)                      located in one of Australia’s most important innov ation
       Limited, in its capacity as trustee of Ascendas Business Park Trust No. 2, and was carried out by Urbis Valuations     precincts, the Monash Technology Precinct houses
       Pty Ltd , using the capitalisation method and discounted cashflow methods.                                             prestigious research organisations and high-technology
(5)    Physical occupancy is 65.2% (space pre-committed to Nissan). From practical completion date, the Vendor
                                                                                                                              industries.                                      8
       will prov ide a 3-year rental guarantee for any remaining v acant space.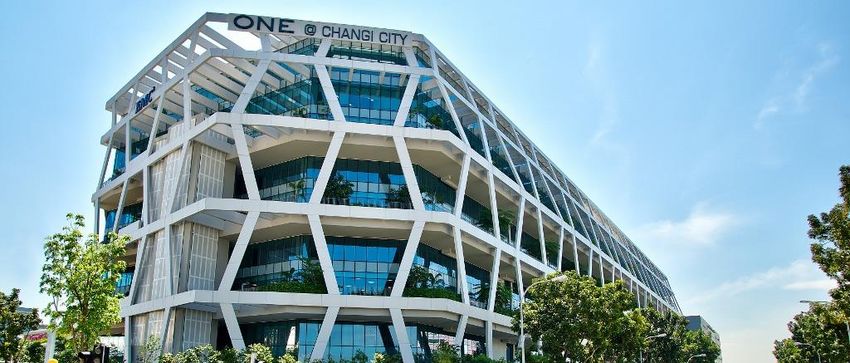
Acquisition :
Lot 7 Kiora Crescent, Yennora, Sydney, Australia
Land and Development Costs(1) (2) A$23.5 m (S$21.1 m)
Acquisition Fee(3), Stamp Duty and
A$1.43 m (S$1.29 m)
Other Transaction Costs
Total Acquisition Cost A$24.93 m (S$22.39 m)
Vendor/Developer Larapinta Project Pty Ltd
Valuation (as if complete basis) (4) A$29.3 m (S$26.4 m)
Land Area 26,632 sqm
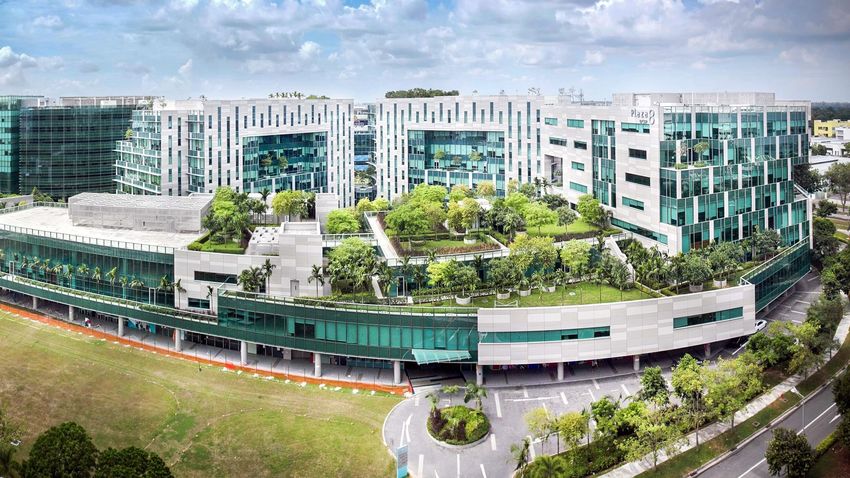
Land Parcel at Lot 7 Kiora Crescent, Yennora, Sydney,
Land Tenure Freehold Australia
Net lettable area 13,100 sq m The Property:
▪ The Property to be dev eloped, is a logistics w arehouse
Occupancy Rate Upon Completion 100%(5)
w ith an approximate lettable floor area of 13,100 sqm.
Initial Net Property Income Yield 6.2% (5.8% post transaction cost) I t is designed to be functional and efficient for a w ide
range of users.
Estimated Practical Completion Date 2Q 2021 ▪ The Property w ill sit on a v acant parcel of freehold
land (26,632 sqm).
(1) Includes 9.5 months of rental guarantee prov ided by the Vendor.
(2) All S$ amounts are based on exchange rate of A$1.00: S$0.89957 as at 31 Mary 2020. Well-Located in Yennora:
(3) In accordance to Ascendas Reit’s Trust Deed, the Manager is entitled to an acquisition fee of 1.0% of the
purchase consideration (which includes land and dev elopment cost) of the property
▪ The Property is w ell located in the established inner-
(4) The v aluation dated 30 Jun 2020 was commissioned by Ascendas Funds Management (Aust ralia) Pty Ltd and w estern Sydney industrial precinct of Yennora, an
Perpetual Corporate T rust Limited (in its capacity as t rustee of Ascendas Lon gbeach T rust No. 10), and was area that enjoys renew ed grow th giv en its proximity to
carried out by Knight Frank NSW Valuation & Adv isory Pty Ltd using the capitalisation and discounted cash flow
methods.
central w estern Sydney and the trend tow ards last
(5) Takes into account rental guarantee. mile logistics.
9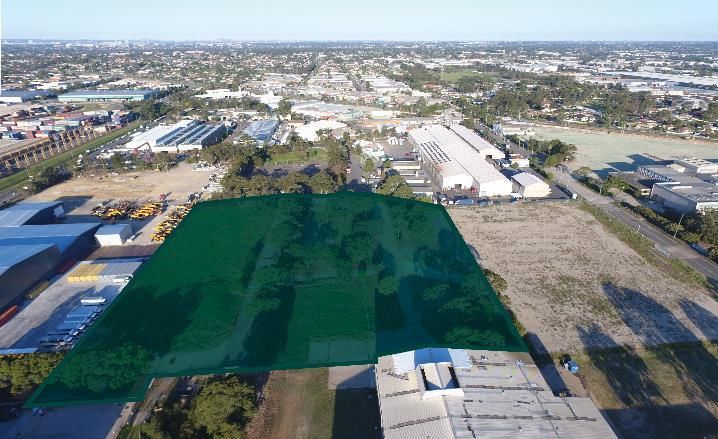
Acquisition :
MQX4, Macquarie Park, Sydney, Australia
Land and Development Costs(1)(2)                                 A$167.2 m (S$161.0 m)
Total Investment Cost (3)                                        A$166.0 m (S$159.8 m)
Vendors/Developers                                               Australand Industrial No. 122 Pty
                                                                 Limited and Winten (No 35) Pty Limited
Valuation (as if complete basis) (4)                             A$167.2 m (S$ 161.0 m)
Land Area                                                        3,308 sqm
Land Tenure                                                      Freehold
                                                                                                                                               Artist’s Illustration of MQX4
Net Lettable Area                                                19,384 sqm    - Office Area: 17,753
                                                                 sqm                                                    The Property:
                                                                               - Retail Area: 1,631 sqm                 • A new 9-storey suburban office building comprising office
                                                                                                                          space, ground floor retail space, and 204 carpark lots.
Occupancy Rate Upon Completion                                   100%(5)                                                • Targeting to achieve 6 Star Green Star Design & As Built
                                                                                                                          rating and 5.5 Star NABERS Energy rating upon
Initial Net Property Income Yield                                6.1% (post transaction cost)                             completion
Estimated Practical Completion                                   Mid-2022
                                                                                                                                           Well-located in Macquarie Park:
Date
                                                                                                                                           • Property is within 100 metres to the Macquarie Park metro
(1)   All S$ amounts are based on ex change rate of A$1.000: S$0.9628 as at 31 July 2020.
(2)   Refers to Base Purchase Consideration and includes rental guarantee from the Developers. The Base Purchase Consideration is
                                                                                                                                             station
      subject to adjustments. Please refer to press release on 18 September 2020 for more details.                                         • The Sydney Metro City Line opening in 2024 prov ides
(3)   Includes coupon received from the developers (Ascendas Reit will fund the construction cost and is entitled to receive monthly
      coupons from the Developer at a rate of 5.75% per annum on the progressive payments made over the construction period ),
                                                                                                                                             seamless trav el to North Sydney and the Sydney CBD
      stamp duty, professional advisory fees, stamp duty and acquisition fee. In accordance to Ascendas Reit’s Trust Deed, the M anager      from Macquarie Park (20 mins to Sydney CBD)
      is entitled to an acquisition fee of 1.0% of the purchase consideration (w hich includes land and development cost). The acquisition
      fee of A$1.672 million is currently estimated based on the Base Purchase Consideration, w hich is subject to adjustment upwards or
                                                                                                                                           • Macquarie Park is home to global players across resilient
      dow nwards. Please refer to press release on 18 September 2020 for details.                                                            industries such as the pharmaceutical, technology,
(4)   The valuation dated 1 Jul 2020 was commissioned by the Manager and The Trust Company (Australia) Limited (in its capacity as
      trustee of Ascendas Business Park Trust No. 3) and w as carried out by Jones Lang LaSalle Advisory Services Pty Limited using the
                                                                                                                                             electronics and telecommunications sectors
      capitalisation and discounted cash flow methods.                                                                                                                                        10
(5)   Takes into account 3-year rental guarantee on vacancies.
Asset Enhancement Initiative (Completed):
52 & 53 Serangoon North Avenue 4, Singapore
Completed works include:
▪ Conversion of roof level to a new
production area to maximise the
Description plot ratio
▪ Enhanced building frontage with
open fencing design
▪ Upgraded drop-off point canopy,
main lobby and toilets
Upgraded canopy at drop-off point Main Lobby Reception
Property Segment Light Industrial
Net Lettable Area 18,894 sqm
Occupancy Rate 52 Serangoon North Ave 4: 100%
(as at 30 Sep 2020) 53 Serangoon North Ave 4: 72.5%
Cost S$8.5 m
Completion Date 22 Jul 2020 Upgraded toilets from Level 1 to 5 Refurbished lift lobby
11Asset Enhancement Initiative (Completed):
197 – 201 Coward Street, Mascot, Sydney, Australia
Completed works include:
Description ▪ New end-of-trip (cyclist) facilities
▪ Landscaping of external garden beds
▪ Outdoor seating area in front of the café
Landscaping Upgrade
Property Segment Suburban Offices
Net Lettable Area 22,534 sqm
Occupancy Rate
86.0%
(as at 30 Sep 2020)
Cost A$1.6 m (S$1.6 m1)
Completion Date 30 Sep 2020
(1) S$ amount is based on ex change rate of A$1.00: S$0.9830 as at 30 Sep 2020 End of Trip Facilities
12Capital Management
Nexus @one-north, SingaporeHealthy Balance Sheet
▪ Aggregate leverage is healthy at 34.9% (1)(2)
▪ Available debt headroom of ~S$4.2 b (1)(2) to reach 50.0% aggregate leverage
▪ Issued S$300m non-call 5 green perpetual securities at 3.00% in Sep 2020
▪ Total assets include cash and equivalent of ~S$289 m to meet current financial and operational obligations
As at As at As at
30 Sep 2020 30 Jun 2020 30 Sep 2019
Total Debt (S$m) (1)(3) 4,809 (2) 4,963 (2) 4,135
Total Assets (S$m) (1) 13,797 (2) 13,739 (2) 11,425
Aggregate Leverage (1) 34.9% (2) 36.1% (2) 36.2%
Unitholders' Funds (S$m) 7,852 7,956 6,938
Net Asset Value (NAV) per Unit 217 cents 220 cents 213 cents
Adjusted NAV per Unit (4) 213 cents 213 cents 205 cents
Units in Issue (m) 3,620 3,620 3,113
(1) Ex cludes the effects of FRS 116.
(2) Includes interests in JV
(3) Ex cludes fair value changes and amortised costs. Borrowings denominated in foreign currencies are translated at the prevailing exchange rates except for JPY/HKD-denominated debt issues, w hich are
translated at the cross-currency sw ap rates that Ascendas Reit has committed to.
(4) Adjusted for the amount to be distributed for the relevant period after the reporting date. 14Well-spread Debt Maturity Profile
▪ Well-spread debt maturity with the longest debt maturing in FY2030
▪ Average debt maturity improved to 3.7 years following the issuance of S$100 m 10-year green bond at 2.65%
▪ S$200 m of committed and ~S$1.3 b of uncommitted facilities are unutilised
0.5%
7.2%
40.7%
1000
841 880 874
900 822
800 154 51.6%
S$ (million)
700 200 325
350
600
500 384
400 325 359
300
300 641 254
472 549
200 192
277 343 359 100
100 254
22 132 100
0 - - - - - -
FY2020 FY2021 FY2022 FY2023 FY2024 FY2025 FY2026 FY2027 FY2028 FY2029 FY2030
Revolving Credit Facilities Committed Revolving Credit Facilities
Term Loan Facilities Medium Term Notes and Euro Medium Term Notes
15Key Funding Indicators
▪ Robust financial metrics that exceed bank loan covenants by a healthy margin
▪ A3 credit rating facilitates good access to wider funding options at competitive rates
As at As at
30 Sep 2020 30 Jun 2020
Aggregate Leverage (1)(2)(3) 34.9% 36.1%
Unencumbered Properties as % of Total Investment
91.5% 92.0%
Properties (4)
Interest Cover Ratio (5) 4.3 x 4.2 x
Net Debt (6) / EBITDA 7.7 x 7.6 x
Weighted Average Tenure of Debt (years) 3.7 3.6
Fixed rate debt as % of total debt 81.9% 80.9%
Weighted Average all-in Debt Cost 2.8% 2.9%
Issuer Rating by Moody’s A3 A3
(1) Based on total gross borrow ings divided by total assets. Correspondingly, the ratio of total gross borrowings (including perp etual securities) to unitholders’ funds is 63.3%.
(2) Ex clude the effects of FRS 116.
(3) Computation includes interests in JV.
(4) Total investment properties ex clude properties reported as finance lease receivable.
(5) Based on the trailing 12 months EBITDA (ex cluding effects of any fair value changes of derivatives and investment properties, and foreign ex change translation), divided by the trailing 12 months interest
ex pense and borrowing-related fees.
(6) Net debt includes lease liabilities arising from FRS 116, 50% of perpetual securities, offset by cash and fix ed deposits.
16High Natural Hedge
▪ Maintained high level of natural hedge for Australia (~76%), the United Kingdom (~100%) and United
States (~100%) to minimise the effects of adverse exchange rate fluctuations
AUD GBP USD
Natural Hedge Natural Hedge Natural Hedge
2.0 A$1.8 b ~76% ~100% ~100%
(S$ 1.8 b)
1.8
1.6 A$1.4 b US$1.0 b US$0.9 b
(S$ 1.3 b)
S$ (billion)
1.4 (S$ 1.3 b) (S$ 1.3 b)
1.2
£0.5 b £0.5 b
1.0
(S$ 0.8 b) (S$ 0.8 b)
0.8
0.6
0.4
0.2
0.0
Total Australia Total Australia Total United Total United Total United States Total United States
Assets Borrowings Kingdom Assets Kingdom Assets Borrowings
Borrowings
17Asset
Management
Infineon Building , SingaporeOverview of Portfolio Occupancy
97.5% 98.4% 95.4% 97.5% 97.5% 97.7%
92.0% 92.1% 91.9% 91.5% 91.0%
88.8% 87.9% 88.1%
N.A.
Singapore Australia United Kingdom United States Total
Sep-20 Jun-20 Sep-19
Gross Floor
2,985,406 828,195 (2) 509,907 (3) 313,059 4,636,567
Area (sqm) (1)
(1) Gross Floor Area as at 30 Sep 2020.
(2) Gross Floor Area for Australia portfolio refers to the Gross Lettable Area/Net Lettable Area.
(3) Gross Floor Area for United Kingdom portfolio refers to the Gross Internal Area. 19Singapore: Occupancy
▪ Occupancy rose to 88.8% mainly due to higher occupancy at Cintech II (30 Sep 2020: 100%, 30 Jun 2020:0%)
and 40 Penjuru Lane (30 Sep 2020: 98.8%, 30 Jun 2020: 85.5%)
As at 30 Sep 2020 30 Jun 2020 30 Sep 2019
Total Singapore Portfolio GFA (sqm) 2,985,406 (1)(2)(3)(4) 3,001,471 (1)(2)(3)(4) 3,003,420 (1)
Singapore Portfolio Occupancy (same store) (5) 88.6% 87.8% 88.2%
Singapore MTB Occupancy (same store) (6) 86.2% 85.0% 85.0%
Occupancy of Singapore Investments
94.5% 93.7% N.A.
Completed in the last 12 months
Overall Singapore Portfolio Occupancy 88.8% 87.9% 88.1%
Singapore MTB Occupancy 86.5% 84.7% 84.6%
(1) Excludes 25 Ubi Road 4 and 27 Ubi Road 4 which were decommissioned for redev elopment since Jun 2019
(2) Excludes 8 Loyang Way 1 which was div ested on 18 Sep 2019.
(3) Excludes 190 Macpherson Road which was div ested on 23 Jan 2020; 202 Kallang Bahru div ested on 4 Feb 2020 and 25 Changi South Street 1 div ested on 6 Mar 2020.
(4) Excludes iQuest@IBP which was decommissioned for redev elopment since Jan 2020.
(5) Same store portfolio occupancy rates for prev ious quarters are computed with the same list of properties as at 30 Sep 2020, excluding new inv estments completed in the last 12 months and
div estments.
(6) Same store MTB occupancy rates for prev ious quarters are computed with the same list of properties as at 30 Sep 2020, excluding new inv estments completed in the last 12 months, div estments
and changes in classification of certain buildings from single-tenant to multi-tenant buildings or v ice-v ersa. 20Australia: Occupancy
▪ Occupancy declined to 97.5% mainly due to non-renewal at 92 Sandstone Place, Brisbane
As at 30 Sep 2020 30 Jun 2020 30 Sep 2019
Total Australian Portfolio GFA (sqm) 828,195 810,536 810,536
Australian Portfolio Occupancy
97.5% 98.4% 95.4%
(same store)(1)
Occupancy of Australian Investments
100% N.A. N.A.
Completed in the last 12 months
Overall Australian Portfolio Occupancy 97.5% 98.4% 95.4%
(1) Same store portfolio occupancy rates for prev ious quarters are computed with the same list of properties as at 30 Sep 2020, excluding new inv estments completed in the last 12 months.
21United Kingdom: Occupancy
▪ Occupancy remained high at 97.5%
As at 30 Sep 2020 30 Jun 2020 30 Sep 2019
Total United Kingdom Portfolio GFA (sqm) 509,907 509,907 509,907
Occupancy of United Kingdom Investments
N.A. N.A. 97.7%
Completed in the last 12 months
Overall United Kingdom Portfolio
97.5% 97.5% 97.7%
Occupancy
22United States: Occupancy
▪ Occupancy remained stable at 92.0%.
As at 30 Sep 2020 30 Jun 2020
Total United States Portfolio GFA (sqm) 313,059 313,059
Occupancy of United States Investments Completed
92.0% 92.1%
in the last 12 months
Overall United States Portfolio Occupancy 92.0% 92.1%
23Singapore: Sources of New Demand in 3Q FY2020
▪ Continues to attract demand from a wide spectrum of industries
2.5% 2.5%
4.7% 2.1% 4.0% 2.4%
7.3% 5.2% 6.6% 4.9% 2.3%
2.7% 1.2% 2.7%
1.2% 2.0%
12.5%
28.2% By NLA
44.9%
60.1%
Government and IO/NGOs/NPOs Logistics & Supply Chain Management
Distributors & Trading Company Engineering
Electronics Biomedical and Agri/Aquaculture
Lifestyle, Retail and Consumer Products Financial & Professional Services
Energy, Chemicals and Materials IT & Data Centers
Note: Customers’ Industry classifications have been updated to better reflect the organisation’s primary industry sector. Previous industry classifications were based on the
24
Singapore Standard Industrial Classification (SSIC) which may be outdated due to changes in business activities.Portfolio Rental Reversions
▪ Average portfolio rent reversion for leases renewed in 3Q FY2020 was -2.3%; YTD was +4.2%.
▪ Expect to achieve a low single digit positive rent reversion in FY2020 in view of the current uncertainties
3Q FY2020 2Q FY2020 3Q 2019
% Change in Renewal Rates for Multi-tenant Buildings (1)
(Jul-Sep 2020) (Apr – Jun 2020) (Jul-Sep 2019)
Singapore -2.8% 4.0% 4.0%
Business & Science Parks 4.5% 16.3% 3.9%
High-Specifications I ndustrial and Data Centres -3.3% -30.6% 3.1%
Light I ndustrial and Flatted Factories -1.4% 5.1% 3.9%
Logistics & Distribution Centres -16.2% 0.5% 7.0%
I ntegrated Dev elopment, Amenities & Retail 0.0% 19.8% 0.0%
Australia - (2) 16.6% -%
Suburban Offices - (2) - (2) -%
Logistics & Distribution Centres - (2) 16.6% -%
United Kingdom - (2) - (2) - (2)
Logistics & Distribution Centres - (2) - (2) - (2)
United States 11.5% 16.2% N.A.
Business Parks 11.5% 16.2% N.A.
Total Portfolio : -2.3% 4.3% 4.0%
(1) Percentage change of the av erage gross rent ov er the lease period of the renewed leases against the preceding av erage gross rent from lease start date. Takes into account renewed leases
that were signed in their respectiv e periods and av erage gross rents are weighted by area renewed. 25
(2) There were no renewals signed in the period for the respectiv e segments.Weighted Average Lease Expiry
(By gross revenue)
▪ Portfolio Weighted Average Lease Expiry (WALE) stood at 3.9 years
WALE (as at 30 Sep 2020) Years
Singapore 3.5
Australia 4.3
United Kingdom 9.0
United States 3.6
Portfolio 3.9
26Portfolio Lease Expiry Profile
(as at 30 Sep 2020) Breakdown of expiring leases
for FY2020 and FY2021
1%
6%
▪ Portfolio weighted average lease to expiry (WALE) of 3.9 years. 2%
▪ Lease expiry is well-spread, extending beyond FY2034 39%
25%
▪ About 2.9% of gross rental income is due for renewal in FY2020 FY2020
▪ Weighted average lease term of new leases (1) signed in 3Q FY2020 was 4.0
years and contributed 2.2% of 3Q FY2020 total gross revenue 10%
17%
21.0%
1% 8%
18.6% 6%
% of Gross Rental Income
16.0% 7% 37%
Multi-tenant Buildings
(Total Portfolio)
FY2021
Single-tenant Buildings 17%
16.9% 10.6%
15.1%
14.8% 11% 13%
6.4% 6.1%
7.7%
2.1% 3.1% 3.3% Business and Science Parks
2.9% 4.4% 3.0% 2.5% 2.5%
0.0% High-Specifications Industrial and Data Centres
1.1% 1.4% 0.5%
1.3% 1.3% Light Industrial and Flatted Factories
2.3% 3.6% 4.0% 4.0% 2.0% 3.3%
2.0% 2.9%
1.9% 0.5% 2.1% 0.7%
0.0% 2.5% Logistics & Distribution Centres
0.6% 1.3% 0.9% 1.1% 0.6% 1.3%
0.0% Integrated Development, Amenities & Retail
> FY34
FY20
FY21
FY22
FY23
FY24
FY25
FY26
FY27
FY28
FY29
FY30
FY31
FY32
FY33
FY34
Logistics & Suburban Offices (Australia)
Logistics & Suburban Offices (United Kingdom)
(1) New leases refer to new, expansion and renewal leases. Excludes leases from new acquisitions.
Business Parks (US) 27Singapore: Lease Expiry Profile
(as at 30 Sep 2020) Breakdown of expiring leases
for FY2020 and FY2021
▪ Singapore portfolio weighted average lease to expiry (WALE) of 3.5 years 12%
▪ Lease expiry is well-spread, extending beyond FY2034 10%
44%
▪ 3.9% of Singapore’s gross rental income is due for renewal in FY2020 FY2020
15%
19%
22.8%
21.7% 22.1%
% of Gross Rental Income (Singapore)
6%
26% 40%
FY2021
Multi-tenant Buildings - SG
19.7%
20.4%
19.5% Single-tenant Buildings - SG
10%
8.3% 17%
4.7% 4.3% Business and Science Parks
3.9% 3.8% 6.4%
1.1% 2.4% 2.2% 2.2% High-Specifications Industrial and Data
3.2% 3.2% 3.6% 0.7% 0.7% 4.3% Centres
2.6% 3.0% 0.2% 1.8% 2.2% 0.0% 0.0% 2.2% Light Industrial and Flatted Factories
1.4% 1.9% 0.2%
0.8% 0.6% 0.7% 0.6% 0.7%
Logistics & Distribution Centres
> FY34
FY20
FY21
FY22
FY23
FY24
FY25
FY26
FY27
FY28
FY29
FY30
FY31
FY32
FY33
FY34
Integrated Development, Amenities &
Retail 28Australia: Lease Expiry Profile
(as at 30 Sep 2020)
▪ Australia portfolio weighted average lease to expiry (WALE) of 4.3 years Breakdown of expiring leases
for FY2021
▪ Lease expiry is well-spread, extending beyond FY2030
20%
FY2021
19.0% 56%
24%
% of Gross Rental Income (Australia)
15.0% 15.3%
Multi-tenant building - AUS
7.5%
13.0% 1.9% Single-tenant building - AUS
11.4%
Sydney
6.9%
9.8% Melbourne
3.1% Brisbane
10.8% 7.5% 6.1%
13.4%
11.5%
3.6% 3.2%
8.1% 2.5%
6.7% 6.1%
4.0% 1.1%
3.6% 3.2%
0.0% 2.2% 2.5%
1.1%
29United Kingdom: Lease Expiry Profile
(as at 30 Sep 2020) Breakdown of expiring leases
for FY2020 and FY2021
▪ United Kingdom portfolio weighted average lease to expiry (WALE) of 9.0 years
▪ Lease expiry is well-spread, extending beyond FY2033
▪ 0.3% of United Kingdom’s gross rental income is due for renewal in FY2020 FY2020
Multi-tenant building - UK
100%
17.9% Single-tenant building - UK 17.4%
% of Gross Rental Income (United Kingdom)
11.0%
45%
FY2021
8.4% 55%
8.0% 8.2%
7.6% 17.9% 17.4%
1.7%
5.6%
4.7% 11.0% 4.4%
3.7%
8.2% 8.4%
7.6%
5.6%
2.2% 6.3% 0.8%
4.7% 4.4% West Midlands
0.3% 2.9%
0.7%
2.2% 0.0% 0.0%
0.3% 0.7% North West
>FY33
FY22
FY25
FY28
FY31
FY20
FY21
FY23
FY24
FY26
FY27
FY29
FY30
FY32
FY33
FY34
30United States: Lease Expiry Profile
(as at 30 Sep 2020) Breakdown of expiring leases
for FY2020 and FY2021
▪ United States portfolio weighted average lease to expiry (WALE) of 3.6 years
▪ Lease expiry is well-spread, extending beyond FY2028 34%
▪ 1.2% of United States’ gross rental income is due for renewal in FY2020 FY2020
66%
% of Gross Rental Income (United States)
23.8%
22.2%
Multi-tenant building - US
Single-tenant building - US
39%
12.6%
FY2021 46%
13.1% 12.7%
21.1%
5.6% 8.0% 15%
7.5%
11.0%
11.3% 3.7% 4.2%
6.7% 3.3% 6.0% San Diego
7.5%
1.2% 3.7% 3.3% 4.2%
1.2% 1.8% 1.3% 1.5% Raleigh
1.1%
Portland
FY21
FY24
FY27
FY29
FY20
FY22
FY23
FY25
FY26
FY28
31Ongoing Projects:
Improving Portfolio Quality
Land & Development Cost / Estimated
Country
Total Cost (S$m) Completion Date
Acquisitions (under development) 182.1
Lot 7 Kiora Crescent, Yennora Sydney, Australia 21.1 2Q 2021
MQX4, Macquarie Park Sydney, Australia 161.0 Mid-2022
Development 181.2
Built-to-suit business park
Singapore 181.2 2Q 2021
development for Grab
Redevelopments 119.3
UBIX (formerly 25 & 27 Ubi Road 4) Singapore 35.0 4Q 2021
iQuest@IBP Singapore 84.3 1Q 2023
Asset Enhancement Initiatives 16.0
Aperia Singapore 1.2 4Q 2020(1)
21 Changi South Avenue 2 Singapore 4.7 1Q 2021
100 & 108 Wickham Street Brisbane, Australia 10.1 4Q 2020
(1) Delayed from 3Q 2020
32COVID-19 Updates
Nordic European Centre, Singapore
33COVID-19 Country Update
Singapore Australia
Government • Government assistance: • Mandatory code of conduct (for SMEs): landlords unable to
Measures ✓ Property tax rebate (Retail/F&B/amenities: 100%, Industrial: 30%) terminate leases/draw on deposits and to offer reductions in
Implemented ✓ For SMEs: additional cash grant (Retail/F&B/amenities: 0.8 months, rent (as waivers or deferrals) based on the tenant’s reduction in
Industrial: 0.64 months) trade during COVID-19, tenants to honour leases
• Landlord assistance, for qualifying SMEs(1) : • Jobkeeper wage subsidy extended by 6 months to Mar 2021
✓ Additional rent waiver (previously to terminate in Sep 2020), but reduced from A$1,500
✓ Instalment repayment scheme for rental arrears; interest capped at 3% to A$1,200 per fortnight
p.a.
• Jobseeker supplement will continue for another 3 months to
• Further S$8b government stimulus announced on 17 Aug 2020 including
Dec 2020 but eligibility requirements tightened
extension of Jobs Support Scheme up to Mar 2021
• Extension of relief period under Part 2 of the COVID-19 (Temporary
Measures) Act(2) by 1 to 5 months (depending on the category of
contract), announced on 12 Oct 2020.
Impact • Qualifying retail/F&B/amenities SME tenants will receive 4 months of base • Suspended rent collection from F&B tenants (COVID-19 Country Update
United Kingdom United States
Government • Up until 31 Dec 2020, landlords are not allowed to terminate leases • Landlords are not allowed to evict tenants due to non-payment
Measures for any missed payments. The UK government has the option to of rents during the moratorium period in Portland, Oregon (until
Implemented extend this if needed. Tenants will still be liable to pay rent i.e. no 31 Mar 2021), San Diego, California (until 30 Dec 2020) and
rent holiday Raleigh, North Carolina (until 20 Dec 2020)
• Deferment of VAT payments for Mar – Jun 2020 to the end of the
financial year
Impact • No rent rebates given to date • Provided rental rebate to one small café operator in Portland
• Allowed some tenants to change their rental payment from • Restructured lease of a tenant whose supply chain was disrupted
quarterly to monthly in advance and some to defer rent payments by COVID-19; rental relief provided in exchange for extension of
to help them with their cashflow management lease term
• Defer the VAT payment by one year to Mar 2021
• Offering available space for short-term leases
Outlook • 2020 GDP forecast: -10.0% (source: Bloomberg) • 2020 GDP forecast: -4.0% (source: Bloomberg)
• To date, no tenant has pre-terminated due to COVID-19 • To date, no tenant has pre-terminated due to COVID-19
• More leasing challenges expected as many interests have been • Majority of our tenants are operating with skeleton crew serving
aborted or put on hold. However, leases in the final stages are essential functions on site, with rest of staff working remotely
continuing to progress • Slowdown in leasing activity as tenants hold back expansion
plans; trend towards shorter-term extensions for near-term
expiries
35Market Outlook
7 Grevillea Street, Sydney, AustraliaMarket Outlook
▪ The International Monetary Fund (IMF) projected global growth for 2020 to be -4.4%, an improvement from
the 4.9% contraction projected in Jun 2020, due to better than expected 2Q GDP performance mostly in
advanced economies.
▪ The Singapore economy contracted 7% y-o-y in 3Q 2020 (2020 GDP forecast: -7.0% to -5.0%). Uneven
recovery is expected as sectors such as manufacturing, technology and financial services should contribute
positively whilst the hospitality and aviation sectors remain challenging.
• Between 2021 and 2024, around 4.4m sqm of industrial space (~8.8% of existing stock) is expected to
be completed.
• Companies remain cautious and are expected to continue to put their business and expansion plans
on hold until there is greater clarity on the COVID-19 situation in Singapore and globally.
• The lacklustre demand coupled with the high amount of new completions are expected to weigh on
rents and occupancy rates for industrial space.
▪ The Australian economy contracted by 6.3% y-o-y in 2Q 2020 (2020 GDP forecast: -3.9%). China and
Australia’s souring relationship will add to the headwinds faced by businesses. The Australian government
announced a stimulus budget that could result in a record A$214b deficit to cut income tax, create jobs
and stimulate the business investment.
• The Australian logistics portfolio continues to deliv er stable performance as they are well-located in key
cities of Sydney, Melbourne and Brisbane, has a long WALE of 4.3 years and enjoys average rent
escalations of ~3% per annum. The logistics sector remains one of the most resilient amongst all major
property sectors.
Source for Singapore GDP growth forecast: MTI. Source for Singapore industrial space statistics: JTC. 37
Source for Australia GDP growth forecast: BloombergMarket Outlook
▪ In 2Q 2020, the UK economy contracted by 21.5 % y-o-y (2020 GDP forecast: -10.0%). The economy
remains fragile amidst challenging Brexit negotiations and rising COVID-19 cases.
• Ascendas Reit’s UK portfolio has a long WALE of 9.0 years, which will help to mitigate the on-going
uncertainties.
▪ The US economy shrank 9.0% y-o-y in 2Q 2020 (2020 GDP forecast: -4.0%). Whilst some economists are
predicting an uptick in 3Q, the high unemployment rate (still above pre COVID-19 levels), resurgence
of COVID-19 cases and US election uncertainties could bring disruption to the economy recovery.
• Ascendas Reit’s properties located in US tech cities are well-positioned to benefit from the
growing technology and healthcare sectors.
▪ Generally, there remains uncertainty worldwide due to the resurgence of COVID-19. The economic
outlook is expected to be challenging and this could impact the performance of Ascendas Reit. The
Manager will continue to work closely with its tenants through these difficult times and keep a close
eye on the changing situation so that we will be able to respond accordingly to protect Unitholders’
interests. Ascendas Reit’s well-diversified portfolio and tenant base should help us to mitigate the
challenges ahead.
38
Source for UK and US GDP growth forecast: BloombergAppendix:
• Portfolio Resilience
• Sustainability
1,3 & 5 Changi Business Park Crescent, SingaporeWell Diversified Portfolio
By Value of Investment Properties Australia, 14%
United Kingdom,
▪ As at 30 Sep 2020, total investment properties 6%
United States,10%
stood at S$12.95 b (198 Properties) Logistics and
Distribution Suburban
Logistics andCentres Australia Offices
Distribution 10% Australia
▪ Well-diversified geographically: Centres United 4%
Kingdom
Business Park US
▪ Singapore portfolio: S$9.03 b Logistics & 6%
10%
Distribution
▪ Australia portfolio: S$1.78 b Centres
Singapore
▪ United Kingdom portfolio: S$0.81 b 9%
Integrated
▪ United States portfolio: S$1.32 b Development,
Amenities &
Total Investment
Retail Properties
6%
~S$12.95 b
Light industrial
▪ Well-diversified by asset class: and Flatted
Factories
Business &
▪ Business & Science Park/ Suburban office: 45% 7%
Science Parks
32%
▪ Industrial: 29% High-
Specifications
▪ Logistics & Distribution Centre: 26% Industrial and
Data Centres
16%
Singapore, 70%
Notes:
Multi-tenant buildings account for 71.9% of Ascendas Reit’s portfolio by asset v alue as at 30 Sep 2020.
Within Hi-Specs Industrial, there are 3 data centres (4.2% portfolio), of which 2 are single-tenant buildings.
Within Light Industrial, there are 2 multi-tenant flatted factories (2.6% of portfolio). 40Customers’ Industry Diversification
(By Monthly Gross Revenue)
▪ Well-diversified customer base across more than 20 industries
Engineering 13.6%
Logistics & Supply Chain Management 12.2%
Biomedical Sciences 10.8%
Information & Communications Technology 9.4%
Financial Services 9.2%
Electronics 8.0%
Government 5.9%
Distributors & Trading Company 5.3%
Data centres 5.2%
Retail 4.8%
Food 4.2% More than
Professional Services 2.9%
Chemical 2.7% 20 industries
Media 1.3%
Textile & Garments 1.1%
Energy/Utilities 0.8%
Education 0.7%
e-Commerce 0.5%
FMCG 0.5%
Hospitality & Leisure 0.4%
Real Estate 0.4%
Agriculture 0.1%
IO/NGOs/NPOs 0.1%
Conglomerate 0.04%
Natural Resources 0.02%
Note: Customers’ Industry classifications have been updated to better reflect the organisation’s primary industry sector. Previous industry classifications were based on the
Singapore Standard Industrial Classification (SSIC) which may be outdated due to changes in business activities.
41Quality and Diversified Customer Base
▪ Total customer base of more than 1,450 tenants
▪ Top 10 customers (as at 30 Sep 20) account for about 17.7% of monthly portfolio gross revenue*
▪ On a portfolio basis, weighted average security deposit is about 5.3 months of rental income.
geographical location(s) of property
* Monthly gross revenue has been adjusted to exclude the government grant related to property tax and rent relief support provided to tenants amid the COVID-19
pandemic. 42Diversified Portfolio
Aperia, 4.5% ONE @ Changi City, 3.1%
12, 14 & 16 Science Park Drive, 3.1% Nucleous, 3.0%
1, 3 & 5 Changi Business Park Crescent, 2.5% Kim Chuan Telecommunication Complex, 2.3%
Neuros & Immunos, 2.1% Pioneer Hub, 2.1%
TelePark, 2.0% 40 Penjuru Lane, 1.9%
TechPlace II, 1.8% The Aries, Sparkle & Gemini, 1.7%
Nexus@One North, 1.5% DBS Asia Hub (Phase I & II), 1.5%
TechPoint, 1.5% Techview, 1.5%
No single property Corporation Place, 1.4% 80 Bendemeer Road, 1.4%
Siemens Centre, 1.2% TechPlace I, 1.2%
accounts for more than The Kendall, 1.2% 31 International Business Park, 1.1%
Carefusion Campus II, 1.1% Techlink, 1.1%
4.5% of Ascendas Reit’s FoodAxis @ Senoko, 1.0% HansaPoint @ CBP, 1.0%
Infineon Building, 0.9% Perimeter 3, 0.9%
monthly gross revenue
* The Galen, 0.9% Cintech III & IV, 0.9%
10 Toh Guan Road, 0.9% 197-201 Coward Street, 0.9%
Nordic European Centre, 0.9% The Capricorn, 0.9%
Giant Hypermart, 0.8% 5200 East and West Paramount Parkway, 0.8%
138 Depot Road, 0.8% Perimeter 1, 0.8%
5005 and 5010 Wateridge, 0.8% 19 & 21 Pandan Avenue, 0.7%
Perimeter 2, 0.7% 7 Grevillea Street, 0.7%
Courts Megastore, 0.7% Changi Logistics Centre, 0.7%
The Alpha, 0.7% LogisTech, 0.7%
108 Wickham Street, 0.7% Perimeter 4, 0.7%
* Monthly gross rev enue has been adjusted to exclude the gov ernment grant
related to property tax and rent relief support prov ided to tenants amid the Pacific Tech Centre, 0.7% 50 Kallang Avenue, 0.6%
COVID-19 pandemic. 43Sustainability Achievements
Aug 2020: Issued first S$100 m Green Bond
Sep 2020: Issued first real estate S$300 m Green Perpetual Securities in Asia (1)
Largest no. of BCA Green Mark Properties amongst S-REITs – 34 Properties
1st industrial building in Largest no. of public Electrical Largest combined solar farm
Singapore awarded Green Vehicle (EV) charging points in by a real estate company in
Mark Platinum Super Low Singapore by S-REIT Singapore
Energy (SLE) status by BCA(2)
LogisTech, Singapore 80 Bendemeer Road, Singapore 40 Penjuru Lane, Singapore
>21,000 solar panels across 6 properties
40 lots across 8 properties providing generating over 10,000 MWh of
Best-in-class energy efficient building high-speed charging solar energy
(1) The Green Bond and Green Perpetual Securities were issued under a newly established Green Finance Framework. Please refer to https://ir.ascendas-reit.com/green_financing.html for details.
(2) Building and Construction Authority, Singapore 44Powering Properties with Renewable Energy
Common facilities' electricity usage at three buildings located at one-north will be 100%
powered with renewable energy generated from Ascendas Reit’s solar farms by 2022
Neuros & Immunos Nexus @one-north Nucleos
By 2020 By 2021 By 2022
Power 1,300 four-room Avoid 2.4 mil
HDB flats for a year kg of CO2
45Building a Green and Sustainable Portfolio
34 Properties with BCA Green Mark Certifications Incorporating Green and Community Spaces
New Developments Existing Properties
12
9
7 Grab’s HQ, Singapore
Fustal courts @ Plaza 8, Singapore
– Green Mark GoldPlus
6
Certified Gold GoldPlus Platinum MQX4, Sydney Australia Collaborative spaces @ The
– 6 Star Green Star Design & As Built* Galen, Singapore
* Target rating
46Thank you
You can also read