FIRST HALF FY20 RESULTS PRESENTATION - 3 February 2020 - Shell Cove, NSW - SCA Property Group
←
→
Page content transcription
If your browser does not render page correctly, please read the page content below
FIRST HALF
FY20 RESULTS
PRESENTATION
3 February 2020

                  slide

                          Shell Cove, NSW
AGENDA
1. OVERVIEW OF FIRST HALF FY20 RESULTS
2. FINANCIAL PERFORMANCE
3. OPERATIONAL PERFORMANCE
4. GROWTH INITIATIVES
5. KEY PRIORITIES AND OUTLOOK
6. QUESTIONS
7. APPENDICES

                                         slide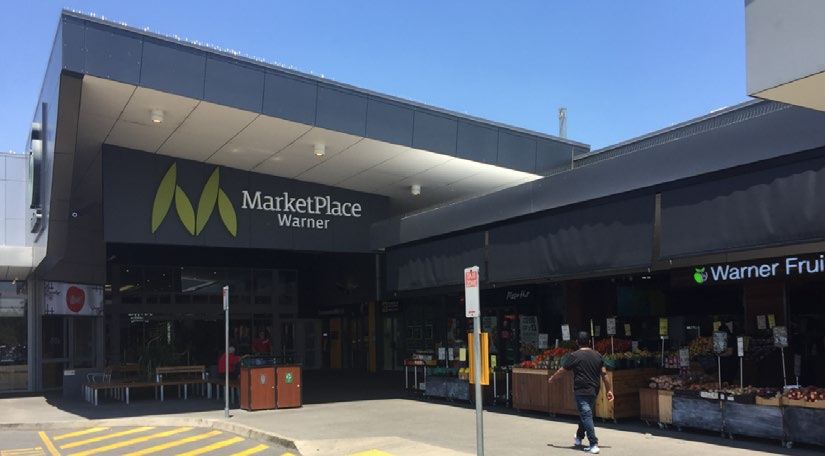
1
OVERVIEW OF
FIRST HALF
FY20 RESULTS
Anthony Mellowes
Chief Executive Officer

                          slide 3
FIRST HALF FY20 HIGHLIGHTS

               FINANCIAL                                                              CAPITAL                                                        ACTIVE PORTFOLIO
             PERFORMANCE                                                            MANAGEMENT                                                         MANAGEMENT

                     FFO per unit 1                                                            Gearing 3                                    Portfolio occupancy 5 Specialty vacancy 5
          8.44 cpu, up by 4.2%                                                    34.2%, up by 1.4%                                                98.3%                            4.8%

                Distribution per unit 1,2                                                  NTA per unit 4                                       Portfolio weighted average cap rate 6
          7.50 cpu, up by 3.4%                                                     $2.29, up by 0.9%                                                               6.46%

                                                                        Weighted cost of              Weighted average
         Funds from operations (FFO) 1                                                                                                                           Acquisitions 7
                                                                            debt 5                     debt maturity 5
          $78.5m, up by 19.1%                                             3.4% pa                          5.6 yrs                                               $78.4m

1.   For the six months ended 31 December 2019 vs six months ended 31 December 2018
2.   Distribution of 7.50 cpu in respect of the six months ended 31 December 2019 was paid on 29 January 2020. “cpu” stands for Cents Per Unit
3.   As at 31 December 2019, compared to 30 June 2019. Gearing is calculated as Finance debt, net of cash (with USD denominated debt recorded as the hedged AUD amount) divided by total tangible assets (net
     of cash and derivatives). Target gearing range is 30% - 40%. Gearing is 32.8% when adjusted for the sale of Cowes, SURF 1 return of capital and underwritten DRP in January 2020
4.   As at 31 December, compared to 30 June 2019
5.   As at 31 December 2019
6.   As at 31 December 2019. Weighted average capitalisation rate as at 30 June 2019 was 6.48%
7.   During the six month period we acquired Warner Marketplace for $78.4 million (excluding transaction costs)

                                                                                                                                                                slide 4
KEY ACHIEVEMENTS
Supermarket anchored convenience centres continue to be resilient
• Our tenants are performing well
– Supermarket and discount department store MAT sales growth has continued to improve over the last six months and
turnover rental growth is increasing
– Specialty MAT sales growth has improved, sales productivity has increased, specialty vacancy has reduced and
occupancy cost is now 9.8%
OPTIMISING THE • Against a backdrop of a softening in the broader retail market, our strategy has continued to be to:
– Improve tenancy mix with a bias toward non-discretionary categories
CORE BUSINESS – Maintain high retention rates on renewals; and
– Reduce specialty vacancy by focussing on difficult long term vacancies
• This strategy will ensure we have sustainable tenants paying sustainable rents, and ultimately support our strategy of
generating defensive, resilient cash flows to support secure and growing long term distributions to our unitholders
– In the last six months, while average leasing spreads were negative and average incentives were higher, we have
achieved a sustainable improvement in occupancy and tenancy mix across the portfolio
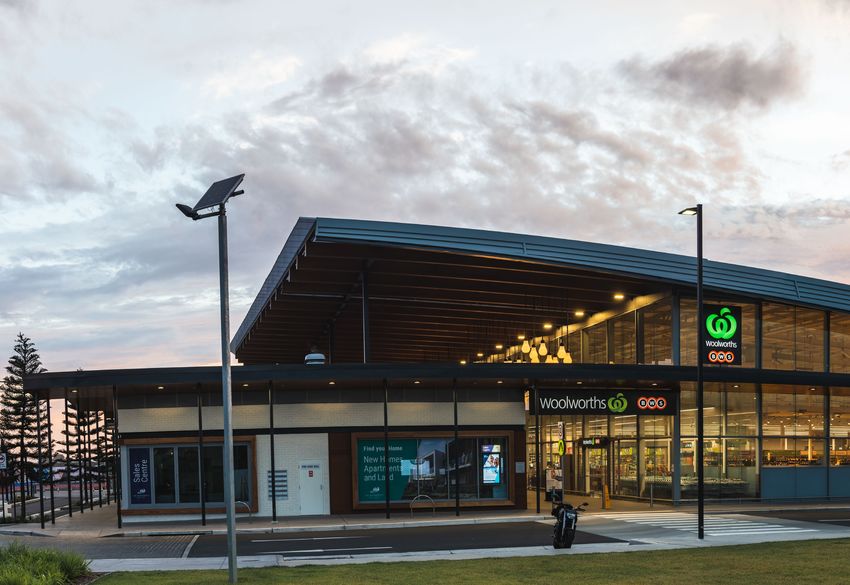
• Acquisition of Warner Marketplace, a Woolworths and Aldi-anchored convenience centre in Brisbane QLD, for $78.4m
(excluding transaction costs) in December 2019
GROWTH • Completion of Shell Cove Stage 3 development (5 additional specialty shops of 396sqm in total) for $4.8m in December 2019
• Agreed to sell Cowes VIC for $21.5m in December 2019 (10% above June 2019 book value), with settlement expected in
OPPORTUNITIES February 2020
• Completed the sale process for the SURF 1 properties for $69.3m, 1.3% above June 2019 book value. Proceeds to be
distributed to SURF 1 unitholders during 2H FY20
• Balance sheet remains in a strong position
– Gearing of 34.2% (within our target range). Gearing is 32.8% when adjusted for the sale of Cowes, SURF 1 return of
CAPITAL capital and underwritten DRP in January 2020
MANAGEMENT – Weighted average cost of debt is currently 3.4%, weighted average term to maturity of debt is 5.6 years, 65.2% of
drawn debt either fixed or hedged
– Cash and undrawn facilities of $145.8m
EARNINGS • 1H FY20 FFO per unit of 8.44 cpu represents growth of 4.2% on the same period last year
GROWTH DELIVERED • 1H FY20 Distribution of 7.50 cpu represents growth of 3.4% on the same period last year
slide 5
2
FINANCIAL PERFORMANCE
Mark Fleming
Chief Financial Officer

                          slide 6
PROFIT & LOSS
For the six months ended 31 December 2019                                                                                                                                     31 Dec   31 Dec
•    Net property income:                                                                                           $m                                                         2019     2018    % Change
                                                                                                                                         3
       –   Gross property income increase primarily due to acquisitions                                             Anchor rental income                                       63.5     56.0     13.4%
       –   Property expenses slightly increased as a percentage of gross property income                                                     3
                                                                                                                    Specialty rental income                                    64.4     53.7     19.9%
           due to larger average centre size and growth of in-house leasing team
                                                                                                                                                         3
                                                                                                                    Recoveries and recharge revenue                            17.4     13.4     29.9%
•    Comparable NOI1 up by 1.6% on the prior year, slightly lower than the prior year growth                                       3
                                                                                                                    Other income                                               5.2      2.6      100.0%
     rate due to execution of strategy in a softening retail market
                                                                                                                    Straight lining and amortisation of incentives             (4.7)    (4.1)    14.6%
•    Distribution income relates to our CQR unitholding. In 1H FY19 we owned 15.5m CQR
                                                                                                                    Gross property income                                     145.8    121.6     19.9%
     units. In 2H FY19 we sold 8.7m units. As at 31 December 2019 our residual CQR
     unitholding is 6.8m units                                                                                      Property expenses                                         (46.6)   (38.4)    21.4%
                                                                                                                    Property expenses / Gross property income (%)   2
                                                                                                                                                                              31.0%    30.5%      0.5%
•    Funds management income includes $0.7m SURF 1 disposal fee
                                                                                                                    Net property income                                        99.2     83.2     19.2%
•    Corporate costs increase primarily due to increase in D&O insurance
                                                                                                                    Distribution income from CQR                               1.0      2.2      (54.5%)
•    Fair value adjustments:                                                                                        Funds management income from SURF funds                    1.3      1.3        -%
        –   Investment properties: fair value gain primarily due to increase in the value of the
            properties acquired from VCX in October 2018
                                                                                                                    Net operating income                                      101.5     86.7     17.1%
        –   Minimal movements in the value of derivatives and foreign exchange due to                               Corporate costs                                            (6.8)    (6.5)     4.6%
            relatively stable interest rate outlook and currency movements
        –   Share of net profit from associates relates to SURF 1, 2 & 3 co-investment stakes                       Fair value of investment properties                        13.6    (28.0)      nm
                                                                                                                    Fair value of derivatives                                  0.7      33.9     (97.9)%
•    Net interest expense:
       –    Average debt drawn (vs December 2018) increased by ~$110m due to                                        Unrealised foreign exchange loss                           0.5     (25.8)      nm
            acquisitions and developments largely offset by decreased interest rates, with                          Share of net profit from associates                        0.4      0.6      (33.3)%
            weighted average cost of debt now down to 3.4% (vs December 2018 of 3.8%)
                                                                                                                    Transaction fees                                             -      (2.2)      nm
                                                                                                                    EBIT                                                      109.9     58.7     87.2%
                                                                                                                    Net interest expense                                      (19.3)   (19.0)     1.6%
                                                                                                                    Tax expense                                                (0.4)    (0.4)      -%
                                                                                                                    Net profit after tax                                       90.2     39.3     129.5%

1.   Comparable NOI growth is the net operating income growth from comparable centres excluding acquisitions, disposals & developments, and excluding the
     income from, funds management income, distribution income and non-cash items such as straight lining and amortisation of incentives
2.   For the purpose of this ratio, gross property income excludes straight lining and amortisation of incentives                                                   slide 7
3.   In prior periods, recoveries and recharge revenue was included in anchor retail income, specialty rental income and other income (due to change in AASB 15
     Revenue from Contracts with Customers)
FUNDS FROM OPERATIONS
For the six months ended 31 December 2019                                            $m
                                                                                                                                           31 Dec       31 Dec
                                                                                                                                            2019         2018    % Change
•   Funds From Operations (“FFO”) of $78.5m is up by 19.1% on the same period        Net profit after tax (statutory)                       90.2         39.3     129.5%
    last year, primarily due to acquisitions completed during 1HFY19
       –   Non-cash and one-off items have been excluded from FFO                    Adjustment for non cash items
•   Adjusted FFO (AFFO) of $70.1m is up by 15.7% on the same period last year        Reverse: Straight lining & amortisation                    4.7      4.2      11.9%
      –   New lease incentives have increased due to higher average incentives and   Reverse: Fair value adjustments
          increased deal volume                                                      - Investment properties                                (13.6)       28.0    (148.6)%
                                                                                     - Derivatives                                           (0.7)      (33.9)    (97.9)%
•   Weighted average units on issue increased primarily due to distribution
    reinvestment plan (5.3m units in August 2019 and 10.6m units in January 2019),   - Foreign exchange                                      (0.5)       25.8    (101.9)%
    institutional placement (113.1m units in October 2018) and unit purchase plan
    (47.9m units in November 2018)                                                   Other adjustments
                                                                                     - Other income                                             (2.1)     -        nm
•   Distribution of 7.50 cpu represents
BALANCE SHEET
As at 31 December 2019
                                                                                                     $m                                                 31 Dec 2019    30 June 2019   % Change
•    Value of investment properties increased from $3,147.0m to $3,232.8m, primarily                 Cash                                                   3.8            4.2         (9.5)%
     due to:
       –    Acquisition of Warner Marketplace for $78.4m, completion of Shell Cove                   Assets - held for sale                                21.5             -            nm
            Stage 3 development for $4.8m, and partially offset by disposal of Cowes
            property for $21.5m (June 2019 book value of $19.6m)                                     Investment properties                                3,232.8        3,147.0        2.7%
       –    Valuation uplift on like-for-like properties. The properties acquired from
            VCX increased by $17.8m to $594.2m vs the acquisition price of $573.0m                   Investment in CQR                                     28.9            29.6        (2.4)%
       –    Portfolio weighted average capitalisation rate is now 6.46% (sub-regionals
                                                                                                     Other assets                                          203.3          191.4         6.2%
            6.74% and neighbourhoods 6.36%) vs 6.48% in June 2019
       –    Portfolio investment property valuation implies $1,584 per square metre of               Total assets                                         3,490.3        3,372.2        3.5%
            aggregate land area
                                                                                                     Debt                                                 1,222.2        1,137.5        7.4%
•    Investment in CQR of 6.8m units held at its closing price on 31 December 2019 of
                                                                                                     Accrued distribution                                  69.9            69.0         1.3%
     $4.27 per unit
                                                                                                     Other liabilities                                     60.7            61.8        (1.8)%
•    Other assets includes derivative financial instruments with a mark-to-market
     valuation of $127.2m, SURF 1, 2 & 3 co-investment of $18.0m, receivables of                     Total liabilities                                    1,352.8        1,268.3        6.7%
     $39.1m (including $8.0 m receivable due to SURF 1 capital return in January                     Net tangible assets (NTA)                            2,137.5        2,103.9        1.6%
     2020) and other assets of $19.0m
                                                                                                     Number of units (period-end)(m)                       931.8          925.6         0.7%
•    NTA per unit increased by 0.9% to $2.29, due to investment property uplift mostly
     associated with the properties acquired from VCX in October 2018
                                                                                                     NTA per unit ($)                                      2.29            2.27         0.9%
                                                                                                     Corporate costs                                      (14.0)1         (13.1)        6.9%
•    SURF assets under management and co-investment includes $115.0m of
     properties in SURF 2 and 3, and $38.6m of cash in SURF 1 (to be distributed to                  External funds under management
     SURF 1 unitholders in the current calendar year). Remainder of $2.9m includes                   - SURF 1, 2 & 3 assets under management               156.5          186.4        (16.0)%
     receivables and other assets of SURF 1, 2, and 3
                                                                                                     - Less: SURF 1, 2 & 3 co-investment                  (18.0)          (26.5)       (32.1)%
•    MER increased to 39bps due to increased corporate costs primarily due to
     increase in D&O insurance                                                                       Assets under management                              3,628.8        3,532.1        2.7%
                                                                                                     MER2 (%)                                             0.39%           0.37%        0.02%

1.   Full year FY20 forecast
2.   MER stands for “Management Expense Ratio” and is calculated as Corporate Costs divided by Assets Under Management at year end (including SURF 1,
     SURF 2 and SURF 3). Bps stands for basis points.
                                                                                                                                                             slide 9
DEBT AND CAPITAL MANAGEMENT
 As at 31 December 2019
                                                                                                                                                                                 31 Dec 2019 30 June 2019
•    Gearing of 34.2% is within target range of 30% to 40%. Our preference is for gearing to                           Facility limit ($’m) 1                                         1,307.1            1,257.1
     remain below 35% at this point in the cycle
       –   Look through gearing (including CQR and SURF investments) is 34.7%                                          Drawn debt (net of cash) ($’m) 2                               1,150.3            1,064.9
       –   Gearing is 32.8% when adjusted for the sale of Cowes, SURF 1 return of capital
           and underwritten DRP in January 2020
                                                                                                                       Gearing (%) 3                                                      34.2             32.8
                                                                                                                       % debt fixed or hedged                                             65.2             70.4
•    Key movements in debt during the period:
       –  Bank debt: we increased $50.0m bilateral bank debt facilities expiring in FY23                               Weighted average cost of debt (%)                                   3.4               3.6
                                                                                                                       Average debt maturity (yrs)                                         5.6               6.1
•    The earliest debt expiry is the A$MTN of $225.0m in April 2021. It is expected that the
     MTN will be initially repaid mainly from existing undrawn debt and cash of $145.8m                                Average fixed / hedged debt maturity (yrs)                          4.3               4.8
     together with funds raised from the sale of Cowes for $21.5m, underwriting the
                                                                                                                       Interest cover   ratio4                                            4.6x             4.3x
     distribution paid in January 2020 (raised $27.9m) and other activities

•    Weighted cost of debt reduced from 3.6% to 3.4% due to declining BBSW rates.
     Average debt maturity has decreased to 5.6 years as there have been no changes in the                               Debt Facilities Expiry Profile ($m)
     debt profile since June 2019. Average fixed maturity has decreased to 4.3 years as there
     have been no changes in the hedging profile since June 2019                                                                                             225.0                  Bank debt undrawn
                                                                                                                         300                       142.0                            Bank debt drawn
•    We are well within debt covenant limits of less than 50% gearing and interest cover ratio
                                                                                                                         250                                                        MTN
     (ICR) greater than 2.0x                                                                                                               225.0
                                                                                                                         200                                                        USPP

                                                                                                                         150
                                                                                                                                                                     100.0 106.5          103.3
                                                                                                                                                                                                  92.1
                                                                                                                         100
                                                                                                                                                   133.0                                                  65.8
                                                                                                                           50                                                      39.4
1.   Facility limit is the bank debt of $450.0m (including bilateral bank facility limits of $350.0m plus $100.0m syndicated
     non revolving facility) plus USPP A$ denominated facility of $50.0m plus the USPP US$ denominated facilities at                                         75.0
     A$357.1m (being made up of USPP2014 US$ denominated facility at A$159.8m and the USPP2018 US$                              0
     denominated facility at A$197.3 (both being the AUD amount received and hedged in AUD)), plus the A$ MTN
     issuance of $450m.
                                                                                                                                    FY20 FY21 FY23           FY24 FY26 FY28 FY29 FY30 FY32 FY34
2.   Drawn debt (net of cash) of $1,150.3 is made up of: statutory debt of $1,222.2m less $69.7m (being the revaluation
     of the USPP US$ denominated debt from statutory value of $426.8m (using the prevailing December 2019 spot
     exchange rate) to restate the USPP to its hedged value of A$357.1m (refer note 1 above) plus unamortised debt
     fees and MTN discount of $1.6m less $3.8m cash
3.   Gearing calculated as drawn debt (net of cash) of $1,150.3m (refer note 2 above), divided by total tangible assets (net of cash and derivatives)
     being total assets of $3,490.3m less cash of $3.8m less derivative mark-to-market of $127.2 = $3,359.3m
4.   Interest cover ratio is calculated as calendar year Group EBIT $219.9m less unrealised and other excluded gains and losses of $38.2m, divided
     by calendar year net interest expense of $41.1m                                                                                                                  slide 10
5.   Cash and undrawn facilities is made up of facility limit of $1,307.1m less drawn debt net of cash of $1,150.3 less $11.0m of debt facilities used for
     bank guarantees
3
OPERATIONAL PERFORMANCE
Anthony Mellowes
Chief Executive Officer
slide 11PORTFOLIO OVERVIEW
Weighting towards food, health and retail services (non-discretionary)
As at 31 Dec 2019 Number of Number of GLA Site Area Occupancy Value WALE Weighted average
centres specialties (sqm) (sqm) (% GLA) ($m) (yrs) cap rate (%)
Neighbourhood 75 1,292 465,521 1,495,916 98.3% 2,384.7 7.5 6.36%
Sub-regional 10 516 208,868 545,090 98.4% 848.1 7.8 6.74%
85 1,808 674,389 2,041,006 98.3% 3,232.8 7.6 6.46%
Asset held for sale 1 14 4,820 14,160 98.0% 21.5 10.3
86 1,822 679,209 2,055,166 98.3% 7.6 6.46%
Tenants by Category (by gross rent)1 Specialty Tenants by Category (by gross rent)1,2 Geographic Diversification (by value)
Other Retail 11% WA
Woolworths3 28% 15%
Petrol 2% NSW
Fresh Food/Food 24%
Catering/Liquor 32%
Discount Variety 6%
VIC
19%
Specialties 52% Apparel 8%
Big W 5%
Coles 11% TAS QLD
Pharmacy & Health 11% 25%
Care 20% Services 21%
Wesfarmers4 3% SA
Other major5 1%
6%
1. Annualised gross rent excluding vacancy and percentage rent
2. Mini Majors represent 12% of annualised specialty gross rent. Mini major tenants have been split across the relevant categories
3. Woolworths includes Endeavour Drinks (1.6% of gross rent)
4. Wesfarmers includes Kmart 2.1%, Bunnings 0.5% and Target 0.4% slide 12
5. Other majors includes Aldi, Farmer Jacks and Grand CinemasPORTFOLIO OCCUPANCY
Specialty vacancy has reduced
Portfolio Occupancy (% of GLA)
• Strategic focus on remixing toward non-discretionary categories, reducing long term
vacancies and maintaining the retention rate on existing tenant renewals 98.6% 98.4% 98.4% 98.2% 98.3%
• Total portfolio occupancy has improved to 98.3% of GLA
– Specialty vacancy has reduced to 4.8% (from 5.3% as at June 2019), within
target range of 3-5%
– Long term stability of portfolio occupancy illustrates the resilience of the portfolio
– Refer to slide 31 for a comparison between existing and FY19 acquisition
centres
• Specialty tenant holdover on total portfolio is 0.9% (down from 1.0% at June 2019)
• Anchor tenant expiries in 2020: June 2016 June 2017 June 2018 June 2019 Dec 2019
– The Markets Coles in October 2020: 2 x 5-year options (10 years in total) have
been exercised, 3 x 5yr options remaining
– West End Plaza Coles in November 2020: we are finalising terms for new lease
– West End Plaza Kmart in November 2020: we are finalising terms for new lease Overall Lease Expiry (% of Gross Rent)
29.3%
• Continued active management of lease expiry profile. Around 10% overall lease
expiry per annum is consistent with c.50% of income from specialty tenants with 5-
year leases
12.0% 10.9%
10.0% 9.1%
7.2% 7.3%
5.5% 4.5% 4.2%
FY20 FY21 FY22 FY23 FY24 FY25 FY26 FY27 FY28 FY29
and
Beyond
slide 13SALES GROWTH AND TURNOVER RENT
Sales growth in our centres is increasing
• Supermarket portfolio MAT1 sales growth has improved to 2.6% (June 2019: 2.0%) Comparable Store MAT1 Sales Growth by Category (%)
– Both Coles and Woolworths showing an increased rate of growth
As at As at
• Discount Department Store (DDS) portfolio MAT sales growth has accelerated to Total Portfolio
31 Dec 2019 30 June 2019
3.4% (June 2019: 2.2%)
– Big W continues to perform positively with sales steadily increasing Supermarkets 2.6% 2.0%
• Mini Majors portfolio MAT sales appear to be stabilising DDS 3.4% 2.2%
– Discount variety category continues to be impacted and the apparel
category continues to underperform Mini Majors (1.0%) (3.1)%
• Specialty portfolio MAT sales has increased to 2.3% (June 2019: 1.8%) Specialties 2.3% 1.8%
– Non-discretionary categories MAT growth was 3.1%, continuing to outperform
discretionary categories at 0.8% Total 2.6% 1.9%
– Discretionary categories such as apparel and leisure are continuing to feel the
pressures from competition and online
– Our core categories of Food/Liquor at 2.7% (June 2019: 2.2%), Retail Services Turnover Rent ($m)
at 5.1% (June 2019: 3.6%) and Pharmacy at 3.0% (June 2019: 1.2%) continue
to perform strongly 1.30
– Neighbourhood centres MAT growth was 2.8%, continuing to outperform our
1.10 0.20
Sub Regional centres which grew by 1.5%
• Turnover rent continues to increase: 0.70
– 34 anchor tenants paying turnover rent as at 31 December 2019 (30 0.60 0.65 Crystallised into Base Rent
supermarkets, 2 Kmart's and 2 Dan Murphy’s) – represents 30% of portfolio Total Portfolio
anchors paying turnover rent 1.10
– Another 14 supermarkets are within 10% of their turnover thresholds
– 3 anchor tenant turnover rents crystallised to base rent during the year
• The sales numbers on this slide are for the total portfolio. Please refer to slide 31 for a 1H FY16 1H FY17 1H FY18 1H FY19 1H FY20
breakdown between existing and acquired centres 15 Anchors 16 Anchors 20 Anchors 34 Anchors 34 Anchors
1. Moving annual turnover sales growth measures the growth in sales over the last 12 months compared to the previous 12 month
period slide 14SPECIALTY KEY METRICS
Executing our strategy in a challenging retail market
• Strong metrics for specialty tenants:
– Sales growth increasing to 2.3% (June 2019: 1.8%) Specialty Tenant Metrics
– Sales productivity increased to $8,134 psm (June 2019: $8,010 psm)
– Our rents remain the lowest in the sector at $772 psm Total Portfolio 31 December 2019 30 June 2019
– Occupancy cost reduced to 9.8% (June 2019: 10.1%)
Comparable sales MAT growth (%)1 2.3% 1.8%
• Against a backdrop of a softening in the broader retail market, our strategy has been:
– Maintain a high retention rate on renewals: up to 78% for the six months to Average specialty occupancy cost (%)1 9.8% 10.1%
December 2019 (compared to 77% for the 12 months to June 2019) Average specialty gross rent per square
Reduce specialty vacancy by doing a significantly increased volume of deals $772 $772
–
metre
on difficult long term vacancies: 86 new deals done in six months to
December 2019 (vs 87 in the 12 months to June 2019) Specialty sales productivity ($ per sqm)1 $8,134 $8,010
– Remix toward non-discretionary categories
• While average leasing spreads were negative and average incentives were higher, 6 months to 12 months to
Renewals
we have achieved a sustainable improvement in occupancy and tenancy mix across 31 December 2019 30 June 2019
the portfolio. We are still maintaining 3%-4% annual fixed increases for 85% of Number 135 215
specialty tenants, and we remain on track to achieve FY20 comparable NOI growth
forecast of 1.6% Retention (%) 78% 77%
• The numbers on this slide are for the total portfolio. Please refer to slide 32 for a GLA (sqm) 19,134 26,455
breakdown between existing and acquired centres Average uplift (%) (1.7)% (1.7)%
Specialty Lease Composition (as at 31 December 2019) Incentive (months) 0.3 -
Annual Increase Mechanism Tenant Type
Other, 2% 6 months to 12 months to
New Leases
31 December 2019 30 June 2019
CPI, 13% Number 86 87
National / GLA (sqm) 12,240 12,200
Regional,
Local, 39% 61% Average Uplift (%) (3.9)% 4.9%
Incentive (months) 15.9 11.0
Fixed, 85%
slide 15
1. Sales growth, occupancy cost and sales productivity metrics only include sales reporting tenants trading over 24 months4
GROWTH INITIATIVES
Anthony Mellowes
Chief Executive Officer
slide 16PORTFOLIO MANAGEMENT
One acquisition, one completed development and one disposal in the six months to 31
December 2019
ACQUISITION DEVELOPMENT
Warner Marketplace (Warner, QLD) Shell Cove – Stage 3 (Shellharbour,
NSW)
• Acquisition completed in Dec 2019
for $78.4m (5.92% implied fully let
• Stage 3 refers to a main street strip
yield excluding balance of land)
of retail comprising five tenancies
situated directly across from the
• Anchored by Woolworths and Aldi
SCP owned Shell Cove
supermarkets with 37 specialty
Neighbourhood centre
tenancies, 2 Kiosks, 2 ATM’s and 5
freestanding tenancies • Development completed in Dec
2019 for total consideration of $4.8m
• % of income from Anchors: 34% (6.25% implied fully let yield)
• Asset will form part of the existing
• Overall WALE: 6.4 years
Shell Cove Neighbourhood Centre
• Occupancy at acquisition: 96% • Two year rental guarantee for any
vacancy
• Built: 2001; Expanded: 2014
DISPOSAL
Cowes, VIC: Contracts were exchanged on 3 December 2019 for a sale price of $21.5m, reflecting a $1.9m (9.7%) uplift on June 2019 book value (yield of 6.85%)
slide 17CONVENIENCE BASED CENTRES
Fragmented ownership provides acquisition opportunities
CONVENIENCE BASED CENTRE LANDSCAPE
Ownership of Convenience Based Centres
• There are approximately 1,200 Coles and Woolworths anchored (number of centres)
neighbourhood and sub regional centres in Australia Indicative
ISPT VCX
CQR Syndicates, Funds
• SCP is the largest owner (by number) of neighbourhood and sub regional & Other
SCP Institutions
centres in Australia. SCP has an opportunity to continue to consolidate this
fragmented segment by utilising its management capability, industry
knowledge and funding ability to source and execute acquisition
opportunities from private and corporate owners
• Since listing SCP has completed the acquisition of 50 neighbourhood and
sub regional centres for over $1.7b and has divested 31 freestanding and
neighbourhood centres for over $500m Private
RECENT TRANSACTIONS
• During the half year ended 31 December 2019:
HY20 Buyers HY20 Sellers
– 17 neighbourhood centres changed hands for total consideration of
(by value) (by value)
SCP
~$700m 10%
– 1 sub regional centre changed hands for total consideration of
Private Private Institutions
~$100m 54% 51%
Institutions 45%
19%
• More institutional sellers, while syndicates and privates remain active on
the buy side for neighbourhood centres
Syndicates
Syndicates & Funds
• SCP acquired one property over the half year, making up approximately 4%
& Funds
10% of total known transactions over the period 17%
slide 18
Source: Management estimatesINDICATIVE DEVELOPMENT PIPELINE
Over $115m of development opportunities identified at 31 of our centres
over the next 5 years1
Estimated Capital Investment (A$m)
1HY20
DEVELOPMENT TYPE CENTRE(S) Actuals 2HY20 FY212 FY22 FY23 FY24
Shell Cove, Epping North, Belmont, North Orange, Warner
Centre expansions Marketplace, Wyndham Vale, Northgate, Central Highlands,
5.5 3.0 11.7 18.3 20.1 21.7
Gladstone, Greenbank, Jimboomba, Mackay, Ocean Grove
Supermarket expansions Treendale, West Dubbo
- - - 0.5 4.0 -
Burnie, Ocean Grove, Oxenford, The Markets, New Town
Plaza, West End Plaza, Riverside, Shoreline, The Gateway,
Centre improvements
Whitsunday SC, Sturt Mall, Meadow Mews, Griffin Plaza, 0.7 9.9 14.2 6.3 2.3 2.3
Warnbro, Sugarworld, Wonthaggi, Northgate, Kingston
Preliminary & Defensive Various
- 0.3 0.3 0.3 0.3 0.3
Total
6.2 13.2 26.2 25.4 26.7 24.3
Shell Cove Stage 3 completed in 1H FY20. The major projects in 2H FY20 are: The Markets, Epping North & Oxenford
1. The exact timing of future developments, expansions and improvements are subject to prevailing market conditions and regulatory approvals
2. The $10m acquisition cost for the additional land at Greenbank occurring in December 2020 has been excluded from the Indicative slide 19
Development PipelineFUNDS MANAGEMENT BUSINESS – AUM$156.5M
Potential to deliver additional earnings growth in the future
• First fund “SURF 1” was launched in October 2015, and has successfully sold the five
assets, consistent with 5-year term set out in the original PDS
– Achieved sales price for the five assets of $69.3m (vs original cost of $60.9m and
June 2019 book value of $68.4m)
– IRR expected to be in excess of 10%, with potential performance fee to be realised
once full proceeds are distributed to unitholders
– The wind-up process will be completed during calendar year 2020
• Second and third funds performing in line with expectations
– “SURF 2” launched in June 2017 Moama Marketplace, NSW (SURF 3)
– “SURF 3” launched in July 2018
• Fee structure for all funds is the same1
– Establishment Fee: 1.5% of total asset value
– Management Fees: 0.7% of total asset value per annum
– Disposal Fee: 1.0% of assets disposed
– Performance Fee: if the equity IRR exceeds 10%, SCP will receive 20% of the
outperformance
• No new funds are forecast for FY20. We will continue to monitor the retail and institutional
market appetite for new product
• The funds management business will continue to allow SCP to recycle non-core assets, Warrnambool Target, VIC (SURF 3) Swansea Woolworths, NSW (SURF 3)
and utilise its expertise and platform to earn management fees in the future (subject to
market conditions)
Woodford Woolworths, QLD (SURF 3)
Woolworths and Big W, Katoomba (SURF 2) Dan Murphy’s, Mittagong (SURF 2)
slide 20
1. SCA may defer fees, or rebate a portion of its fees to wholesale clients, at its discretion5
KEY PRIORITIES AND OUTLOOK
Anthony Mellowes and Mark Fleming
Chief Executive Officer & Chief Financial Officer
slide 21CORE STRATEGY UNCHANGED
Defensive, resilient cashflows to support secure and growing long term distributions to
our unitholders
WEIGHTED TO
FOCUS ON CONVENIENCE- LONG LEASES TO
NON-DISCRETIONARY
BASED RETAIL CENTRES QUALITY ANCHOR TENANTS
RETAIL SEGMENTS
APPROPRIATE GROWTH
CAPITAL STRUCTURE OPPORTUNITIES
slide 22SUSTAINABILITY
We continue to focus on long-term sustainable performance
SCP remains on track to deliver our sustainability targets with dedicated
resourcing and focus on the 3 pillars of our strategy
Our Sustainability Objectives
SCP achievements during this period:
Strengthen the relationships between
Stronger Communities our shopping centres and their local
• Planning and delivery on our commitment to roll out stronger
1 STRONGER
COMMUNITIES
communities and help improve the
wellbeing and prosperity of those
communities campaigns across all our centres in FY20
communities
Environmentally Efficient Centres
• Set up a specific sustainability development capex project to drive
investment in sustainability initiatives that generate acceptable returns
Reduce the environmental footprint
2
Solar panels operational across 5 centres. Expansion in
–
capacity of renewable energy for both our centres and our
ENVIRONMENTALLY of our shopping centres, particularly
tenants EFFICIENT CENTRES greenhouse gas emissions through
reducing energy consumption
– Installation of a further 2 Building Automation Systems for
management of air conditioning, lighting and energy demand
– Ongoing discussions and trials for the onsite processing of food
organics waste. Exploring how we can efficiently implement
waste diversion practices across the portfolio for specialty Manage environmental, social and
governance (ESG) risks that are
3 RESPONSIBLE
tenants and common mall area organic waste
material to investment value and
INVESTMENT communicate our performance
Responsible Investment on this
• Creation of a capital investment fund targeting initiatives that achieve
the greatest ESG outcomes and returns
• Climate risk assessment across the portfolio underway
slide 23POTENTIAL EARNINGS GROWTH TRENDS
Continued solid earnings growth expected over time
Indicative Contribution
to FFO Growth Rate (% pa)
Description and Assumptions – medium to longer term –
Anchor
• Anchor rental income represents about 50% of overall gross property income 0 - 1%
Rental
• Once turnover thresholds are met, rent will grow in proportion to Anchors’ sales growth
Growth
CORE BUSINESS
Specialty and Other • Specialty rental income represents about 50% of overall gross property income 1 - 2%
Rental Growth • Specialty leases generally have contracted growth of 3-4% pa
• Property Expenses and Corporate Costs expected to grow at same percentage rate as rental income 0%
Expenses • Interest expense is continuing to be actively managed
Indicative Comparable NOI Growth (%) 1 - 3%
• Selective extensions and refurbishments of our existing centres
Property Development • We have identified over $115m of development opportunities over the next 5 years
GROWTH INITIATIVES
• Selective acquisitions will continue to be made in the fragmented convenience based shopping 1% +
Acquisitions centre segment
Other • Funds management business continues to be capital light
Opportunities
Indicative FFO Growth (%) 2 - 4% +
slide 24KEY PRIORITIES AND OUTLOOK
Continue to deliver on strategy in FY20
• Completion of remixing project for centres acquired in FY19
• Leasing focused on sustainable tenants at sustainable rents - maintain high retention rates on renewals and continue to
OPTIMISING THE
reduce specialty vacancy
CORE BUSINESS • Explore additional “other income” opportunities
• Manage expenses both at centre and corporate levels while maintaining appropriate standards within our centres
• Continue to explore value-accretive acquisition opportunities consistent with our strategy and investment criteria
GROWTH
• Progress our identified development pipeline
OPPORTUNITIES • New funds management opportunities as market conditions allow
• Continue to actively manage our balance sheet to maintain diversified funding sources with long weighted average debt
CAPITAL MANAGEMENT expiry and a low cost of capital consistent with our risk profile
• Gearing to remain below 35% at this point in the cycle
• FY20 FFO per unit (“EPU”) guidance increased from 16.7 cpu to 16.9 cpu (3.5% above FY19) and DPU guidance
EARNINGS GUIDANCE maintained at 15.10 cpu (2.7% above FY19)
slide 256
QUESTIONS
slide 267
APPENDICES
slide 27FY20 FFO PER UNIT GUIDANCE
We have increased guidance to 16.90 cpu
Warner Marketplace acquisition, Increased volume of
Shell Cove Stage 3 development, Increase in corporate costs debt offset by lower Weighted average units on
Cowes divestment, SURF 1 due to D&O insurance and cost of debt due to issue increased due to
performance fee and assumes additional tax on SURF 1 decline of BBSW since January 2020 DRP
continue to hold remaining CQR performance fee August 2019 to underwrite
units December 2019
0.32 ( 0.06 ) ( 0.02 ) ( 0.04 )
16.70 16.90
-
FY20 Guidance Aug 2019 Growth Initiatives Corporate & Tax Interest Expense Units on Issue FY20 Guidance Feb 2020
slide 28LONG TERM LEASES TO WOOLWORTHS,
COLES AND WESFARMERS
Overall Lease Expiry (% of Gross Rent)
• 48% of gross rent is generated by anchor tenants (Woolworths 33%, Coles 11%,
Wesfarmers 3% and Other majors 1% on a fully leased basis), with an Anchor WALE 29.3%
of 9.9 years
• Overall, a 7.6 year portfolio WALE combined with investment grade tenants and non-
discretionary retail categories provides a higher degree of income predictability
12.0% 10.9%
10.0% 9.1%
• 135 specialty renewals completed in the 6 months to 31 December 2019 with majority 7.2% 7.3%
5.5% 4.5%
on a 5 year lease term 4.2%
PORTFOLIO LEASE EXPIRY PROFILE
FY20 FY21 FY22 FY23 FY24 FY25 FY26 FY27 FY28 FY29
and
WALE Years Specialty Lease Expiry (% of Specialty Gross Rent)
Beyond
31 Dec 2019 By Gross Rent By GLA SCA (Including VCX) Overall Lease Expiry (% of Gross
Rent)
Portfolio WALE 6.5 7.6 17.8% 18.1%
16.4%
Anchor WALE 10.4 9.9 14.4%
10.6% 10.8%
4.4% 3.8%
2.1% 1.6%
FY20 FY21 FY22 FY23 FY24 FY25 FY26 FY27 FY28 FY29
and
beyond
slide 29ANCHOR TENANTS
• All of our centres are currently anchored by either Woolworths 30 June 2016 30 June 2017 30 June 2018 30 June 2019 31 Dec 2019
Limited, Coles Group Limited or Wesfarmers Limited retailers Woolworths Limited
Woolworths 53 54 54 58 59
Big W 8 7 7 9 9
• We are gradually increasing our relative exposure to Coles
Dan Murphy's 3 2 2 4 4
and Wesfarmers via acquisitions and divestments. Coles now
Masters 1 - - - -
represents 25% and Wesfarmers represents 6% of our anchor
Countdown - - - - -
tenants
Total Woolworths Limited 65 63 63 71 72
• Woolworths has announced the separation and potential Coles Group Limited
demerger of Endeavour Group. We have 4 Dan Murphy’s and Coles Group Limited - - - 28 28
25 BWS stores accounting for 1.6% of our total gross rent Total Coles Group Limited - - - 28 28
• Big W lease expiry dates: Wesfarmers Limited
Coles 12 18 20 - -
– FY22: Ballarat (plus 4 x 5 year options)
Target 3 2 2 2 2
– FY26-FY29: Lavington, Pakenham, Murray Bridge
Kmart 2 2 2 4 4
– FY34-FY37: Central Highlands, Kwinana, Warnbro, Mt
Gambier, Lilydale Bunnings - 1 1 1 1
Total Wesfarmers Limited 17 23 25 7 7
Other Anchor Tenants
Aldi 1 1 1 1 2
Farmer Jacks - - - 1 1
Grand Cinemas - - - 1 1
Total Other Anchor Tenants 1 1 1 3 4
Total Anchor Tenants 83 87 89 109 111
slide 30FY19 ACQUISITIONS – KEY METRICS
Sales growth, turnover rent, portfolio occupancy, WALE
Sales MAT Growth Existing Centres FY19 Acquisitions Total Portfolio
Existing Centres:
Supermarkets 3.5% (1.1)% 2.6%
• Continue to perform strongly DDS 4.1% 2.2% 3.4%
• MAT Sales growth of 3.3% (June 2019: 2.6%), including 3.5% for Mini-majors (0.2)% (3.4)% (1.0)%
supermarkets (June 2019: 2.7%)
Specialty 2.7% 1.3% 2.3%
• Specialty vacancy reduced to 4.4% (June 2019: 4.7%) Total 3.3% (0.3)% 2.6%
Acquired Centres:
Turnover Rent Existing Centres FY19 Acquisitions Total Portfolio
• We have owned the centres acquired from Vicinity for fifteen
months. Remixing strategies in relation to these centres will be # anchors 23 11 34
substantially completed by June 2020 $ $0.9m $0.2m $1.1m
• MAT Sales improved to (0.3)% (June 2019: (0.9)%)
Portfolio Occupancy Existing Centres FY19 Acquisitions Total Portfolio
• Specialty vacancy reduced to 6.0% (June 2019: 7.3%)
Portfolio occupancy (%) 98.5% 97.7% 98.3%
• Performance continues to be in line with our expectations
Specialty vacancy (%) 4.4% 6.0% 4.8%
WALE (by GLA) Existing Centres FY19 Acquisitions Total Portfolio
Portfolio 8.1 5.8 7.6
Anchor 10.6 7.5 9.9
slide 31FY19 ACQUISITIONS – KEY METRICS
Specialty key metrics
Existing Centres:
Spec Tenant Metrics Existing Centres FY19 Acquisitions Total Portfolio
Comparable sales MAT growth (%) 1 2.7% 1.3% 2.3%
• Tenant metrics improving vs June 2019 with improvements in
sales MAT, occupancy cost and sales productivity Average Spec Occupancy Cost 9.3% 11.0% 9.8%
• Renewal spreads lower at 0.1% (June 2019: 5.3%) reflecting Average Gross Rent $PSM 1 $731 $869 $772
strategy to maintain retention rate against a backdrop of a
softening in the broader retail market Sales Productivity $PSM 1 $8,019 $8,396 $8,134
• New lease spreads lower at (6.0)% (June 2019: 2.4%) and
incentives higher at 16.5 months (June 2019: 11.1 months)
reflecting strategy to reduce specialty vacancy by doing a Renewals Existing Centres FY19 Acquisitions Total Portfolio
significantly increased volume of deals on difficult long term
vacancies. 59 deals completed in six month period, compared to Number 104 31 135
66 deals for the 12 months to June 2019 72%
Retention (%) 81% 78%
Acquired Centres: GLA (sqm) 15,368 3,766 19,134
Average uplift (%) 0.1% (4.8)% (1.7)%
• Tenant metrics improving vs June 2019, with improvements in
sales MAT (1.3% vs 0.0% in June 2019), occupancy cost (11.0% Incentive (months) 0.4 0.1 0.3
vs 11.8% in June 2019) and sales productivity ($8,396 psm vs
$8,179 psm in June 2019)
• Renewal spreads improved to (4.8)% (June 2019: (14.6)%), new New Leases Existing Centres FY19 Acquisitions Total Portfolio
lease spreads were 1.5% (June 2019: 10.6%) and incentives
Number 59 27 86
were higher at 14.5 months (June 2019: 10.8 months)
GLA (sqm) 8,086 4,154 12,240
• Remixing will be substantially completed by 30 June 2020, after
which these centres will be “business as usual” Average Uplift (%) (6.0)% 1.5% (3.9)%
– Portfolio NOI is expected to be in line with acquisition NOI Incentive (months) 16.5 14.5 15.9
by FY21
1. Sales growth, occupancy cost and sales productivity metrics only include sales reporting tenants trading over 24 months slide 32DEBT FACILITIES & INTEREST RATE HEDGING
Facility Limit Drawn Debt Financing capacity Maturity / Notes
$m (A$m) (A$m) (A$m)
Bank Facilities
Bank bilateral 275.0 122.0 153.0 FY 2023 (refer below & note 1)
Bank bilateral 25.0 25.0 0.0 FY 2024
Bank bilateral non-rev olv ing 50.0 50.0 - FY 2024
Sy ndicated non-rev olv ing 100.0 100.0 - FY 2026
450.0 297.0 153.0
Medium Term Notes
Medium Term Note (#1) 4 225.0 225.0 - Apr 2021
Medium Term Note (#2) 4 225.0 225.0 - Jun 2024
450.0 450.0 -
DEBT FACILITIES US Private Placement
US$ denominated2 106.5 106.5 - Aug 2027
As at 31 Dec 2019 US$ denominated3 39.4 39.4 - Sep 2028
US$ denominated2 53.3 53.3 - Aug 2029
A$ denominated 50.0 50.0 - Aug 2029
US$ denominated3 92.1 92.1 - Sep 2031
US$ denominated3 65.8 65.8 - Sep 2033
407.1 407.1 -
Total unsecured financing facililties 1,307.1 1,154.1 153.0
Add: cash - 3.8 3.8
5
Net debt 1,307.1 1,150.3 156.8
Less: Debt facilities used for bank guarantees1 (11.0) Mar 2023; facility used for bank guarantees (refer note 1)
Total debt facilities available plus cash 145.8 Net financing capacity of $145.8m
Due to expiry of $225m MTN in April Balance made up of: $225m MTN
(coupon 3.75%) decrease in fixed (expiry Jun ’24 ) and $300m IRS
Hedge rate %
average cost from 2.88% to 2.50% (expiry Jul ’25 / Jul’26 / Jul’ 27)
INTEREST RATE
FIXED /
HEDGING PROFILE
1. Bank guarantees of $11.0m are for the Group’s compliance with its Australian Financial Services Licences
2. USPP 2014 denominated repayment obligations have been fully hedged at A$ / US$ rate of 0.9387
3. USPP 2018 denominated repayment obligations have been fully hedged at A$ / US$ rate of 0.7604
4. The Group has two A$MTN issues. The first A$MTN (expiry April 2021) has a face value of $225.0m and coupon of 3.75%. The second A$MTN (expiry
June 2024) has a face value of $225.0m and a coupon of 3.90%
5. Drawn debt (net of cash) of $1,150.3m is made up of: statutory debt of $1,222.2m less $69.7m being the revaluation of the USPP US$ denominated debt
from statutory value of $426.8m (using the prevailing December 2019 spot exchange rate) to restate the USPP to its hedged value of A$357.1m plus slide 33
unamortised debt fees and MTN discount of $1.6m less $3.8m cashACQUISITIONS AND PENDING DIVESTMENTS DURING THE
PERIOD
Six months to 31 December 2019
Total
Anchor Specialty Total Implied
Acquisition % GLA Purchase
Centre Type GLA GLA GLA Fully Let
Date Committed Price
(sqm) (sqm) (sqm) Yield
($m)
Acquired Properties
Warner Marketplace Neighbourhood Dec 2019 6,164 5,306 11,470 96% 78.4 5.92%
Anchor Specialty Total Total Sale
Divestment % GLA Divestment
Centre Type GLA GLA GLA Price
Date Committed Cap Rate
(sqm) (sqm) (sqm) ($m)
Assets held for sale
Cowes Neighbourhood Feb 2020 3,495 1,325 4,820 98% 21.5 6.85%
slide 34PORTFOLIO LIST (I)
Valuation
Completion Total GLA Occupancy Number of WALE Valuation Dec 2019
Property State Property Type Anchor Tenant(s) Date (sqm) (% by GLA) Specialties (Years by GLA) Cap Rate (A$m)
Lavington Square NSW Sub Regional WOW; Big W 2005 20,233 96% 57 4.5 7.50% 58.0
Sturt Mall NSW Sub Regional Coles; KMart 2011 15,326 98% 49 3.5 6.50% 76.8
West End Plaza NSW Sub Regional Coles; KMart 2009 15,876 100% 44 1.6 6.75% 68.1
Lilydale VIC Sub Regional WOW; Big W; Aldi 2013 21,737 100% 59 10.4 6.00% 116.5
Pakenham VIC Sub Regional WOW; Big W 2011 16,925 99% 44 6.3 6.25% 89.6
Central Highlands QLD Sub Regional WOW; Big W 2012 18,049 99% 33 10.1 7.50% 64.7
Mt Gambier SA Sub Regional WOW; Big W; Bunnings 2012 27,573 99% 35 11.3 6.47% 73.4
Murray Bridge SA Sub Regional WOW; Big W 2011 18,771 98% 54 6.3 7.50% 64.0
Kwinana Marketplace WA Sub Regional Coles; WOW; Big W; Dan Murphy's 2012 32,945 99% 77 10.3 6.75% 140.0
Warnbro WA Sub Regional Coles; WOW; Big W 2014 21,433 97% 64 8.1 7.00% 97.0
Belmont Central NSW Neighbourhood WOW 2008 7,868 96% 21 7.2 7.04% 31.2
Berala NSW Neighbourhood WOW 2012 4,013 100% 6 12.2 5.50% 28.8
Cabarita NSW Neighbourhood WOW 2013 3,426 100% 11 10.8 6.25% 22.5
Cardiff NSW Neighbourhood WOW 2010 5,848 100% 14 12.3 6.25% 26.2
Clemton Park NSW Neighbourhood Coles 2017 7,020 98% 22 11.9 6.00% 52.1
Goonellabah NSW Neighbourhood WOW 2012 5,115 98% 9 10.5 6.75% 20.5
Greystanes NSW Neighbourhood WOW 2014 6,005 100% 28 10.2 5.75% 61.0
Griffin Plaza NSW Neighbourhood Coles 1997 7,227 99% 30 4.5 6.75% 26.8
Lane Cove NSW Neighbourhood WOW 2009 6,721 98% 13 10.2 5.75% 58.8
Leura NSW Neighbourhood WOW 2011 2,546 100% 6 11.7 5.75% 19.0
Lismore NSW Neighbourhood WOW 2015 6,836 92% 24 10.9 7.25% 30.5
Macksville NSW Neighbourhood WOW 2010 3,446 100% 5 13.2 5.75% 14.8
Merimbula NSW Neighbourhood WOW 2010 5,012 100% 9 11.3 6.50% 19.4
Morisset NSW Neighbourhood WOW 2010 4,137 100% 8 7.1 6.75% 18.9
Muswellbrook Fair NSW Neighbourhood Coles 2015 9,007 99% 22 3.8 6.50% 31.9
North Orange NSW Neighbourhood WOW 2011 4,844 100% 14 12.6 6.25% 33.9
Northgate NSW Neighbourhood Coles 2014 4,126 100% 13 3.4 6.50% 16.8
Shell Cove NSW Neighbourhood WOW 2018 4,881 95% 8 16.4 6.25% 31.4
Ulladulla NSW Neighbourhood WOW 2012 5,281 97% 10 13.3 6.00% 25.7
West Dubbo NSW Neighbourhood WOW 2010 4,205 100% 10 10 6.25% 19.3
Albury VIC Neighbourhood WOW 2011 4,952 100% 13 11.2 6.50% 24.4
Ballarat VIC Neighbourhood Dan Murphy's; Big W 2000 8,963 100% 4 1.9 7.00% 18.1
Bentons Square VIC Neighbourhood WOW; Dan Murphy's 2009 9,996 100% 43 6.5 6.25% 81.0
Drouin VIC Neighbourhood WOW 2008 3,779 100% 4 8 5.75% 17.1
Epping North VIC Neighbourhood WOW 2011 5,258 100% 16 10.8 5.75% 30.9
Highett VIC Neighbourhood WOW 2013 5,476 99% 13 12.3 5.50% 30.6
Langwarrin VIC Neighbourhood WOW 2004 5,094 100% 15 4.3 5.75% 26.0
Ocean Grove VIC Neighbourhood WOW 2004 6,911 97% 20 4.1 6.25% 36.5
The Gateway VIC Neighbourhood Coles 2012 10,844 99% 41 4.4 6.25% 52.9
Warrnambool East VIC Neighbourhood WOW 2011 4,319 100% 6 7.3 6.25% 16.1
Wonthaggi VIC Neighbourhood Coles; Target 2012 11,831 99% 23 6.1 6.75% 45.5
Wyndham Vale VIC Neighbourhood WOW 2009 6,650 100% 9 slide 9.3 5.75% 23.6PORTFOLIO LIST (II)
Valuation
Completion Total GLA Occupancy Number of WALE Valuation Dec 2019
Property State Property Type Anchor Tenant(s) Date (sqm) (% by GLA) Specialties (Years by GLA) Cap Rate (A$m)
Annandale Central QLD Neighbourhood Coles 2007 6,655 100% 20 5.3 7.50% 27.0
Ayr QLD Neighbourhood Coles 2000 5,455 98% 8 5.3 7.00% 18.7
Brookwater Village QLD Neighbourhood WOW; 2013 6,755 100% 11 9.2 6.25% 36.6
Bushland Beach QLD Neighbourhood Coles 2018 4,571 99% 9 10.6 6.75% 23.3
Carrara QLD Neighbourhood WOW 2011 3,717 94% 6 8.0 6.50% 18.0
Chancellor Park QLD Neighbourhood WOW 2001 5,859 100% 18 12.5 6.00% 46.0
Collingwood Park QLD Neighbourhood WOW 2009 4,567 100% 10 12.3 6.50% 12.0
Coorparoo QLD Neighbourhood WOW 2012 5,618 99% 14 11.4 5.75% 38.0
Gladstone QLD Neighbourhood WOW 2012 5,215 100% 12 9.8 7.00% 25.1
Greenbank QLD Neighbourhood WOW 2008 5,696 100% 16 7.5 6.25% 22.4
Jimboomba Junction QLD Neighbourhood Coles 2008 5,934 97% 21 3.6 6.50% 28.5
Lillybrook Shopping Village QLD Neighbourhood Coles 2004 6,996 98% 21 6.8 6.00% 30.5
Mackay QLD Neighbourhood WOW 2012 4,167 100% 8 11.4 6.75% 25.9
Marian Town Centre QLD Neighbourhood WOW 2014 6,707 96% 19 9.1 7.00% 32.7
Miami One QLD Neighbourhood Coles 2007 4,676 97% 35 4.4 6.50% 32.1
Mission Beach QLD Neighbourhood WOW 2008 3,904 96% 8 7.1 6.50% 12.5
Mt Warren Park QLD Neighbourhood Coles 2005 3,842 97% 11 8.5 6.00% 18.3
Mudgeeraba Market QLD Neighbourhood WOW 2008 6,142 98% 39 6.5 6.25% 35.5
North Shore Village QLD Neighbourhood Coles 2003 4,072 99% 14 6.7 6.00% 27.8
Oxenford QLD Neighbourhood WOW 2001 5,815 100% 15 6.2 6.00% 33.5
Sugarworld Shopping Centre QLD Neighbourhood Coles 2015 4,759 90% 12 11.1 6.75% 25.4
The Markets QLD Neighbourhood Coles 2002 5,253 89% 22 1.6 7.25% 29.3
Warner QLD Neighbourhood WOW; Aldi 2001 11,470 97% 44 9.8 5.75% 78.4
Whitsunday QLD Neighbourhood Coles 1986 7,660 93% 34 4.9 7.50% 35.5
Worongary Town Centre QLD Neighbourhood Coles 2004 6,898 98% 43 3.6 6.00% 48.0
Blakes Crossing SA Neighbourhood WOW 2011 5,078 100% 13 7.1 6.75% 21.8
Walkerville SA Neighbourhood WOW 2013 5,263 98% 13 11.8 6.00% 25.6
Busselton WA Neighbourhood WOW 2012 5,432 99% 5 12.8 6.00% 26.9
WOW; Dan Murphy's; Farmer Jacks;
Currambine Central WA Neighbourhood 2016 17,031 98% 41 6.9 6.75% 90.7
Grand Cinemas
Kalamunda Central WA Neighbourhood Coles 2002 8,352 99% 39 4.1 6.00% 43.1
Stirlings Central WA Neighbourhood WOW 2013 8,446 94% 35 7.5 7.00% 42.1
Treendale WA Neighbourhood WOW 2012 7,319 98% 19 5.5 6.50% 31.8
Burnie TAS Neighbourhood Coles; KMart 2006 8,572 100% 10 6.1 7.50% 22.4
Claremont Plaza TAS Neighbourhood WOW 2014 8,046 100% 25 7.7 6.50% 38.8
Glenorchy Central TAS Neighbourhood WOW 2007 7,090 100% 14 5.0 6.75% 27.5
Greenpoint TAS Neighbourhood WOW 2007 5,955 90% 11 2.9 7.25% 17.2
Kingston TAS Neighbourhood Coles 2008 4,963 100% 16 6.7 6.30% 30.8
Meadow Mews TAS Neighbourhood Coles 2003 7,670 100% 31 5.0 6.50% 63.0
New Town Plaza TAS Neighbourhood Coles; KMart 2002 11,381 100% 12 1.6 6.50% 42.9
Prospect Vale TAS Neighbourhood WOW 1996 6,048 100% 18 10.7 6.75% 29.1
Riverside TAS Neighbourhood WOW 1986 3,107 100% 7 1.7 7.50% 8.0
Shoreline TAS Neighbourhood WOW 2001 6,285 100% 18 slide 2.0 6.25% 39.3
Sorell TAS Neighbourhood Coles 2010 5,450 100% 14 8.0 6.25% 30.5PORTFOLIO LIST (III)
WALE Valuation
Total GLA Occupancy Number of (Years by Valuation Dec 2019
Property State Property Type Anchor Tenant(s) Completion Date (sqm) (% by GLA) Specialties GLA) Cap Rate (A$m)
Properties Under Management - SURF 2
Katoomba Marketplace NSW Freestanding WOW; Big W 2014 9,719 100% - 15.8 6.50% 47.0
Mittagong Village NSW Neighbourhood Dan Murphy's 2007 2,235 96% 4 9.7 7.00% 9.6
Properties Under Management - SURF 3
Moama Marketplace NSW Neighbourhood WOW 2007 4,518 99% 7 12.9 7.00% 14.4
Swansea NSW Neighbourhood WOW 2012 3,677 97% 4 14.1 6.00% 15.6
Warrnambool Target VIC Neighbourhood Target 1990 6,983 98% 11 4.2 9.00% 15.0
Woodford QLD Neighbourhood WOW 2010 3,672 100% 5 6.8 6.25% 13.4
slide 37This document has been authorised to be given to the ASX by the Board of SCP.
CONTACT DETAILS AND DISCLAIMER
For further information please contact:
Anthony Mellowes Mark Fleming
Chief Executive Officer Chief Financial Officer
T: +61 2 8243 4900 T: +61 2 8243 4900
E: anthony.mellowes@scaproperty.com.au E: mark.fleming@scaproperty.com.au
Disclaimer
This presentation has been prepared by Shopping Centres Australasia Property Group RE Limited (ABN 47 158 809 851) (SCPRE) as responsible entity of Shopping Centres
Australasia Property Management Trust (ARSN 160 612 626) (SCA Management Trust) and responsible entity of Shopping Centres Australasia Property Retail Trust (ARSN 160 612
788) (SCA Management Trust) (together, SCA Property Group or the Group). This presentation should be read in conjunction with the Financial Report published on the same date.
Information contained in this presentation is current as at the date of release. This presentation is provided for information purposes only and has been prepared without taking account
of any particular reader's financial situation, objectives or needs. Nothing contained in this presentation constitutes investment, legal, tax or other advice. Accordingly, readers should,
before acting on any information in this presentation, consider its appropriateness, having regard to their objectives, financial situation and needs, and seek the assistance of their
financial or other licensed professional adviser before making any investment decision.
This presentation does not constitute an offer, invitation, solicitation or recommendation with respect to the subscription for, purchase or sale of any security, nor does it form the basis
of any contract or commitment. Except as required by law, no representation or warranty, express or implied, is made as to the fairness, accuracy or completeness of the information,
opinions and conclusions, or as to the reasonableness of any assumption, contained in this presentation.
The forward looking statements included in this presentation involve subjective judgment and analysis and are subject to significant uncertainties, risks and contingencies, many of
which are outside the control of, and are unknown to, the Group. In particular, they speak only as of the date of these materials, they assume the success of the Group’s business
strategies, and they are subject to significant regulatory, business, competitive and economic uncertainties and risks. Actual future events may vary materially from forward looking
statements and the assumptions on which those statements are based. Given these uncertainties, readers are cautioned not to place undue reliance on such forward looking
statements. Past performance is not a reliable indicator of future performance.
By reading this presentation and to the extent permitted by law, the reader releases each entity in the Group and its affiliates, and any of their respective directors, officers, employees,
representatives or advisers from any liability (including, without limitation, in respect of direct, indirect or consequential loss or damage or loss or damage arising by negligence) arising
in relation to any reader relying on anything contained in or omitted from this presentation.
The Group, or persons associated with it, may have an interest in the securities mentioned in this presentation, and may earn fees slide
as a result of transactions described in this
presentation or transactions in securities in SCP. All values are expressed in Australian dollars unless otherwise indicated. All references to “units” are to a stapled SCP security
comprising one unit in the SCA Retail Trust and one unit in the SCA Management Trust.You can also read