REALTY GROWTH NYSE: CTO - Investor Presentation - CTO Realty Growth, Inc.
←
→
Page content transcription
If your browser does not render page correctly, please read the page content below
REALTY GROWTH
NYSE: CTO

Investor Presentation   September 2021

Company Profile
THE SHOPS AT LEGACY, PLANO, TX
100% 20 2.7M $46M
Q2 2021 RENT PROPERTIES SQUARE FEET IN-PLACE NET
COLLECTION(1) OPERATING INCOME
$37M $4.00 – $4.20
INVESTMENT IN ALPINE INCOME AFFO PER SHARE GUIDANCE RANGE
PROPERTY TRUST(2)
$322M $227M $75M $600M
EQUITY MARKET CAP(3) OUTSTANDING DEBT SERIES A PREFERRED(4) TOTAL ENTERPRISE VALUE
(Net of Cash)(5)
$4.00/share 7.4%
Q3 2021 ANNUALIZED CURRENT ANNUALIZED
DIVIDEND DIVIDEND YIELD
THE STRAND, JACKSONVILLE, FL
As of July 23, 2021, or as otherwise noted; any differences a result of rounding.
(1) Based on monthly Contractual Base Rent (“CBR”), which represents the amount owed to the Company under the terms of its lease agreements in each respective month.
(2) Calculated on 2,039,644 common shares and partnership units CTO owns in PINE and PINE’s September 10, 2021, closing stock price.
(3) Calculated on 5,955,154 shares outstanding as of September 10, 2021.
(4) Calculated on 3,000,000 Series A Preferred shares outstanding as of September 10, 2021, and a par value of $25.00 per share.
(5) Includes cash, cash equivalents, restricted cash and outstanding borrowings as of September 10, 2021.
© CTO Realty Growth, Inc. | ctoreit.com 2
Key Takeaways
Significant Discount to the Peer Group
Meaningful potential upside in valuation as CTO has one of the lowest 2022E FFO multiple of its retail and diversified peer group.

Earnings Growth Through Capital Recycling
Strong, long-term track record of monetizing assets at favorable net investment spreads to drive accretive earnings growth and attractive risk-adjusted returns.

Attractive Dividend and Improving Payout Ratio
CTO pays a $1.00 quarterly cash dividend, representing a 7.4% in-place annualized yield and a quickly improving AFFO payout ratio driven by the monetization and
reinvestment of low cap rate, single tenant properties and non-income producing assets.

Differentiated Investment Strategy
Diversified, retail-based investment strategy focused on value-add properties with strong real estate fundamentals in growing markets that can be acquired at meaningful
discounts to replacement cost.

High-Quality Portfolio in Faster Growing, Business Friendly Locations with Operational Upside
Recently constructed real estate portfolio with a durable, stable tenant base located in faster growing, business friendly states such as Florida, Texas and Georgia, and
with acquired vacancy that represents notable leasing and/or repositioning upside.

Profitable External Investment Management
External management of Alpine Income Property Trust, Inc. (NYSE: PINE), a high-growth, publicly traded, single tenant net lease REIT, provides excellent in-place
cash flow and significant upside through the CTO’s 16% retained ownership position.

Conservative Balance Sheet
Balance sheet with ample liquidity, no near-term debt maturities and a demonstrated access to multiple capital sources provides financial stability and flexibility.
As of July 29, 2021, or as otherwise noted.

  © CTO Realty Growth, Inc. | ctoreit.com                                                                                                                                   3

Year-to-Date Q2 2021 Highlights
Accretive Investment Activity
       ▪      Under contract to sell the remaining land in the Daytona Beach Land Joint Venture for $67.0 million; total net proceeds to CTO expected to be
              $25.6 million before taxes
       ▪      Acquired 3 properties for $111.0 million at an 8.5% weighted-average going-in cash cap rate in submarkets of Salt Lake City, UT; Las Vegas, NV;
              and Dallas, TX
       ▪      Sold 10 properties (9 single tenant) for $65.5 million at a 7.1% weighted-average exit cap rate
       ▪      Sold 34,500 acres of subsurface interests for $2.6 million in the first half of 2021
       ▪      Non-cash, unrealized gain of $8.2 million on the mark-to-market of the investment in PINE

Attractive and Well-Performing Portfolio
       ▪      Collected an average of 100% of Contractual Base Rents for the first six months of 2021
       ▪      Signed 318,100 SF of new leases, extensions and renewals in the first half of 2021
       ▪      91% occupied portfolio in high-growth, business friendly markets, with increasing occupancy driven by recent leasing activity
       ▪      90% of Annualized Base Rent comes from metropolitan statistical areas with more than one million people

Strong Financial Performance
       ▪      Reported Q2 2021 AFFO per share of $1.07 and year-to-date Q2 2021 AFFO per share of $2.03
       ▪      Completed inaugural perpetual preferred 6.375% Series A equity issuance in July 2021, for net proceeds of $72.4 million
       ▪      Originated a new 5-year, $65 million term (Q1 $50 million; Q2 $15 million) loan at an initial interest rate of 1.70%
       ▪      Paid and announced a $1.00 per share regular quarterly cash dividend for Q1 2021 and Q2 2021, respectively
As of July 29, 2021, or as otherwise noted; any differences a result of rounding.

  © CTO Realty Growth, Inc. | ctoreit.com                                                                                                                       4
Experienced Management Team
   CTO Realty Growth is led by an experienced management team with meaningful shareholder alignment, deep
                           industry relationships and a strong long-term track record.
      John P. Albright                                                                          Matthew M. Partridge
      President & Chief Executive Officer                                                       Senior Vice President, Chief Financial Officer & Treasurer
        ▪ Former Co-Head and Managing Director of Archon Capital, a Goldman Sachs               ▪ Former Chief Operating Officer and Chief Financial Officer of Hutton; Executive Vice
          Company; Executive Director of Merchant Banking – Investment Management at              President, Chief Financial Officer and Secretary of Agree Realty Corporation (NYSE:
          Morgan Stanley; and Managing Director of Crescent Real Estate (NYSE: CEI)               ADC); and Vice President of Finance for Pebblebrook Hotel Trust (NYSE: PEB)

      Daniel E. Smith                                                                           Steven R. Greathouse
      Senior Vice President, General Counsel & Corporate Secretary                              Senior Vice President & Chief Investment Officer
        ▪ Former Vice President and Associate General Counsel of Goldman Sachs & Co. and        ▪ Former Director of Finance for N3 Real Estate; Senior Associate of Merchant Banking
          Senior Vice President and General Counsel of Crescent Real Estate (NYSE: CEI)           – Investment Management at Morgan Stanley; and Senior Associate at Crescent Real
                                                                                                  Estate (NYSE: CEI)
      Lisa M. Vorakoun
      Vice President & Chief Accounting Officer                                                 E. Scott Bullock
        ▪ Former Assistant Finance Director for the City of DeLand, Florida and Audit Manager
                                                                                                Vice President – Real Estate
          for James Moore & Company, an Accounting and Consulting Firm                          ▪ Former Managing Director of Corporate Development for International Speedway
                                                                                                  Corporation; Senior Development Manager of Crescent Resources LLC; Development
                                                                                                  Manager of Pritzker Realty Group, L.P.; and Project Engineer for Walt Disney
      Helal A. Ismail                                                                             Imagineering.
      Vice President – Investments
        ▪ Former Associate of Jefferies Real Estate Gaming and Lodging Investment Banking and
          Manager at B-MAT Homes, Inc.

© CTO Realty Growth, Inc. | ctoreit.com                                                                                                                                                  5
Diversified Investment Strategy
              CTO is a diversified real estate investment strategy focused on owning, operating and investing in
                      retail-based real estate, directly and through investment management structures
Multi-Tenant Asset Strategy
    ▪     Focused on retail-based multi-tenanted assets that have a lifestyle or community-oriented
          retail component and a complimentary office component, located in higher growth MSAs
          within the continental United States                                                                 Targeting Multi-                Manage and
                                                                                                             Tenant, Retail-Based,         Retain Ownership in
    ▪     Acquisition targets exhibit strong current in-place yields with a future potential for increased    Value-Add Income                Alpine REIT
          returns through a combination of vacancy lease-up, redevelopment or rolling in-place leases              Property                  (NYSE:PINE)
                                                                                                                 Acquisitions
          to higher market rental rates

Monetization of Non-Income Producing Assets
    ▪     CTO has a number of legacy non-income producing assets (developable land, mitigation
          credits and mineral rights) that when monetized, will unlock meaningful equity to be
          redeployed into income producing assets that can drive higher cash flow and FFO per share
                                                                                                                               REALTY GROWTH
Alpine Income Property Trust and Retained Net Lease Assets
                                                                                                               Monetize Legacy                Monetize the
    ▪     CTO seeded and externally manages Alpine Income Property Trust (NYSE: PINE), a pure                  Land, Mitigation               Retained Net
                                                                                                               Credits, Mineral              Lease Portfolio
          play net lease REIT, which is a meaningful source of management fee income and dividend              Rights and Other             at Opportunistic
          income through its direct investment of REIT shares and OP unit holdings                                  Assets                     Valuations
    ▪     CTO intends to monetize its remaining net lease properties at market pricing, creating
          attractive net investment spreads relative to where it is investing in multi-tenanted assets and
          resulting in an opportunity to grow PINE through direct asset sales from CTO to PINE

 © CTO Realty Growth, Inc. | ctoreit.com                                                                                                                         6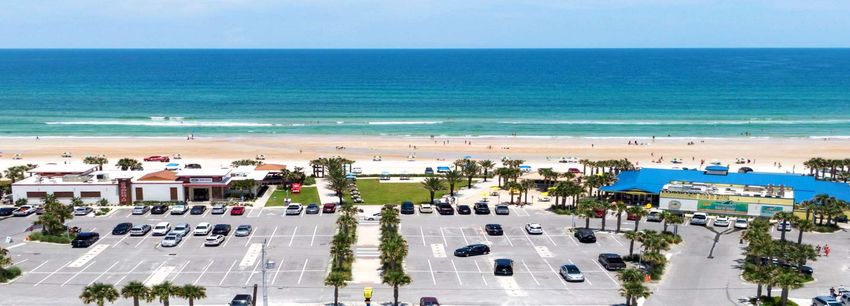
Real Estate Strategy
CTO’s investment strategy is focused on generating relative outsized returns for our shareholders through a
combination of accretive acquisitions and dispositions, asset-level value creation, acquiring at meaningful
         discounts to replacement cost, and sustainably growing organizational level cash flow.

                                                                                                                                 Diversified asset investment strategy

                                                                                                                                 Primary focus on value-add retail and mixed-use
                                                                                                                                 properties with strong real estate fundamentals

                                                                                                                                 Markets that project to have above-average job and
               Salt Lake City
             Reno
                                          Boulder                                                               Washington, DC
                                                                                                                                 population growth; states with favorable business climates
                                                    Denver

                        Las Vegas                                                                  Raleigh-Durham
                                                                                                                                 Large single tenant asset portfolio identified for future
                                                                                   Nashville
                                                                                                         Charlotte               disposition to fund new investments
                                Phoenix
                                                                                               Atlanta                           Acquiring at meaningful discounts to replacement cost
                                                                          Dallas
                                                                                                                                 and below market rents
                                                                                                           Jacksonville
                                                             Austin
                                                                      Houston
                                                                                                              Orlando            Seek properties with leasing or repositioning upside or
                                                                                                Tampa
                                                                                                                                 highly stable assets with an identifiable opportunity to
                                                                                                                 Miami
                                                                                                                                 drive long-term, outsized risk-adjusted returns

© CTO Realty Growth, Inc. | ctoreit.com                                                                                                                                                      7
Portfolio At A Glance
Jacksonville, FL 19%
99,250 Portfolio Average
$107,850 Portfolio Average 3-Mile
Dallas, TX
Atlanta, GA
Phoenix, AZ
16%
11%
10%
Albuquerque, NM 8%
3-Mile Population (1)
Household Income (1)
Washington, DC 7%
Raleigh, NC 6%
% of Cash Base Rent By State Austin, TX 5%
Tampa, FL 5%
Salt Lake City, UT 4%
Miami, FL 4%
Las Vegas, NV 3%
Daytona Beach, FL 2%
New York, NY 1%
Denotes an MSA(2) with over one million people;
Bold denotes a Top 30 ULI Market(3)
30%
38%
Income Producing Property
15%
53%
62%
2%
> 20% 10% - 20% 5% - 10% < 5% Single-Tenant Multi-Tenant Retail Office Mixed Use Hotel
As of 6/30/2021.
Percentages listed based on in-place cash rent as of June 30, 2021.
(1) Source: Sites USA; Portfolio average weighted by the annualized base rent of each property.
(2) MSA, or metropolitan statistical area, is the formal definition of a region that consists of a city and surrounding communities that are linked by social and economic factors, as established by the U.S. Office of Management and Budget. The names of the MSA have been shortened for ease of reference.
(3) As ranked by Urban Land Institute & PWC in the ‘2021 Emerging Trends in Real Estate’ publication.
© CTO Realty Growth, Inc. | ctoreit.com 8
Repositioning – Ashford Lane, Atlanta, GA
                                                            ASHFORD LANE, ATLANTA, GA

                                          T H E   H A L L

    Acquired as Perimeter Place in 2020, with an
    opportunity to up-tier through targeted lease-up,
    an improved tenant mix and market repositioning

      ▪ High barrier-to-entry location with new             ASHFORD LANE, ATLANTA, GA   ASHFORD LANE, ATLANTA, GA

        residential projects, increasing density and 24-
        hour demand
      ▪ Near southeast corporate headquarters for
        UPS, State Farm, First Data, IHG and
        Mercedes Benz
      ▪ Daytime population over 126,000 in 3-mile
        radius; average household income of $125,000

© CTO Realty Growth, Inc. | ctoreit.com                                                                             9
Ashford Lane, Atlanta, GA (Repositioning)
   Ashford Lane will incorporate outdoor
    seating and eating areas, along with a
   number of new green spaces, including
                                                                                          Ashford Lane is being repositioned as a higher-end
       The Lawn, that will drive a more                                                   shopping and dining destination within a growing
       community-focused experience
                                                                            (Not Owned)   and relatively affluent submarket of Atlanta

                                          T H E   H A L L
                                                                                          ▪ Signed a new 6,200 square foot lease with the
                                                                                            acclaimed Superica restaurant
                                                                                          ▪ Signed a new 17,000 square foot lease with a food
                                                                                            hall operator who will open in mid-to-late-2021
                                                                                          ▪ Opportunity to deliver increased rental rates with
                                                                                            higher-end tenants supported by new multi-family
                                                                          (Not Owned)
                                                                                            and office development
                                                                                          ▪ Additional green space, outdoor seating and
                                                                                            eating areas will support improved foot traffic
                                                                                            and offer restaurant-focused amenities
                                                                                          ▪ Currently negotiating letters of intent and forms
                                                            (Not Owned)
                                                                                            of lease with a number of prospective tenants

© CTO Realty Growth, Inc. | ctoreit.com                                                                                                          10
Crabby’s Oceanside Expansion, Daytona Beach, FL
▪ Organic growth opportunity to expand
existing footprint to create a “Tiki Bar”
that better engages with the beach
▪ CTO to receive up to a double-digit yield
on cost through base rent, with upside
through percentage rent above a natural
sales breakpoint
▪ Cost to CTO estimated to be between
$1.0 million - $1.5 million
▪ Complimentary to the existing
restaurant, which is experiencing record
sales volume
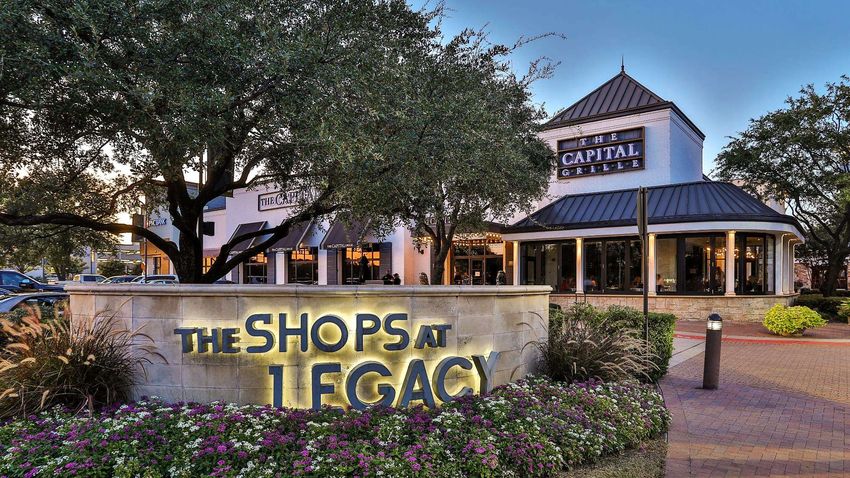
© CTO Realty Growth, Inc. | ctoreit.com 11Land Joint Venture
Land Joint Venture Summary of Terms
▪ Contract value of remaining land held in
the joint venture is $67 million
▪ CTO receives 90% of all proceeds
once the JV Partner capital account is Under Contract
$0 and the preferred return is achieved
▪ Expected proceeds before taxes to
CTO based on its interest in the land
JV is approximately $26 million
© CTO Realty Growth, Inc. | ctoreit.com 12Peer Comparisons
CTO has an outsized dividend yield and very attractive valuation relative to its REIT peer group and recent
retail-oriented M&A multiples (KRG/RPAI and KIM/WRI), implying significant valuation upside.
2022E FFO Multiple and Annualized Dividend Yield(1)
22.0x 8.50%
21.0x 21.4x
7.4%
7.50%
20.0x
19.0x
6.50%
18.0x
17.0x 17.4x 5.6%
5.50%
16.0x 5.0%
4.9%
15.8x
15.0x
4.50%
14.9x 14.9x
14.0x 3.9%
3.6% 14.0x
13.0x 3.4%
3.1% 3.2% 3.50%
12.0x 12.5x 12.4x
11.7x
11.0x 2.50%
(1) All 2022E FFO multiples and dividend yield information are based on the closing stock price on September 10, 2021, using annualized dividends and 2022E FFO per share estimates from the KeyBank The Leaderboard report dated September 10, 2021.
© CTO Realty Growth, Inc. | ctoreit.com 13Balance Sheet
Debt Maturities
$110.0 $110.0
($ in millions)
▪ Approximately $140 million of
existing liquidity(1)
▪ No near-term debt maturities
$210 million of Total Revolving ▪ 34% net debt to total enterprise
Credit Facility Commitments $100.0 $100.0 value (TEV)
$61.7 $65.0 ▪ No exposure to floating interest
rates
▪ 100% of CTO’s outstanding debt is
2021 2022 2023 2024 2025 2026 2027 unsecured
Fixed Floating Total Commitments
Component of Long-Term Debt Principal Interest Rate Maturity Date
Revolving Credit Facility (Fixed)(2) $100.0 million 0.7325% + [1.35% – 1.95%] May 2023
2025 Convertible Senior Notes 61.7 million 3.88% April 2025
2026 Term Loan (Fixed)(3) 50.0 million 0.2200% + [1.35% – 1.95%] March 2026
2026 Term Loan (Fixed)(4) 15.0 million 0.7730% + [1.35% – 1.95%] March 2026
Total Debt / Weighted-Average Interest Rate $234.7 million
All data as of September 10, 2021.
Any differences a result of rounding.
(1) Estimated liquidity is through a combination of revolving credit facility availability and existing cash and restricted cash.
(2) Effective March 31, 2020, the Company utilized an interest rate swap to achieve a fixed LIBOR rate of 0.7325% plus the applicable spread on $100 million of the outstanding balance on the revolving credit facility.
(3) Effective March 10, 2021, the Company redesignated the interest rate swap that previously hedged $50.0 million of the outstanding balance on the revolving credit facility to $50.0 of the outstanding balance on the 2026 Term Loan.
(4) Effective August 31, 2021, the Company utilized an interest rate swap to achieve a fixed LIBOR rate of 0.7730% plus the applicable spread on $15 million of the outstanding balance on the 2026 Term Loan.
© CTO Realty Growth, Inc. | ctoreit.com 142021 Guidance
Full- Year 2021
The Company has revised its outlook for
2021 to take into account the Company’s Low High
second quarter performance and the
Acquisition of Income Producing Assets $175 - $225
expected impact of the Company’s
various investment activities and capital Target Investment Initial Cash Yield 7.25% - 7.50%
markets transactions, including the recent
Series A preferred equity issuance.
Disposition of Assets $125 - $150
The Company’s outlook for 2021, which Target Disposition Cash Yield 5.75% - 6.25%
does not include any potential tax expense
or tax benefit related to the Company’s
retained ownership in the Land JV, FFO Per Diluted Share $3.65 - $3.85
assumes continued improvement in AFFO Per Diluted Share $4.00 - $4.20
economic activity, stable or positive
business trends related to each of our
tenants and other significant assumptions. Weighted Average Diluted Shares Outstanding 6.0 - 6.0
$ and shares outstanding in millions, except per share data.
Full-Year 2021 Guidance was provided in the Company’s Second Quarter 2021 Operating Results press release filed on July 29, 2021.
© CTO Realty Growth, Inc. | ctoreit.com 15Corporate Responsibility
CTO Realty Growth is committed to sustainability, strong corporate governance,
and meaningful corporate social responsibility programs.
Environmental Responsibility Corporate Governance
Committed Focus & Targeted Investment ▪ Independent Chairman of the Board and 5 of
▪ Committed to maintaining an environmentally conscious culture, the utilization of environmentally friendly &
renewable products, and the promotion of sustainable business practices. Notable achievements:
6 Directors classified as independent
• Formed a conservation mitigation bank on approximately 2,500 acres of land, resulting in the land being ▪ Annual election of all Directors
barred from development permanently preserved
• Invested in LED lighting, recycling and waste reduction strategies, programmable thermostats, energy ▪ Annual Board of Director evaluations
management systems in our office and/or at our owned properties
• Conveyed over 11,000 acres of land to the State of Florida to significantly enlarge the neighboring Tiger Bay ▪ Board oversees risk assessment/management,
State Forest with oversight for specific areas of risk
Tenant Alignment delegated to Board committees
▪ Alignment with environmentally aware tenants who have strong sustainability programs and initiatives embedded
▪ Stock ownership requirements for all
into their corporate culture and business practices
Executive Management and Directors
Social Responsibility ▪ Prohibition against hedging and pledging
Inclusive and Supportive Company Culture CTO Realty Growth stock
▪ Dedicated to an inclusive and supportive office environment filled
▪ Robust policies and procedures for approval
with diverse backgrounds and perspectives, with a demonstrated
commitment to financial, mental and physical wellness of related party transactions
Notable Community Outreach ▪ All team members adhere to a comprehensive
▪ Numerous and diverse community outreach programs, supporting Code of Business Conduct and Ethics policy
environmental, artistic, civil and social organizations in the community
© CTO Realty Growth, Inc. | ctoreit.com 16REALTY GROWTH
NYSE: CTO
AppendixSchedule of Properties
Property
Property Market Asset Type Square Feet Occupancy % of ABR
Type
The Shops at Legacy – Plano, TX Dallas, TX Multi-Tenant Mixed Use 236,432 83% 14%
Ashford Lane – Atlanta, GA Atlanta, GA Multi-Tenant Retail 269,682 69% 11%
The Strand – Jacksonville, FL Jacksonville, FL Multi-Tenant Retail 215,047 91% 11%
Crossroads Towne Center – Chandler, AZ Phoenix, AZ Multi-Tenant Retail 253,977 98% 10%
Fidelity – Albuquerque, NM Albuquerque, NM Single Tenant Office 210,067 100% 8%
Wells Fargo – Raleigh, NC Raleigh, NC Single Tenant Office 450,393 100% 6%
245 Riverside – Jacksonville, FL Jacksonville, FL Multi-Tenant Office 136,855 77% 6%
The Carpenter Hotel – Austin, TX Austin, TX Single Tenant Retail 73,508 100% 5%
Sabal Pavilion – Tampa, FL Tampa, FL Single Tenant Office 120,500 100% 5%
Jordan Landing – West Jordan, UT Salt Lake City, UT Multi-Tenant Retail 170,996 100% 4%
As of June 30, 2021 or as otherwise noted; any differences a result of rounding.
Blue shading denotes a ground lease property or a property that has parcels that are ground leased, where the Company owns the land, and the tenant owns the building and the improvements and leases the land from the Company.
© CTO Realty Growth, Inc. | ctoreit.com 18Schedule of Properties
Property
Property Market Asset Type Square Feet Occupancy % of ABR
Type
Westland Gateway Plaza – Hialeah, FL Miami, FL Single Tenant Retail 108,029 100% 4%
General Dynamics – Reston, VA Washington, DC Single Tenant Office 64,319 100% 3%
24 Hour Fitness – Falls Church, VA Washington, DC Single Tenant Retail 46,000 100% 3%
Eastern Commons SC – Henderson, NV Las Vegas, NV Multi-Tenant Retail 146,667 88% 3%
Landshark Bar & Grill – Daytona Beach, FL Daytona Beach, FL Single Tenant Retail 6,264 100% 2%
Westcliff Center – Fort Worth, TX Dallas, TX Multi-Tenant Retail 136,185 60% 1%
Party City – Oceanside, NY New York, NY Single Tenant Retail 15,500 100% 1%
Chuy’s – Jacksonville, FL Jacksonville, FL Single Tenant Retail 7,950 100% < 1%
Firebirds – Jacksonville, FL Jacksonville, FL Single Tenant Retail 6,948 100% < 1%
Crabby’s Oceanside – Daytona Beach, FL Daytona Beach, FL Single Tenant Retail 5,780 100% < 1%
As of June 30, 2021 or as otherwise noted; any differences a result of rounding.
Blue shading denotes a ground lease property or a property that has parcels that are ground leased, where the Company owns the land, and the tenant owns the building and the improvements and leases the land from the Company.
© CTO Realty Growth, Inc. | ctoreit.com 19The Shops at Legacy, Dallas, TX © CTO Realty Growth, Inc. | ctoreit.com 20
Ashford Lane, Atlanta, GA

© CTO Realty Growth, Inc. | ctoreit.com   21
Crossroads Town Center, Chandler, AZ

© CTO Realty Growth, Inc. | ctoreit.com   22
The Strand, Jacksonville, FL

© CTO Realty Growth, Inc. | ctoreit.com   23
Fidelity Office Complex, Albuquerque, NM

© CTO Realty Growth, Inc. | ctoreit.com    24
Wells Fargo Office Complex, Raleigh, NC

© CTO Realty Growth, Inc. | ctoreit.com   25
245 Riverside Office Building, Jacksonville, FL

© CTO Realty Growth, Inc. | ctoreit.com           26
The Carpenter Hotel, Austin, TX (Ground Lease)

© CTO Realty Growth, Inc. | ctoreit.com          27
Sabal Pavilion (Ford Motor Credit), Tampa, FL

© CTO Realty Growth, Inc. | ctoreit.com         28
Jordan Landing, West Jordan, UT

© CTO Realty Growth, Inc. | ctoreit.com   29
Eastern Commons, Henderson, NV

© CTO Realty Growth, Inc. | ctoreit.com   30
Forward Looking Statements
Certain statements contained in this presentation (other than statements of historical fact) are forward-looking statements within the meaning of Section 27A of the Securities Act of 1933, as amended and Section 21E of the Securities Exchange Act of 1934, as amended. Forward-looking
statements can typically be identified by words such as “believe,” “estimate,” “expect,” “intend,” “anticipate,” “will,” “could,” “may,” “should,” “plan,” “potential,” “predict,” “forecast,” “project,” and similar expressions, as well as variations or negatives of these words. Although forward-
looking statements are made based upon management’s present expectations and reasonable beliefs concerning future developments and their potential effect upon the Company, a number of factors could cause the Company’s actual results to differ materially from those set forth in the forward-
looking statements. Such factors may include, but are not limited to: the Company’s ability to remain qualified as a REIT; the Company’s exposure to U.S. federal and state income tax law changes, including changes to the REIT requirements; general adverse economic and real estate conditions;
the ultimate geographic spread, severity and duration of pandemics such as the recent outbreak of the novel coronavirus, actions that may be taken by governmental authorities to contain or address the impact of such pandemics, and the potential negative impacts of such pandemics on the global
economy and the Company’s financial condition and results of operations; the inability of major tenants to continue paying their rent or obligations due to bankruptcy, insolvency or a general downturn in their business; the loss or failure, or decline in the business or assets of Alpine Income
Property Trust, Inc. (NYSE: PINE) or the venture formed when the Company sold its controlling interest in the entity that owned the Company’s remaining land portfolio, of which the Company has a retained interest; the completion of 1031 exchange transactions; the availability of investment
properties that meet the Company’s investment goals and criteria; the uncertainties associated with obtaining required governmental permits and satisfying other closing conditions for planned acquisitions and sales; and the uncertainties and risk factors discussed in the Company’s Annual Report
on Form 10-K for the fiscal year ended December 31, 2020 or Form 10-Q for the quarter ended June 30, 2021, as filed with the SEC. There can be no assurance that future developments will be in accordance with management’s expectations or that the effect of future developments on the
Company will be those anticipated by management. Readers are cautioned not to place undue reliance on these forward-looking statements, which speak only as of the date of this press release. The Company undertakes no obligation to update the information contained in this press release to
reflect subsequently occurring events or circumstances.

References in this presentation:

 ▪    All information is as of July 23, 2021, unless otherwise noted.
 ▪    Annualized straight-line Base Rent (“ABR” or “Rent”) and the statistics based on ABR are calculated based on our current portfolio as of June 30, 2021 and represent straight-line rent calculated in accordance with GAAP.
 ▪    Dividends, subject to the required dividends to maintain our qualification as a REIT, are set by the Board of Directors and declared on a quarterly basis and there can be no assurances as to the likelihood or amount of dividends in the future.
 ▪    A credit rated, or investment grade rated tenant (rating of BBB-, Baa3 or NAIC-2 or higher) is a tenant or the parent of a tenant with a credit rating from S&P Global Ratings, Moody’s Investors Service, Fitch Ratings or the National Associated of Insurance Commissioners (NAIC).
 ▪    Contractual Base Rent (“CBR”) represents the amount owed to the Company under the terms of its lease agreements at the time referenced.

Non-GAAP Financial Measures

Our reported results are presented in accordance with GAAP. We also disclose Funds From Operations (“FFO”) and Adjusted Funds From Operations (“AFFO”), both of which are non-GAAP financial measures. We believe these two non-GAAP financial measures are useful to investors
because they are widely accepted industry measures used by analysts and investors to compare the operating performance of REITs.

FFO and AFFO do not represent cash generated from operating activities and are not necessarily indicative of cash available to fund cash requirements; accordingly, they should not be considered alternatives to net income as a performance measure or cash flows from operating activities as
reported on our statement of cash flows as a liquidity measure and should be considered in addition to, and not in lieu of, GAAP financial measures.

We compute FFO in accordance with the definition adopted by the Board of Governors of the National Association of Real Estate Investment Trusts, or NAREIT. NAREIT defines FFO as GAAP net income or loss adjusted to exclude extraordinary items (as defined by GAAP), net gain or loss
from sales of depreciable real estate assets, impairment write-downs associated with depreciable real estate assets and real estate related depreciation and amortization, including the pro rata share of such adjustments of unconsolidated subsidiaries. The Company also excludes the gains or losses
from sales of assets incidental to the primary business of the REIT which specifically include the sales of mitigation credits, impact fee credits, subsurface sales, and the land sales gains included in discontinued operations. To derive AFFO, we modify the NAREIT computation of FFO to
include other adjustments to GAAP net income related to non-cash revenues and expenses such as straight-line rental revenue, amortization of deferred financing costs, amortization of capitalized lease incentives and above- and below-market lease related intangibles, and non-cash compensation.
Such items may cause short-term fluctuations in net income but have no impact on operating cash flows or long-term operating performance. We use AFFO as one measure of our performance when we formulate corporate goals.

FFO is used by management, investors and analysts to facilitate meaningful comparisons of operating performance between periods and among our peers primarily because it excludes the effect of real estate depreciation and amortization and net gains on sales, which are based on historical costs
and implicitly assume that the value of real estate diminishes predictably over time, rather than fluctuating based on existing market conditions. We believe that AFFO is an additional useful supplemental measure for investors to consider because it will help them to better assess our operating
performance without the distortions created by other non-cash revenues or expenses. FFO and AFFO may not be comparable to similarly titled measures employed by other companies.

Investor Inquiries:             Matthew M. Partridge
                                Senior Vice President, Chief Financial Officer and Treasurer
                                (386) 944-5643
                                mpartridge@ctoreit.com

     © CTO Realty Growth, Inc. | ctoreit.com                                                                                                                                                                                                                                                        31
Non-GAAP Financial Measures Reconciliation
CTO Realty Growth, Inc.
Consolidated Statements of Operations
(Unaudited, in thousands, except share, per share and dividend data)
Three Months Ended Six Months Ended
June 30, June 30, June 30, June 30,
2021 2020 2021 2020
Revenues
Income Properties $ 11,574 $ 11,473 $ 23,023 $ 22,476
Management Fee Income 752 695 1,421 1,397
Interest Income from Commercial Loan and Master Lease Investments 709 835 1,410 1,887
Real Estate Operations 1,248 7 3,141 88
Total Revenues 14,283 13,010 28,995 25,848
Direct Cost of Revenues
Income Properties (2,787) (2,568) (5,704) (4,681)
Real Estate Operations (533) (57) (615) (1,581)
Total Direct Cost of Revenues (3,320) (2,625) (6,319) (6,262)
General and Administrative Expenses (2,665) (2,171) (5,797) (5,263)
Impairment Charges (16,527) — (16,527) (1,905)
Depreciation and Amortization (5,031) (5,021) (9,861) (9,573)
Total Operating Expenses (27,543) (9,817) (38,504) (23,003)
Gain on Disposition of Assets 4,732 7,076 5,440 7,076
Gain (Loss) on Extinguishment of Debt (641) 504 (641) 1,141
Other Gains and Income 4,091 7,580 4,799 8,217
Total Operating Income (Loss) (9,169) 10,773 (4,710) 11,062
Investment and Other Income (Loss) 3,903 8,470 9,235 (4,716)
Interest Expense (2,421) (2,453) (4,865) (5,906)
Income (Loss) from Operations Before Income Tax Benefit (Expense) (7,687) 16,790 (340) 440
Income Tax Benefit (Expense) 3,963 (4,179) 4,401 (91)
Net Income (Loss) $ (3,724) $ 12,611 $ 4,061 $ 349
Per Share Information:
Basic and Diluted $ (0.63) $ 2.71 $ 0.69 $ 0.07
Weighted Average Number of Common Shares:
Basic 5,898,280 4,653,627 5,888,735 4,682,511
Diluted 5,898,280 4,653,627 5,888,735 4,682,511
Dividends Declared and Paid $ 1.00 $ 0.25 $ 2.00 $ 0.50
© CTO Realty Growth, Inc. | ctoreit.com 32Non-GAAP Financial Measures Reconciliation
CTO Realty Growth, Inc.
Non-GAAP Financial Measures
(Unaudited, in thousands, except per share data)
Three Months Ended Six Months Ended
June 30, June 30, June 30, June 30,
2021 2020 2021 2020
Net Income (Loss) $ (3,724) $ 12,611 $ 4,061 $ 349
Depreciation and Amortization 5,031 5,021 9,861 9,573
Gains on Disposition of Assets (4,732) (7,076) (5,440) (7,076)
Losses (Gains) on the Disposition of Other Assets (748) 32 (2,575) 1,421
Impairment Charges, Net 12,474 — 12,474 1,905
Unrealized (Gain) Loss on Investment Securities (3,386) (8,056) (8,220) 5,650
Funds from Operations $ 4,915 $ 2,532 $ 10,161 $ 11,822
Adjustments:
Straight-Line Rent Adjustment (490) (802) (1,175) (1,140)
COVID-19 Rent Repayments (Deferrals), Net 434 (1,151) 654 (1,151)
Amortization of Intangibles to Lease Income (338) (444) (734) (918)
Contributed Leased Assets Accretion (38) (44) (159) (87)
Loss (Gain) on Extinguishment of Debt 641 (504) 641 (1,141)
Amortization of Discount on Convertible Debt 319 256 629 760
Non-Cash Compensation 742 699 1,700 1,518
Non-Recurring G&A 62 — 155 102
Amortization of Deferred Financing Costs to Interest Expense 159 73 324 223
Accretion of Loan Origination Fees (1) (69) (1) (157)
Non-Cash Imputed Interest (111) (103) (214) (206)
Adjusted Funds from Operations $ 6,294 $ 443 $ 11,981 $ 9,625
FFO per diluted share $ 0.83 $ 0.54 $ 1.73 $ 2.52
AFFO per diluted share $ 1.07 $ 0.10 $ 2.03 $ 2.06
© CTO Realty Growth, Inc. | ctoreit.com 33CRABBY’S OCEANSIDE & LANDSHARK BAR & GRILL, DAYTONA BEACH, FL REALTY GROWTH NYSE: CTO
You can also read