NAT TRAFFIC AND FLEET FORECAST - ICAO
←
→
Page content transcription
If your browser does not render page correctly, please read the page content below

-1-                      NAT SPG/55 Conclusion 55/15

                            NAT TRAFFIC AND FLEET FORECAST
        NAT TRAFFIC DEMAND FORECAST METHODOLOGY AND PROJECTION 2018-2038

1. INTRODUCTION

1.1 BACKGROUND ON NORTH ATLANTIC FORECAST

In the past, the NAT traffic forecast was unconstrained and driven by economic variables and forecasts. The
results of the unconstrained forecast produced a traffic growth forecast that was unbounded, while most
major European airports, and a few U.S. international airports have slots or scheduling limits. In addition, the
ten different route group forecasts did not provide explicit forecasts for the seven Flight Information Regions
(FIR) in the North Atlantic. Also noteworthy, the forecast only had a two-year update cycle and did not
capture variations in the business cycles. To address these issues with the NAT traffic forecast, the new
forecast methodology recognizes that the number of air carrier operations over the next several years has
already been determined by air carrier fleet planning. Any carrier’s key strategic activity involves projecting
the expected demand for travel in different markets in both the geographical and consumer sense,
determining which of those identified markets the carrier will attempt to serve, and what type of aircraft fleet
it will use to serve those markets. Air carriers then match the identified markets opportunities to their
existing capacity, enter into binding agreements to either acquire the needed aircraft and crew, or enter into
contractual agreements through joint ventures with partner airlines. These agreements typically cannot be
discharged absent bankruptcy or some other force majeure event.

The previous forecasting methodology relied on economic models of passenger demand, aircraft gauge, load
factors, etc. In contrast, this new forecast methodology relies on the decisions already made by the air
carriers of how the markets should be served. In addition, most economic forecasting methodologies rely on
generic fleet assumptions which do not reflect the various business models that different carriers may be
pursuing. The new methodology reflects airline business models as they are the foundation for the fleet plans
developed by the individual carriers. A key limitation of this approach, however, is how far in advance
airlines plan their fleets. Therefore, the projection is segmented at the five-year forecast horizon. Beyond five
years, a macroeconomic based forecast is used. The macroeconomic forecast is a composite of forecasts from
different sources including ICAO, Boeing and Airbus, defining low, medium and high growth forecasts
beyond the five-year point.

1.2 SUBJECT

The NAT forecast methodology is implemented in two phases:

    •    Phase 1 – The near-term forecast (first five years) is based on detailed projections for individual
         carriers, each of which is based on publicly available information about their individual fleet and
         network plans. Sources include public announcements (press releases and investment community
         presentations and discussions), official financial statements, and news reports. The current collection
         of 44 individual carriers includes only scheduled commercial passenger airlines and makes up about
         80 percent of the total NAT scheduled traffic. The selected 44 carriers include the largest operators,
         fastest growing carriers, low-cost carriers (LCC) and other carriers of special interest, like the group
         of Middle East carriers. The remainder of the traffic is assumed to remain constant and categorized
         as “other”. In a previous release of the forecast, the total count of specifically analysed carriers was
         45. Thompson Air is now excluded because of irregular reporting due to it flying scheduled and
         unscheduled charter flights. However, Thompson Air scheduled flights are included in the “other”
         category
    •    Phase 2 – the long-term forecast uses the end of the near-term forecast as its starting point and uses a
         macroeconomic forecast to determine low, baseline, and high growth rates. The macroeconomic
         forecast is a composite of forecasts from different sources including IATA, ICAO (FESG CAEP),
         Boeing and Airbus, defining low, medium and high growth forecasts beyond the five-year point.

NAT Traffic Forecast 2018-2038 - 2019 -1                                                               June 2019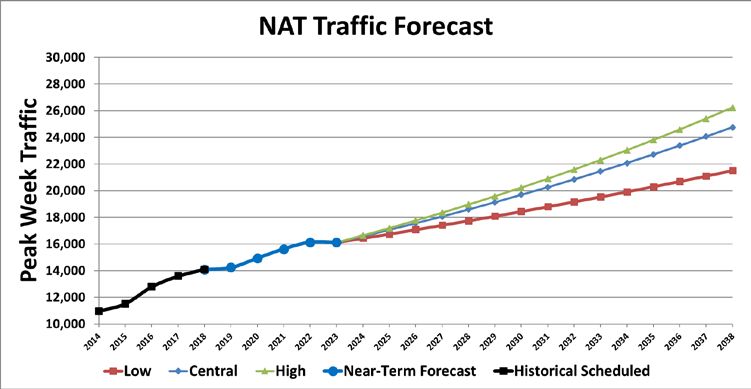
-2-                         NAT SPG/55 Conclusion 55/15

1.3 PURPOSE

The purpose of this forecast is to help the North Atlantic Air Navigation Service Providers (ANSP) and other
stakeholders develop traffic growth expectations for the NAT. This is particularly important for the ANSPs
because they use the traffic forecast to set rates or route charges and staffing requirements. In addition, this
forecast will help support analysis related to NAT region operational requirements and mandates.

2. METHODS AND ASSUMPTIONS

2.1 SCOPE

Geographic Scope

As described in the Summary of Discussions of the North Atlantic Economic, Financial and Forecast Group
Traffic Forecast Workshop (Lisbon, Portugal, 25 February to 26 February 2016), this work currently
addresses the forecast requirements for seven of the North Atlantic flight information regions (FIR),
Shanwick, Gander, Santa Maria, New York, Reykjavik, Bodo, and Nuuk (formerly Sondrestrom).

Carriers Identified for Individual Analysis

For the purpose of the analysis, the following individual carriers were identified of particular interest:

                 Table 1: Select airlines for which individual NAT forecasts are developed.

                      Delta Airlines                     Ryan Air                      TAP Portugal
                     United Airlines                    Turkish Air                       Avianca
                   American Airlines                    Air Berlin                        Aeroflot
                     British Airways             Scandinavian Airlines                Polish Airlines
                       Icelandair*                       Swiss Air                        EasyJet
                       Air Canada*                      Thompson                   SATA International
                        Lufthansa                Thomas Cook Airlines                     Air India
                        Air France                        Condor                     Royal Air Maroc
                     Virgin Atlantic                 Norwegian Air*                   Air Greenland
                           KLM                            Alitalia                     Qatar Airways
                        Aer Lingus                      Air Europa                         Finnair
                       Air Transat                          Jet2                     Atlantic Airways
                      Iberia Airlines                   Etihad Air                     TAM Airlines
                    United Emirates                      WestJet                          jetBlue
                        WOW Air                        Air Caraibes                Southwest Airlines
                *Air Canada is combined with Rouge; Icelandair is combined with Air Iceland; Norwegian Air is
                a combination of Norwegian Air Shuttle and Norwegian Air International
                ^Thompson Air removed from the list of carriers whose fleet plans were analyzed in detail

These carriers have been identified as being in one or more of the following categories: Middle East, LCC,
fastest growing, large legacy, or are of particular interest to at least one ANSP. To support the NAT forecast,
individual NAT forecasts are developed for each of these carriers, which represent more than 80 percent of
the total scheduled NAT air traffic. The remaining 20 percent of the scheduled NAT air traffic is made up of
flights operated by smaller carriers.

NAT Traffic Forecast 2018-2038 - 2019 -1                                                                        June 2019
-3- NAT SPG/55 Conclusion 55/15
2.2 DATA SOURCES
Scheduled data
To develop a baseline for the analysis, scheduled flight data is acquired from FlightGlobal/INNOVATA for
one week in each year. The representative week was selected to be from July 15 to July 21 for 2014 – 2018.
The scheduled data is processed through a trajectory model to extract only city-pairs with flights that would
traverse through NAT airspace based on a great circle distance flight path. This assures that all flights that
flew through the NAT are counted regardless of wind variations and other unpredictable factors. Generating
a baseline through this method allows consistency between successive forecasts.
ANSP provided historic data
To determine the traffic within individual FIRs, each of the participating ANSPs have provided actual flown
data for air traffic that traversed their particular NAT FIR for the same week the schedule data covered. The
following table lists the participating NAT FIRs that are currently included in the forecast and the ANSPs
that support them:
Table 2: FIRs and corresponding ANSP
FIR ANSP
Gander Nav Canada
New York FAA
Reykjavik Isavia
Santa Maria NAV Portugal
Shanwick IAA and NATS
Bodo Avinor
Nuuk (Sondrestrom) Isavia
EUROCONTROL also provided flight data for various FIRs, which was extremely useful for crosschecking
between data sets. The data sets provided by the ANSPs included the following fields for each of their
respective FIRs for the historic data for the representative week for each year including 2013 - 2017:
Table 3: Historic Data Fields
Year: 2013 - 2017 ANSP Name
FIR Name Flight Call Sign
Carrier three letter ICAO code Aircraft type (later standardized across
reported data sets)
Tail Number Flight type: Passenger, Cargo, Private
Departure Date (Z) Departure time (Z)
Departure Airport Departure Country
Arrival Airport Arrival Country
Arrival Date (Z) Arrival Time (Z)
Carrier Name
FIR data representing 2018 operations was not incorporated into the preliminary forecast. The data will be
updated for the final forecast to be released in spring 2019. In addition, flights history specifically associated
with Nuuk FIR flight data was not available so city-pair routes are assigned to Nuuk based on great circle
path.
Fleet Data
Fleet data and fleet plan information was collected from various public sources, including individual carrier
web sites, financial reports, manufacturer order books, and crowd source websites like planespotters.net. A
fleet forecast is updated every forecast, however, the fleet forecast for the final 2018-2023 forecast is the
NAT Traffic Forecast 2018-2038 - 2019 -1 June 2019-4- NAT SPG/55 Conclusion 55/15 same used in the 2017-2022 forecast. As a result, the fleet projected for 2022 is the same for 2023. This returns a growth rate of 0% from 2022 to 2023. Forecasts for Categories of Special Interest The FAA commissioned two separate studies to support forecasts for two categories of carriers of special interest. The two categories are LCCs that are flying or are expected to begin flying transatlantic operations, and the Middle East carriers. For each of these two cases, GRA Incorporated, a strategic and economic consulting firm with expertise in the global aviation industry, provided a comprehensive analysis. Their forecasts are incorporated in this work and a copy of their work is attached as a separate file. 2.3 KEY ASSUMPTIONS The forecast is based on a few key assumptions. First, this methodology assumes that airline fleet plans are relatively fixed for the near future, out to approximately five years. This assumption is based on the observation that airlines are bound by contractual obligations from which they can be released only under special circumstances, like bankruptcy or by mutual agreement with the other parties. These contracts include aircraft purchase and lease agreements, and capacity purchase agreements with regional carriers. There are both upside and downside risks to this assumption. On the downside, carriers may reject these agreements in bankruptcy, as has happened with most of the major U.S. carriers in the past decade. On the upside, carriers have the ability to opportunistically acquire aircraft when demand warrants. In practice, relatively few aircraft have been removed during the industry’s recent bankruptcies, while the upside risk often involves transferring assets between carriers, rather than adding new aircraft to the system. (The transfer of Boeing 717s from Southwest to Delta is an example of the latter effect [Mutzabaugh, 2013b].) A second key assumption is that the mission profile for a particular aircraft type does not change over time. For example, in 2015 Air France’s 747s had an average stage length of 7,000 kilometres and utilization of 12 departures per week. The forecast methodology assumes that the mission profile of a particular aircraft type will continue to be the same through the next five years. In general, all aircraft in the forecast are considered to be trans-oceanic capable; however, some aircraft types have shorter ranges than others. For example, the single aisle aircraft, such as the A321 neo, generally have relatively shorter range than the twin aisle aircraft. Therefore, the single aisle aircraft are expected to be deployed on routes that connect points relatively near the coastline on opposite sides of the Atlantic, while the longer-range capable aircraft do not have this restriction. A related assumption is that if a new aircraft type is added to a carrier’s fleet, this type will have a similar mission profile as comparable existing aircraft, unless the carrier specifies a strategic purpose for the new aircraft type. For example, Delta’s new A350-900s are assumed to have approximately the same mission profile as the 777s which Delta has had in its fleet for many previous years. A third assumption is that the forecast beyond five years is not dependent on a detailed fleet forecast. The fleet assumptions apply primarily to the first five years of the forecast. Because carrier fleet plans become far less firm beyond the first five years, a higher-level macroeconomic approach is used for year six and beyond. 3. METHODOLOGY FOR NEAR-TERM NAT FORECAST Once the carriers’ fleet plans are determined for the select set of carriers, the mission profiles for each aircraft type are used to calculate the number of weekly transatlantic flights that are planned for the each aircraft in that fleet. In this analysis, we call the weekly transatlantic flight count the carrier’s utilization rate for that fleet type. The utilization rate tells how many times a single aircraft of this fleet type for a particular carrier will fly a transatlantic mission. The purpose of the utilization rate is to recognize that carriers can assign aircraft to multiple missions, and count only the operations that traverse the North Atlantic. The utilization rates are based on each carrier’s historic operational trends as determined by matching fleet data with the published flight schedules. The utilization rates are applied to the carrier future fleet plans to project the total number of North Atlantic operations for each carrier. If additional carrier specific information is available, the utilization rates can be NAT Traffic Forecast 2018-2038 - 2019 -1 June 2019
-5-                      NAT SPG/55 Conclusion 55/15

manually adjusted to better reflect those strategic plans (e.g., if a carrier announces a new strategy for its
current or future fleet). This provides a standardized way to project North Atlantic activity for each carrier by
fleet. The product of the fleet counts and utilization rates gives the total number of flights.

Once the total number of NAT flights for each carrier is determined, the next step is to distribute them
among the carrier’s NAT network. This is done manually by first selecting the top 25 city-pairs operated by
each NAT carrier. The remaining city-pairs are grouped into the “Other” category. This approach focuses on
the routes responsible for most of the traffic in the NAT. New routes, not yet in operation, are also added for
select carriers such as Norwegian Air whose trans-Atlantic operations are anticipated to grow. Through the
use of historical trend analysis and information from public announcements by the carriers, flights are added
(or removed) to (from) the baseline year as a total number of flights or a percentage of the base year. A
process flow of the methodology is shown in Figure 1.

                 Historic trends of NAT O&D                  Projected total number of
                 flight data from ANSPs and                   flights by year for each
                  scheduled data, including                  carrier based on fleet and
                         FIR crossings                            utilization rates

                            Flights distributed among each carrier’s top
                                  25 city-pairs and remaining pairs
                                        categorized as “Other”

                               Compute FIR activity based on city-pair
                              forecast and statistical distribution tables
                                      obtained from ANSP data

                             Figure 1: NAT Near-Term Forecast Process Diagram

To complete the near-term forecast, the baseline level of activity for all other carriers is added to the
projection for the select set of carriers developed using the fleet and market analysis described above. These
flights make up the remaining 20 percent of the total number of scheduled NAT flights. If a particular carrier
in this group becomes of interest, it can be removed from the general group and incorporated into the group
of carriers with individual forecast without disrupting the continuity of successive forecasts. Unscheduled
flights are not included because their irregularity would introduce an increased level of uncertainty to the
forecast. Such irregular flights include helicopters, charter flights, cargo, and military flights. We recognize
cargo is an important part of NAT activity but primarily in terms of tonnage because total cargo flights do
not contribute significantly to overall NAT traffic.

NAT Traffic Forecast 2018-2038 - 2019 -1                                                               June 2019
-6- NAT SPG/55 Conclusion 55/15
4. NEAR-TERM FORECAST RESULTS
The final forecast results show 14.3 percent growth in the number of NAT flights between 2018 and 2023.
Table 4 below shows the baseline data for 2018 according to published schedules with the projected number
of flights for 2023. The far right column is the carrier’s rank based on the number of flights added to the
system.
Table 4: Final NAT Five-Year Forecast by Carrier
HISTORICAL FORECAST
Carrier Name Carrier 2014 2015 2016 2017 2018 2019 2020 2021 2022 2023 Rank Order by Growth
Delta Airlines DAL 1,097 1,180 1,210 1,238 1,224 1,253 1,339 1,376 1,401 1,401 2
United Airlines UAL 1,080 1,134 1,132 1,094 1,094 1,094 1,124 1,204 1,269 1,269 3
American Airlines AAL 970 954 940 940 954 943 1,020 1,031 1,109 1,109 4
British Airways BAW 868 859 861 868 908 911 909 914 914 914 33
Air Canada ACA 497 572 668 716 790 815 881 917 919 919 6
Icelandair ICE 515 577 728 764 754 762 826 850 862 862 9
Lufthansa DLH 601 604 629 635 660 660 659 659 665 665 35
Air France AFR 526 527 532 539 545 592 646 681 681 681 5
WOW Air WOW 108 146 234 368 466 141 0 0 0 0 44
Virgin Atlantic VIR 306 366 368 364 382 434 461 450 450 450 13
Aer Lingus EIN 234 268 295 334 370 384 383 383 383 383 28
Norwegian Air NAX 92 100 134 268 351 451 622 752 913 913 1
KLM KLM 292 295 305 313 332 316 363 363 391 391 14
Air Transat TSC 273 270 276 290 308 308 308 308 308 308 36
Iberia Airlines IBE 191 214 243 254 274 274 274 274 322 322 16
Ryan Air RYR 214 214 226 274 268 274 311 396 396 396 7
United Emirates UAE 153 201 249 225 221 243 288 331 331 331 8
Qatar Airways QTR 109 115 180 185 187 193 193 219 240 240 15
Scandinavian Airlines SAS 126 142 176 188 178 182 167 141 172 172 43
Turkish Air THY 130 146 191 175 176 176 176 176 176 176 36
Swiss Air SWR 150 162 176 162 162 159 157 157 157 157 42
Thomas Cook Airlines TCX 79 95 153 167 161 161 161 161 161 161 36
Condor CFG 115 131 137 159 151 160 160 160 160 160 30
Alitalia AZA 122 126 132 144 140 140 140 140 140 140 36
Jet2 EXS 80 78 104 114 124 135 158 168 162 162 18
Air Europa AEA 80 90 104 128 115 142 126 188 188 188 11
WestJet WJA 22 36 96 96 110 108 148 177 181 181 12
Polish Airlines LOT 60 60 64 78 98 120 122 134 134 134 19
Air Caraibes FWI 62 64 76 89 97 97 127 127 127 127 21
Avianca AVA 54 70 70 84 88 94 99 111 111 111 23
TAP Portugal TAP 47 41 72 82 84 103 108 118 118 118 20
Aeroflot AFL 72 62 66 82 80 92 98 108 108 108 22
Etihad Air ETD 76 96 96 97 79 110 129 162 162 162 10
EasyJet EZY 46 66 64 62 58 76 92 105 105 105 17
SATA International RZO 52 48 50 67 54 49 54 69 69 69 26
Air India AIC 42 42 42 51 54 60 60 62 62 62 31
Royal Air Maroc RAM 38 32 40 48 50 50 56 64 68 68 24
Finnair FIN 20 26 30 40 46 52 56 56 56 56 29
jetBlue JBU 28 28 36 38 40 40 40 40 46 46 32
Air Greenland GRL 32 28 32 36 38 43 43 43 43 43 34
Atlantic Airways FLI 18 16 24 24 22 22 22 22 22 22 36
TAM Airlines TAM 32 28 28 18 8 15 20 22 25 25 25
Air Berlin BER 134 140 178 208 0 0 0 0 0 0 36
Southwest Airlines SWA 0 0 0 0 0 0 0 0 13 13 27
Scheduled Others Oth 1,116 1,063 1,341 1,483 1,802 1,802 1,802 1,802 1,802 1,802
Total 10,959 11,512 12,788 13,589 14,103 14,233 14,928 15,618 16,118 16,118
Yr-Yr %Change 5.0% 11.1% 6.3% 3.8% 0.9% 4.9% 4.6% 3.2% 0.0%
5-Year %Change 14.3% Total 5-Yr Growth
5-year Yr-Yr %Change 2.7% Avg Yr-Yr Growth
Figure 2 shows FIR peak-week traffic trends by FIR. Traffic volumes at Gander and Shanwick are at
similarly high levels compared to the traffic volumes at the other FIRs. This is intuitively consistent, since
some of the highest frequency NAT markets pass through these two FIRs, including most of the traffic
between North America and Western Europe, including the highest frequency market John F. Kennedy
Airport (JFK)-London Heathrow (LHR).
Note that the total forecast for the NAT does not equal to the sum of the forecasts of each the individual
FIRs. Because of the way the North Atlantic is partitioned into FIRs, most NAT flights traverse more than a
single FIR. Summing the flights from all FIRs would result in counting single flights more than once. The
total NAT forecast is determined by summing the market-level forecasts for each year.
NAT Traffic Forecast 2018-2038 - 2019 -1 June 2019-7- NAT SPG/55 Conclusion 55/15
Figure 2: NAT Peak Week Traffic Trends by FIR
Table 5: Preliminary NAT Five-Year Forecast by Carrier and FIR
Average Yearly Growth Rates by FIR
2014 – 2018
FIR (actual growth rate) 5-Yr Projected
New York 6.7% 3.1%
Gander 5.4% 3.1%
Shanwick 6.0% 2.7%
Santa Maria 7.1% 3.5%
Reykjavik 10.6% 1.6%
Bodo 10.0% 6.5%
Nuuk 8.0% 3.7%
Total NAT 6.5% 2.7%
Table 5 lists the annual historic growth rate from 2014 to 2018 along with the five-year (2018-2023) average
annual forecast growth rates. The growth rates in the forecast are supported by the publicly accessible fleet
information for 44 identified carriers. Note that while the percentage growth rates for Shanwick and Gander
are lower than for some other NAT FIRs, Shanwick and Gander total traffic is by far larger than the other
FIRs. Growth of Reykjavik was considerably impacted by the bankruptcy of Wow air this year. The
percentage growth rates for Bodo, and Nuuk are higher, although over a lower base.
More detailed and complete forecast results are posted at ICAO’s secure portal
(https://portal.icao.int/NATEFFG).
5. METHODOLOGY FOR LONG-TERM NAT FORECAST
Once the near-term forecast is established, the long-term forecast (beyond the first 5 years) is based on the
long-term forecast beyond 2023 is expected to be in the range of 1.94 percent to 3.3 percent, consistent with
the combined passenger traffic growth rate forecast from an updated IATA forecast, a 2017 ICAO working
paper, Airbus forecast, and Boeing forecast.
NAT Traffic Forecast 2018-2038 - 2019 -1 June 2019-8- NAT SPG/55 Conclusion 55/15
Since there is less certainty in the long-term forecast, the long-term forecast is not expanded to the detailed
market and carrier levels as in the near-term forecast. Instead, the long-term forecast growth rates are applied
to the end points of the aggregate traffic numbers at the FIR level to determine the FIR long-term growth
projections beyond the short-term forecast.
Table 6: Long-term North Atlantic Passenger Growth Forecasts (*Assembly 39th session-economic
commission working paper)
Table 7: Summary of North Atlantic Passenger Growth Forecasts
Tables 6 and 7 provide long-term passenger growth forecasts. Table 6 shows specific forecasts by source and
their respective forecast periods. Table 7 summarizes the results from Table 6 to provide High, Central and
Low growth rate forecasts, which correspond to the maximum, median, and minimum growth rates presented
in Table 6, respectively.
The forecasts in Table 6 do not all reference the same base year, nor do they all reference the same end-point
to define their growth forecasts; however, since these forecasts project far into the future (referencing 2010
to 2020 as a starting point and 2030 to 2035 as the end-point), we consider these growth rates to be
comparable.
The long-term forecast branches into high, central and low forecasts from the end of the near-term forecast,
based on the high, central and low forecasts shown in the long-range growth summary table. The long-range
forecast is presented as a range to reflect the increased uncertainty of the forecast as it looks farther into the
future. In addition, because the fleet plans beyond five years are less developed, it is reasonable to treat
passenger and flight count growth rates interchangeably.
NAT Traffic Forecast 2018-2038 - 2019 -1 June 2019-9- NAT SPG/55 Conclusion 55/15
Figure 3: NAT Peak Week Traffic Forecast
When the near-term forecast is combined with the long-term forecast as shown in Figure 3, the average
annual growth rate for the entire period ranges from 2.1 percent at the low end, 3.2 percent at the high end
and forecast 2.9 percent as the central forecast.
6. CONCLUSIONS
6.1 Near-Term Forecast
Total NAT operations are expected to grow at an average annual rate of 2.7 percent between 2018 and 2023.
Gander and Shanwick, the busiest FIRs, are expected to grow at a rate of 3.1 percent and 2.7 percent
annually. These FIRs manage the heavily travelled North Atlantic Organised Track System (NAT-OTS)
between North America and Europe. Shanwick has slightly higher activity than Gander due to more intra-
FIR traffic with flights between the UK, Iceland, and the rest of Europe.
Traffic through the New York FIR is expected to grow 3.1 percent due to aggressive growth plans from the
Middle East carriers, as well as Norwegian Air, Air Europa, and jetBlue. Note that while the percentage
growth rate in this region appears to be high, it is being applied to a relatively small base.
Santa Maria will also see a significant growth of 3.5% primarily due to Air Europa which has a large order
book for Boeing 788s and 789s. The higher percentage growth rate is being applied to a relatively small
base.
Reykjavik is expected to slow significantly to a rate of 1.6% due to the cessation of Wow air traffic, but
offset somewhat by Icelandair and Norwegian Air. Bodo is expected to grow by 6.5% which is primarily
driven by these same three carriers.
Finally, Nuuk (formerly Sondrestrom) is expected to grow by 3.7% which is primarily driven by Russian
carrier Aeroflot, Westjet, and Icelandair, and negatively impacted by Wow air.
LCCs such as Westjet, Norwegian Air, and Air Canada’s Rouge will add significant growth in the North
Atlantic.
Large order books by Middle East carriers Etihad, Qatar, Emirates, and Turkish Air will contribute to FIR
traffic growth.
NAT traffic volumes by legacy carriers such as American, Delta, Air France, and British Airways are
NAT Traffic Forecast 2018-2038 - 2019 -1 June 2019-10- NAT SPG/55 Conclusion 55/15
expected to remain relatively stable but will respond to LCC growth by adding more flights of their own.
6.2 Long-Term Forecast
The long-term forecast, which provides a range of expected growth rates for the NAT beyond 2023, is
appended to the near-term forecast. The long-term average annual growth rate forecast ranges from 1.94
percent to 3.3 percent, with 2.9 percent as the central forecast. Combining the near-term forecast with the
long-term forecast, the average annual growth rate for the entire period ranges from 2.1 percent at the low
end, 3.2 percent at the high end. The central forecast projects a 2.9 percent average annual air traffic growth
rate in the NAT for 2018 to 2038.
7. CURRENT ISSUES AND RISKS TO FORECAST
Delivery and Retirements Assumptions
While the current forecast may seem aggressive relative to the historical trends, it is a reflection of the
aircraft delivery and retirement assumptions. These assumptions may be too optimistic or not aggressive
enough, respectively, particularly for year five (2023). This forecast effort will continue reviewing aircraft
delivery orders and expected retirements.
Structural Changes
Structural changes can cause significant changes in trends over time. Middle East carriers and LCCs are
anticipated to grow aggressively. In addition, fuel price volatility can significantly affect carriers’ plans and
strategies. Carriers may also go out of business such as Wow air and Air Berlin, which have ended
operations, and Alitalia may possibly be next.
Middle East Carriers
Middle East carriers have a very large order book but the identity of new markets is not certain. A
conservative estimate of future operations is projected although the Middle East carrier order books indicate
potential for greater growth.
Legacy Carriers
Current market level forecast method allows only aircraft that already serve a market to continue to serve it
in the future. Legacy carrier aircraft are not assigned new markets because we don’t have information on
where specific aircraft will be deployed in the future.
Forecast Differences among Carriers
The legacy carrier forecast is a top-down forecast such that we use the total fleet forecast to determine how
much traffic will fall into each of the FIRs and O/D routes. For the legacy carriers, growth of current markets
is based on their future fleet inventory and their current ratios of utilization. However, an in-depth analysis
was performed to identify new markets for the Middle East carriers and the LCCs.
8. FUTURE WORK
Future work on this project includes:
• Update fleet forecast when provided by EFFG
• Update the FIR historical flight tables to include 2018 data
• Prepare 2019 forecast based on latest scheduled information
This forecast will continue to be updated and refined. Forecast updates are planned to be released semi-
annually.
NAT Traffic Forecast 2018-2038 - 2019 -1 June 2019-11- NAT SPG/55 Conclusion 55/15
9. REFERENCES
1. Airbus. (2014a). Global Market Forecast. Retrieved from http://www.airbus.com/gmf-
pp/chrome/index.html
2. Airbus. (2014b). Orders and Deliveries. Retrieved from http://www.airbus.com/company/market/orders-
deliveries
3. Anderson, K. (2014). Great Lakes Aviation January 27, 2014 Press Release. Retrieved from
http://greatlakesav.com/
4. Artner, H. (2014). www.Planespotters.net.
5. ASCEND. (2014). Flightglobal Fleet Forecasat. Retrieved from www.ascendworldwide.com/what-we-
do/ascend-data/aircraft-airline-data/flightglobal-fleet-forecast1.html
6. Bachman, J. (2013). An Airline Battle for Seattle with Delta’s Alaskan Frenemy. Bloomberg
Businessweek. Retrieved from http://www.businessweek.com/
7. Bolanos, M., Meilus, A., Murphy, D., Projecting the Effects of Air Carrier Fleet Plans on Future
National Airspace System Operations. Air Traffic Control Quarterly, Volume 22, Number 4, 2014,
277-305.
8. Bombardier. (2014). Commercial Aircraft Status Reports. Retrieved from
http://www.bombardier.com/en/media-centre/commercial-aircraft-status-reports.html
9. Boyd Group International. (2014). Aviation Forecast. BoydGroup International. Retrieved from
http://aviationplanning.com/
10. Carey, S., Nicas, J., & Pasztor, A. (2012). Airlines Face Acute Shortage of Pilots. The Wall Street
Journal. Retrieved from http://online.wsj.com/
11. Ceha, R., & Ohta, H. (1997). Prediction of Future Origin Destination Matrix of Air Passengers by Fratar
and Gravity Models. Computers and Industrial Engineering, 33, 845–848.
12. Chin, D., Murphy, D. J., Meilus, A., & Thyagarajan, P. (2013). Forecasting Airport Delays. In Modelling
and Managing Airport Performance.
13. Coffman Associates INC. (2014). Airport Master Plan for Santa Barbara Airport (p. 34, Chapter 2).
14. Deloitte. (2014). Aerospace and Defense Industry Outlook. Retrieved from
http://www2.deloitte.com/us/en/pages/manufacturing/articles/2014-global-aerospace-and-defense-
industry-outlook.html
15. Federal Aviation Administration. (2005). O’Hare Modernization Program Business Case (p. D16).
16. Federal Aviation Administration. (2013). Pilot Certification and Qualification Requirements for Air
Carrier Operations. Federal Register, 78(135).
17. Federal Aviation Administration. (2014). Terminal Area Forecast. Retrieved from
https://aspm.faa.gov/main/taf.asp
18. Federal Aviation Administration: Office of Aviation Policy and Plans. (2003). FAA Aerospace Forecasts
(pp. I12 – I38).
19. Honeywell. (2014). Global Business Aviation Outlook. Retrieved from
http://aerospace.honeywell.com/en/about/media-resources/newsroom/honeywell-2014-global-business-
aviation-outlook
20. Horowitz, Alan J., February 2009, Origin Destination Disaggregation Using Fratar Biproportional Least
Squares Estimation for Truck Forecasting, Center for Urban Transportation Studies, University of
Wisconsin, Milwaukee
21. Innovata. (2014). Carrier Published Schedules. Retrieved from www.innovata-llc.com
22. JetBlue Press Release. (2015). JetBlue Adds Even More Fort Lauderdale-Hollywood Flights. Retrieved
from http://mediaroom.jetblue.com/media-room/press-releases.aspx
23. Mutzabaugh, B. (2013a). Already de-hubbed, Memphis hit with more Delta cuts. USA Today. Retrieved
from www.usatoday.com/story/todayinthesky/2013/10/24/already-de-hubbed-memphis-hit-with-more-
delta-cuts/3173535/
24. Mutzabaugh, B. (2013b). Now Flying for Delta: The Boeing 717. USA Today. Retrieved from
http://www.usatoday.com/story/todayinthesky/2013/10/25/delta-launches-first-boeing-717-
flights/3189607/
25. Painter, K. L. (2013). Frontier Airlines Sale Finalized to Indigo Partners LLC. The Denver Post.
Retrieved from http://www.denverpost.com/business/ci_24646215/sale-frontier-airlines-is-finalized
NAT Traffic Forecast 2018-2038 - 2019 -1 June 2019-12- NAT SPG/55 Conclusion 55/15
26. Post, J., Gulding, J., Noonan, K., Murphy, D., Bonn, J., & Graham, M. (2008). The Modernized National
Airspace System Performance Analysis Capability (NASPAC). In International Congress of the
Aeronautical Sciences. Anchorage, AK.
27. Rolls-Royce. (2014). Market Outlook Forecast. Retrieved from http://www.rolls-
royce.com/civil/customers/market_outlook/
28. S.B. Friedman and Company. (2006). Economic Impact Analysis of the O’Hare Modernization Program
(OMP) and Related Roadway Improvements (pp. 2–3).
29. The Boeing Company. (2014a). Current Market Outlook. Retrieved from
http://www.boeing.com/boeing/commercial/cmo/index.page
30. The Boeing Company. (2014b). Orders and Deliveries. Retrieved from
http://active.boeing.com/commercial/orders
31. The Corradino Group. (2008). Evansville Regional Airport Master Plan Update. Retrieved from
www.evvairport.com/press/D FINAL Ch 2.pdf
32. Thyagarajan, P., Shapiro, G., & Murphy, D. (2012). Implementing administration airport terminal gates
in NAS-wide simulations. In Integrated Communications, Navigation and Surveillance Conference.
Herndon, VA.
33. Transportation Research Board. (2007). Airport Aviation Activity Forecasting: A Synthesis of Airport
Practice.
34. United Airlines Communications. (2014). A Message to our Cleveland Customers. Retrieved from
https://hub.united.com/en-us/news/company-operations/pages/cleveland.aspx
35. Zupan, J. M., Barone, R. E., & Lee, M. H. (2011). Upgrading to World Class: The Future of the New
York Region’s Airports (pp. 41–46).
— END —
NAT Traffic Forecast 2018-2038 - 2019 -1 June 2019You can also read


