Investor presentation Telefónica Deutschland - Telefónica Deutschland, Investor Relations Q4 2017
←
→
Page content transcription
If your browser does not render page correctly, please read the page content below
Investor presentation Telefónica
Deutschland

Telefónica Deutschland, Investor Relations
Q4 2017

                                             Public – Nicht vertraulich
Dislaimer

This document contains statements that constitute forward-looking statements and expectations about Telefónica Deutschland Holding AG (in the
following “the Company” or “Telefónica Deutschland”) that reflect the current views and assumptions of Telefónica Deutschland's management with
respect to future events, including financial projections and estimates and their underlying assumptions, statements regarding plans, objectives and
expectations which may refer, among others, to the intent, belief or current prospects of the customer base, estimates regarding, among others, future
growth in the different business lines and the global business, market share, financial results and other aspects of the activity and situation relating to the
Company. Forward-looking statements are based on current plans, estimates and projections. The forward-looking statements in this document can be
identified, in some instances, by the use of words such as "expects", "anticipates", "intends", "believes", and similar language or the negative thereof or by
forward-looking nature of discussions of strategy, plans or intentions. Such forward-looking statements, by their nature, are not guarantees of future
performance and are subject to risks and uncertainties, most of which are difficult to predict and generally beyond Telefónica Deutschland's control, and
other important factors that could cause actual developments or results to materially differ from those expressed in or implied by the Company's forward-
looking statements. These risks and uncertainties include those discussed or identified in fuller disclosure documents filed by Telefónica Deutschland with
the relevant Securities Markets Regulators, and in particular, with the German Federal Financial Supervisory Authority (Bundesanstalt für
Finanzdienstleistungsaufsicht – BaFin). The Company offers no assurance that its expectations or targets will be achieved. Analysts and investors, and any
other person or entity that may need to take decisions, or prepare or release opinions about the shares / securities issued by the Company, are cautioned
not to place undue reliance on those forward-looking statements, which speak only as of the date of this document. Past performance cannot be relied
upon as a guide to future performance. Except as required by applicable law, Telefónica Deutschland undertakes no obligation to revise these forward-
looking statements to reflect events and circumstances after the date of this presentation, including, without limitation, changes in Telefónica
Deutschland’s business or strategy or to reflect the occurrence of unanticipated events. The financial information and opinions contained in this document
are unaudited and are subject to change without notice. This document contains summarised information or information that has not been audited. In this
sense, this information is subject to, and must be read in conjunction with, all other publicly available information, including if it is necessary, any fuller
disclosure document published by Telefónica Deutschland. None of the Company, its subsidiaries or affiliates or by any of its officers, directors, employees,
advisors, representatives or agents shall be liable whatsoever for any loss however arising, directly or indirectly, from any use of this document its content
or otherwise arising in connection with this document. This document or any of the information contained herein do not constitute, form part of or shall
be construed as an offer or invitation to purchase, subscribe, sale or exchange, nor a request for an offer of purchase, subscription, sale or exchange of
shares / securities of the Company, or any advice or recommendation with respect to such shares / securities. This document or a part of it shall not form
the basis of or relied upon in connection with any contract or commitment whatsoever. These written materials are especially not an offer of securities for
sale or a solicitation of an offer to purchase securities in the United States, Canada, Australia, South Africa and Japan. Securities may not be offered or sold
in the United States absent registration under the US Securities Act of 1933, as amended, or an exemption there from. No money, securities or other
consideration from any person inside the United States is being solicited and, if sent in response to the information contained in these written materials,
will not be accepted.

                                                                   Public – Nicht vertraulich                                                                  2
Becoming the Mobile Customer and
Digital Champion

         SUPERIOR                                                 We will generate Superior Shareholder
    SHAREHOLDER RETURN                                             Return including a strong dividend
                                                                              commitment
              Growth & Value

           MOBILE                                                     We will become Germany’s
CUSTOMER and DIGITAL CHAMPION                                    Mobile Customer and Digital Champion
                                                                            by focussing on
      Big Data & Artificial Intelligence
            Products & services
                                                                          CEX & digitalisation

                                                                           We have strong foundations:
           FOUNDATION                                                   Integration success, customer base,
            Systems Technology
                                                                          outstanding connectivity & lean
           Network Technology
                                                                                    organisation

                                           Public – Nicht vertraulich                                         3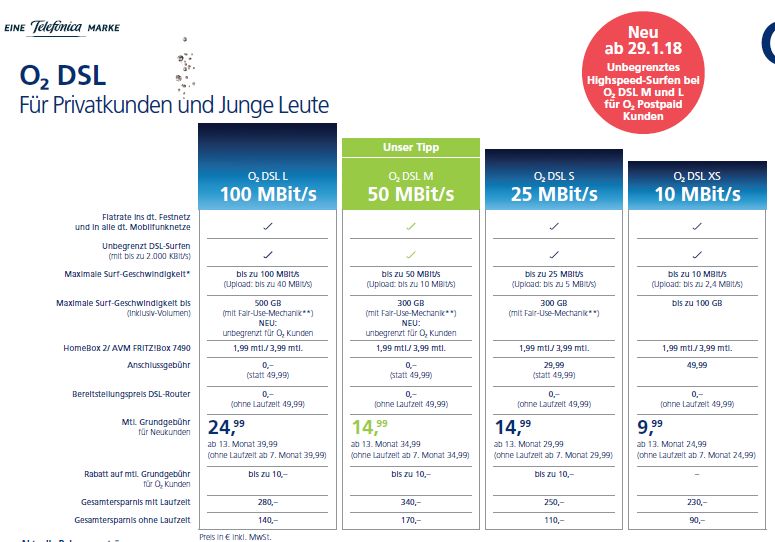
Largest and fastest mobile merger

     2 companies
                                                                                            >9,000 Employees
        3 years

 >25%              ~1,600 FTE          600                    >25m                >14k               O2 Free
 OIBDA growth        Organisation   Shop reduction           Customers           Network sites      First 3G unlimited
   in 3 years        harmonised       in 3 years          migrated to one IT   to be consolidated   First 4G big bucket
                      in 3 years                            stack in 2016           by 2019               portfolio

                                         Public – Nicht vertraulich                                                       4
Core asset: Largest owned customer base
of ~35 million

         BUSINESS                 CONSUMER            Premium
                      Owned
                     Customers                       Non Premium
                                                                            Service Provider & MVNO1

                       > 80%                                        Other
                                                                    < 20%

                      ARPU-up                  Reseller & Ethnic1
                     Churn down

1   Not exhaustive

                                  Public – Nicht vertraulich                                           5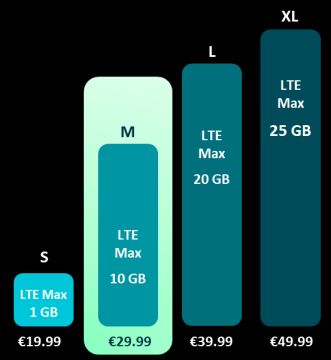
Our German market thesis

                                                                                                                         6%
                                                                                                     83m              Unemployment1
                                                                                    +1.7%            Population1
                                                                                      GDP1

                       Environment
                       Largest 4 to 3 merger in Europe, rational and dynamic market; mobile data usage
                       increase and IoT drive market opportunity with focus on retention and fair market share

                                                                                                             Data & sensors
                                 Device & sensor opportunity: Consumer will mainly buy IoT from an existing relationship

                       Convergence
                       Soft convergence: Limited consumer demand for quadruple play due to large FTA
                       offering; wholesale access to incumbent broadband network

                                                                                             New regulatory environment
                              Europe needs a common regulatory framework on spectrum, as well as deregulation and a
                                               consistent framework for OTT & net neutrality to encourage investments
1 FocusEconomics   Consensus Forecast Euro Area (2017)

                                                                Public – Nicht vertraulich                                            6
The data & device opportunity: explosive growth
MARKET TRENDS – German market with significant further growth potential
Mobile data usage in Europe1 Mobile data traffic in Germany2 ADA and IoT growth opportunity3
More than EUR More than EUR
GB per month Annual volume of mobile data 700 million 5.5 billion
traffic in million GB
Smart Media market Digital Advertising
Finland 10.95 CAGR in Germany spend
Austria 2016-20 3,580 by 2020 in Germany
6.28
Sweden 4.38 Explosive by 2021
+40%
Poland 3.55 growth
Switzerland 2.71 of data and
Turkey 2.71
connected
things
UK 1.84
France 1.62 More than More than
100
Germany 1.21 500 million 6 devices
11 12 13 14 15 16 17 18 19 20 devices in Germany connected
by 2022 per person by 2020
1 Forbes/OECD (2017): ‘Mobile Data Subscriptions: Which Countries Use The Most Gigabytes?’
2 Bundesnetzagentur (2017): ‘Jahresbericht 2016’; Analysis Mason (2017): ‘Western Europe telecoms market: interim forecast update 2016-2021’
3 Company Research / Simon-Kucher & Partners analysis (2017) / Cisco VNI Global forecast (2017) / Please note: Devices including cellular, wifi & bluetooth
Public – Nicht vertraulich 7Strong growth in traffic on Telefónica
Deutschland network
Sustained data traffic growth LTE adoption slowing
Traffic (TB/Q) 122,367 LTE customers (million) 15.7 15.8
110,684 14.0 14.4
98,612 +50% 12.1 +31%
81,641 86,423 10.6
74,361 9.4
61,726 8.7
51,599
Q1 ’16 Q2 ’16 Q3 ’16 Q4 ’16 Q1 ’17 Q2 ’17 Q3 ’17 Q4 ’17 Q1 ’16 Q2 ’16 Q3 ’16 Q4 ’16 Q1 ’17 Q2 ’17 Q3 ’17 Q4 ’17
Average usage creeping up to almost 3GB
• Music & video streaming key drivers of data
Average data usage for O2 LTE customers (GB/m) traffic growth of ~50% y-o-y
+17%
+17% • Data usage for O2 consumer LTE customers
+9% +12% up ~70% y-o-y to almost 3 GB driven by
+16% +15% +5%
2.4
2.8 larger data bundles; O2 Free customers >7GB
1.8 2.0 +68%
1.2 1.4 1.6 1.6 • LTE customer base at almost 16 million,
+31% y-o-y
Q1 ’16 Q2 ’16 Q3 ’16 Q4 ’16 Q1 ’17 Q2 ’17 Q3 ’17 Q3 ’17
Public – Nicht vertraulich 8Future-proof portfolio for all segments
BUSINESS CONSUMER
O2 Free Business/Unite
Premium
O2 All-IP/VPN
Service Provider & MVNO1 MARKET ARPU
share
Churn
Non-Premium
Reseller & Ethnic1
1 Not exhaustive
Public – Nicht vertraulich 9Price value leader
Provide best price-value propositions
&
remain a challenger for our competitors
~60%
new O2 Free customers pay Big data buckets to improve mix
NEW
Subsidies in line with market
≥EUR 30 today CUSTOMERS
Best-in-class application of behavioural economics
ARPU UP EXISTING
Individual pricing
CUSTOMERS Re-invest in customer benefits
Improved # SIMs via U/X-Selling
CHURN DOWN
-2% pts PO churn by 2022
Public – Nicht vertraulich 102017 as a turning point
2022
2017
Excellent mass market
positioning with
CLV2 premium and non-
+50% premium brands
ARPU-up1
>20%
DSL
O2 Free3
>7GB usage net adds in Q4’17 Customer service
flat market standard
1 2017 O2 PO new customer
2 2017 O2 PO new customer CLV/GA
3 2017 O2 Free portfolio new
Public – Nicht vertraulich 11Strong set of results in 2017
Underlying1 MSR trends back to growth in Q4 ’17 13 quarters of year-on-year OIBDA2 growth
Year-on-year performance in % Year-on-year performance in %
-0.9% -0.6% -0.4% -0.1% +0.8% +5.3% +2.1% +5.0% +2.1% +1.4%
493 472 468 499
401
Q4 ’16 Q1 ’17 Q2 ’17 Q3 ’17 Q4 ’17 Q4 ’16 Q1 ’17 Q2 ’17 Q3 ’17 Q4 ’17
Baseline 2016 Outlook 2017 FY 2017 actual
(EUR m) (y-o-y pct. change) (EUR m / y-o-y pct. change)
5,437 Slightly negative to flat1 5,433 / -0.1%
MSR Excl. the impact from regulatory effects (3-4%) (Excl. regulatory effects of EUR 146 million)
OIBDA 1,7932 Flat to low single-digit % growth2 1,840 / +2.6%
CapEx 1,102 Around EUR 1 billion 950 / -13.7%
Dividend growth over 3 years EUR 0.26 per share for FY 2017
Dividend EUR 0.25
(2016-2018) (Payout May 2018)
1 Excluding the impact from regulatory changes; for details please refer to further materials of Q4 2017
2 Excluding exceptional effects; for details please refer to further materials of Q4 2017 results release. We have calculated a comparable for 2016; for details please refer to materials of the full year
2016 results release
Public – Nicht vertraulich 12Over half of network consolidation completed,
significant quality improvements
Ambition: Building the best network for customer experience until 2020
April/May 15 July 15 April 16 July 16 April 17 May 17 August 17 December 17
3G National Deal to Tower sale Consolidation Implementation Implementation 1 MNC ~8,000 sites
Roaming for all transfer to Telxius & roll-out 4G of SON & SOC of CEM nationwide consolidated
customers 7,700 sites to network
DTE
Decommissioning of 14k sites Roll-out of 45k LTE cells Utilisation of new licenses Pilot network for 5G
Public – Nicht vertraulich 13Best network for mobile customer experience
Largest network integration in Western Europe - finish consolidation in 2018
>95%
LTE PoP
coverage
+15k
LTE cells
+15k
LTE cells >2020
+15k
LTE cells
>80%
LTE PoP
coverage
2020
Speed for day-to-day
2019 experience for our
~43m mobile customers
2018 H1: >70%
9M: >85%
2017
FY: >95%
consolidation
Public – Nicht vertraulich 14Fixed infrastructure model to complement our
mobile network for best high-speed experience
Access to best available fixed NGA network1 Fixed
NGA coverage targets Maximum speed
(Up- & Download, Mbps)
(% of covered households)
Download Upload
• Access to best available fixed NGA network1
250
• Fixed network: Access to 25 million households
Super
80% 100 Vectoring
71% +16pp • Full convergence capabilities
50
Mbps 50
40
100 Mobile fibre backhaul
Mbps 10
VDSL VDSL
Mid-2017 2018
Vectoring
• Fiber backhaul plan as a key enabler for 5G
ambition
• Nationwide access to DT NGA network • Target: >90% fibre in sub-/urban areas
• DT is currently upgrading larger cities to
VDSL vectoring and 100 Mbps • Target: >25% fibre in rural areas
• In H2 2018, introduction of Super Vectoring • Differentiated sourcing model
with download speeds of up to 250 Mbps
1 NGA: Next Generation Access including VDSL, Vectoring and future FTTX deployments
Public – Nicht vertraulich 15Transformation programme Digital4Growth
How to become the MOBILE CUSTOMER and DIGITAL CHAMPION?
Digital4Growth
Omnichannel
We want to be … Reduce complexity
Refresh
IT architecture
SIMPLER
Digital speed
Digital processes
Smart growth
FASTER
ADA/IoT
Care of the future
BETTER Shop strategy
… and transform our business
Public – Nicht vertraulich 16Transformation programme Digital4Growth
Digital4Growth
Total case:
OIBDA benefit by 2022 ~EUR 600m
Omnichannel
SIMPLER Reduced complexity ~25% Growth-centric case:
>60% gross margin
Refreshed IT architecture
gains
Digital speed & processes
FASTER ~35%
Smart growth
Building on the
ADA & IoT efficiency gains of
BETTER
Care of the future
~40% the integration
Shop strategy
Public – Nicht vertraulich 17Upfront transformation invest balanced by
integration gains
Conceptual
2018 2019 2020 2021 2022
Efficiency-centric Additional Growth-centric
Transformation gains
case integration gains case
Transformation
invest
Cumulated gross OIBDA benefit over 4 years ~EUR 600m
Public – Nicht vertraulich 18Monetising explosive IoT device growth
Hardware-driven Service-driven value
Ambition: Fair IoT market share value proposition proposition
+23%
HW w Tef connectivity Smart services linking
multiple devices
Attractive hardware driven offerings ~520m
Consumer IoT devices
Establish unique service propositions in Germany
by 20221
Platform-driven proposition
Connectivity/device management
Evolve a platform-driven
IoT ecosystem Platform services
Data lake monetisation
1 Company Research: Simon-Kucher & Partners analysis (2017) / Cisco VNI Global forecast (2017) / Please note: Devices including cellular, wifi & bluetooth
Public – Nicht vertraulich 19Business market potential:
Significant growth opportunity not yet captured
Market size1 Market segments1 Our strategic direction
~EUR 12bn Focus on SME as growth
~44% SME opportunity
Build upon consolidated
mobile network combined with
Fixed 7.1 future-proof fixed wholesale
~36% SoHo access
Focus on efficient and scalable
operations
Mobile 4.9 ~30%
Best-
~20% LE in-class
Gross add market share in SME Churn level
1 Sources: IDC (2017): European Telco Database / mm customer strategy: ‘Business Insights 2016/17’ & ‘Strategic Insights 2016/17’
Public – Nicht vertraulich 20Leverage large customer base in the reseller &
ethnic segment
Benefits for partnering for TEF D Channels
Reseller & Ethnic1 Data adoption driving growth
Leveraging large distribution
channels ~20k PoS
Up- and cross-selling
opportunities
Process automation driving
faster go-to-market cycles
Own /
Mobil Customer Marketing & Branded Sales
Indirect
Network Care Sales Partner
Channel
Mobil Customer Marketing & Sales
Sales Partner
Network Care Sales Channel
Public – Nicht vertraulich 21Non-MNO postpaid market pricing recovered in
2017 driven by roam-like-home and big bundles
x3 x0.5 - 1
~EUR 35
~EUR 30
Postpaid pricing recovered after low in summer 2016
driven by roam-like-home and big buckets
~EUR 15-25
Larger data bundles and full 4G offers support marketing
Selected
~EUR 8-12 between EUR 15 and EUR 30
Non-MNOs1
Selected Migration patterns reflect market shares
non-MNOs1
2GB 2GB 10GB 10GB
2016 2018
1 Selected non-MNOs = Postpaid Service Provider & MVNO; company research
Public – Nicht vertraulich 22MBA MVNO contract economics:
Four levers for revenue growth
EU-approved capacity glide path
>130%
30% Data traffic
since FY20151
Commitment utilised capacity
20% Exponential data growth
DATA
Capacity upgrade up to 30%
VOICE Price tiering based on speed
SMS Price tiering based on technology
2015 2020
1 Telefónica Deutschland mobile network traffic
Public – Nicht vertraulich 23Financial expectations
2018 2019 2020 2021 2022
FY 2018 outlook1 Transformation case
Revenue: Broadly stable yoy ~EUR 600m positive gross OIBDA effect by 2022
excluding a regulatory drag of
EUR 30-50m Growth-centric case
OIBDA: Flat to slightly positive
Mid-term expectations1
yoy excluding a regulatory drag
of EUR 40-60m Revenue growing in line with German market, capturing
market share in IoT
Capex/Sales: Approx. 12-13%
Ongoing margin improvement
Dividend: Growth over 3 years
(2016-2018) Keeping Capex stable
Dividend: High payout ratio to FCF
1 Telefónica The effects from the implementation of IFRS15 as of 1 January 2018 and IFRS16 as of 1 January 2019 are not reflected in the financial outlook. More information will be
provided with the quarterly reporting during the period
Public – Nicht vertraulich 24Digital4Growth targets
O2 app penetration: Tariff detox: Total IT spend/ Postpaid churn:
SIMPLER >80% (vs. 20% 2017) ~40% subscriber: -15% -2% pts
Lead time product Manual back-office Sales in self-assisted Gross adds market
changes: interventions: channels: share in SME:
FASTER
Within hours -80% >25% (vs. 15% 2017) ~30%
Connected devices/ IoT revenue upside:
Share of eCare events: Shop reduction:
customer:
BETTER ~EUR 200-300m
#4 (vs. #1.5 2017) ~80% (vs. 65% 2017) >10% cumulative
Public – Nicht vertraulich 25Evolution of equity story: Becoming the Mobile
Customer & Digital Champion
Germany An established player Operational excellence Value proposition
An attractive and dynamic Leveraging economies of scale Digital transformation drives Attractive shareholder return on
telecoms market growth strong fundamentals
Excellent macro Largest owned Largest & most modern Strong FCF trajectory
customer base network
Data & device High payout ratio to
explosion Multi-brand Excellent integration FCF
track record
Dynamic but rational Multi-channel Conservative financial
market Digital4Growth: profile
ADA & IoT SIMPLER
as opportunities FASTER
BETTER
Consumer Digital4Growth
New, Business & Partnering Network
Public – Nicht vertraulich 26Comfortable liquidity position as per 12/2017
Smooth maturity profile and diversified financing mix (in EURm)
EIB SSD Bonds Financing and interest mix
600 575 Telfisa
EUR 500m Bilateral RCFs
EUR 710m
Syndicated loan
13% 18%
facility EUR 750m
Floating
Other short term 19% 25%
187 Overdraft EUR 55m
28% Fixed
1% 75%
96 8% Bonds
75 72 92 12% EUR 1.1bn
42 33 SSD /NSV
75 3
EUR 300m
EIB
2018 2019 2020 2021 2022 2023 2024 2025 2026 2027 2028 2029 2030 2031 2032 EUR 450m
Comfortable liquidity position Leverage ratio at 0.6x1
(in EURm) (in EURm)
2,602
0.4x 0.6x
129
111
2,015
587 -680 744 1,064
798
Cash and Cash Equivalents Undrawn RCF’s/ Liquidity Net debt FCF Dividends Spectrum Other Net debt
Ext. Overdraft 31.12.2016 pre Dividends 31.12.2017
1 Financial debt/OIBDA (last 12 months) after management fees, before exceptionals and Spectrum
payments
Public – Nicht vertraulich 27We will maintain an attractive shareholder
remuneration policy
Shareholder remuneration policy – Main guidelines1
Maintain high payout in relation to FCF
Consider expected future synergy generation in dividend proposals
Keep leverage ratio at or below 1.0x over the medium term; target
will be continually reviewed
Annual dividend growth over 3 years, starting with of EUR 0.25 per
share 2016; Proposal of EUR 0.26 for the financial year 2017 at
next AGM
1 Refer to the Telefónica Deutschland website for full dividend policy (www.telefonica.de)
Public – Nicht vertraulich 28Appendix Public – Nicht vertraulich
Synergies: We delivered more than we
promised
Successful completion of integration workstreams                           Synergy case 2015 -2019 ( in EURm)
                                                                    CapEx synergies      OpEx & rev. synergies
     2015        2016          2017   2018

                                                                                                                        100%
      Leaver programme
                                                                                                                        ~900
                                                                                                              ~75%             ~800
      Shop footprint optimisation
                                                                                                              ~670      ~35%
                                                                                              ~50%    ~80                       ~40%
      Facility consolidation
                                                                                              ~430    ~160
                                                                               ~30%

                                                                               ~280   ~150
      Customer migration                                                                                                ~65%
                                                                                                                                ~60%
                                                                       ~140

              Network integration                             140

                                                             OpEx      CapEx   2015   2016    2016    2017       2017   2019   Original
                                                                               Cum.   Incr.   Cum.    Incr.      Cum.   Cum.    case
      Simplification

                                             Public – Nicht vertraulich                                                                   30
FY 2017 results fully in line with expectations;
MSR excl. regulatory effects back to growth
•
Flat MSR1 Successful new O2 Free portfolio and strong partner performance
(excl. regulatory effects) • MSR back to growth in Q4 driven by operating momentum & incoming roaming
• 15.8 million LTE customers; +31% year-on-year
2.8 GB
average data usage2 • Traffic up 68% y-o-y; usage of 2.8 GB for O2 consumer postpaid LTE customers
• Integration activities on track; FTE restructuring and shop & facility optimisation finalised
OIBDA3
• Synergy capture fully on track, ~EUR 160 million of additional in year-savings at OIBDA level
+2.6% y-o-y • OIBDA reflecting synergy capture, commercial investment and regulatory effects
• Revenue: Broadly stable year-on-year excluding regulatory impacts of EUR 30-50m
Outlook4 2018 • OIBDA: Flat to slightly positive excluding regulatory effects of EUR 40-60m
• C/S ratio: Approx. 12-13%
1 Excluding the negative impact from regulatory changes; for details please refer to additional materials of the Q4 2017 results release
2 For O2 consumer postpaid LTE customers
3 Excluding exceptional effects; for details please refer to additional materials of the Q4 2017 results release
4 The effects from the implementation of IFRS15 as of 1 January 2018 and IFRS16 as of 1 January 2019 are not reflected in the financial outlook. More information will be provided with the
quarterly reporting during the period
Public – Nicht vertraulich 31Strong partner momentum, retail on track –
Effective churn management
Visible effect from price increases Maintaining retention focus
PO gross adds (abs) GA partner brands GA retail brands Postpaid churn O2 (%) Retail & wholesale (%) Retail brands
1.8% 1.6% 1.5% 1.6% 1.6% 1.5% 1.6% 1.7%
1.4% 1.2% 1.3% 1.5% 1.6% 1.3% 1.5% 1.6%
58% 55% 53% 58%
55%
Q4 ’16 Q1 ’17 Q2 ’17 Q3 ’17 Q4 ’17 Q1 ’16 Q2 ’16 Q3 ’16 Q4 ’16 Q1 ’17 Q2 ’17 Q3 ’17 Q4 ’17
VDSL drives fixed trading
Net adds (in thousand) DSL wholesale DSL retail • Strong partner trading despite more benign
VDSL share of gross adds ~100%
pricing environment, focus on 4G
2
0 • Churn in O2 consumer remains stable, with
-9 -13 -10
seasonal uptick in Q4
-100
• VDSL with solid net adds of 89 thousand;
-110
-129 -134 -130 wholesale migration in line with expectations
Q4 ’16 Q1 ’17 Q2 ’17 Q3 ’17 Q4 ’17
Public – Nicht vertraulich 32Underlying MSR trends back to growth
Revenue structure (in EUR m) MSR from partner business (in EUR m)
Fixed Handset MSR Share of
-1.6% postpaid ~20% ~21% ~22% ~22% ~23%
Performance y-o-y revenue
1,936 1,904 +5% +5% +3% 0%
-12.7%
238 208
341 356
+4.4%
1,349 1,332 -1.2% +0.8%
Excl. regulatory effects
Q4 ’16 Q4 ’17 Q4 ’16 Q1 ’17 Q2 ’17 Q3 ’17 Q4 ’17
Contribution to fixed revenue y-o-y1 performance • Underlying MSR back to growth, supported
Retail Wholesale Other by visitor roaming
Growth
(y-o-y) -10.3% -11.9% -11.2% -12.8% -12.7%
• Negative regulatory effects more benign due
to slow uptake of RLH
-2.1% -2.1%
-3.4% -2.6% -2.8% • Stable trend of partner revenue share
-4.4% -5.9%
-7.2% -8.4% -8.7% • Handset revenue continues to improve
-2.5% -3.9% -1.4%
-1.6% -1.9% • Fixed revenue reflects wholesale migration
Q4 ’16 Q1 ’17 Q2 ’17 Q3 ’17 Q4 ’17
1 Please note a change in the definition of the fixed retail/wholesale split, which better reflects revenue allocation across segments
Public – Nicht vertraulich 33OIBDA reflects successful synergy capture,
RLH-regulation and investment activities
Structure of OIBDA for January to December 2017 (in EUR m)
-2.8% 25.2% 24.5%
y-o-y margin margin
-2.6% -13.7%
7,296 y-o-y y-o-y
159
-2,396
-598 -2,622 1,840 -55 1,785
Revenue Other income Supplies Personnel Other expenses OIBDA Exceptional OIBDA
expenses excl. exceptional effects
effects
OIBDA growth on the back of synergy delivery
• Successful synergy capture with incremental
Synergies
OIBDA delta (in EUR m) OIBDA1 yoy savings of ~EUR 45 million in Q4 due to
Commercial, regulatory and other costs
5.3% 5.0% leaver programme, network consolidation &
2.1% 2.1% 1.4%
shop optimisation
22 10 7
25
8 • OIBDA in line with expectations; regulatory
effects of EUR 51m (~3% OIBDA y-o-y)
• OIBDA1 margin at 25.2%, up 1.3 pp y-o-y
Q4 ‘16 Q1 ’17 Q2 ’17 Q3 ‘17 Q4 ‘17
1 Excluding exceptional effects; for details please refer to additional materials of the Q4 2017 results release
Public – Nicht vertraulich 34Financial leverage in line with target
Evolution of Free Cash Flow (FCF)1 YTD December 2017 (in EUR m)
Working capital movements & adjustments:
(932) -EUR 132 m
1,785 29
(105) (46) (41) 61
(41) 680 709
OIBDA CapEx2 CapEx Prepayments Restructuring Other working Other FCF 1 M&A FCF pre
payables capital pre dividend dividends &
movements & spectrum spectrum
payments payments
1 FCF pre dividend & spectrum payments is defined as the sum of cash flow from operating activities & cash flow from investing activities
2
& pre M&A
Excluding additions from capitalised finance leases and capitalised costs on borrowed capital for investments in spectrum.
Evolution of Net Debt3 (y-o-y in EUR m) – Leverage3 in line with target
Leverage
ratio3 0.4x 0.6x
+91
+111
-709 +744 +1.064
+798
+29
Net debt FCF1 pre dividends M&A Dividend Spectrum payment Other Net debt
31.12.2016 and spectrum 30.12.2017
payments & pre
M&A
3 For definition of net debt & leverage ratio please refer to Q4 2017 earnings release
Public – Nicht vertraulich 35Outlook 2018: Entering a new chapter and
changing KPIs
Baseline 2016 Outlook 2017 Actual 2017 Outlook3 2018
(EUR m) (y-o-y pct. change) (EUR m / y-o-y pct. change) (y-o-y pct. change)
Broadly stable
Revenue 7,503 ––––– 7,296 / -2.8% Excluding negative regulatory effects of
EUR 30-50 million
Slightly negative to flat 5,433 / -0.1%
MSR 5,437 Excl. negative regulatory effects of Excl. regulatory effects of EUR –––––
3-4% y-o-y 146m
Flat to low single-digit Flat to slightly positive
OIBDA 1,7931 1,8401 / +2.6% Excluding negative regulatory effects of
% growth EUR 40-60 million
CapEx 1,102 Around EUR 1 billion 950 / -13.7% –––––
C/S 14.7% ––––– 13.0% Approx. 12-13%
EUR 0.25 Annual Dividend growth
Dividend EUR 0.26 per share2 EUR 0.26 per share2
per share over 3 years (2016-2018)
1 Excluding exceptional effects. We have calculated a comparable for 2016 as if the sale of tower asset to Telxius SA had happened as of 1 January 2016
2 Proposal. Subject to AGM resolution
3 The effects from the implementation of IFRS15 as of 1 January 2018 and IFRS16 as of 1 January 2019 are not reflected in the financial outlook. More information will be provided with the
quarterly reporting during the period
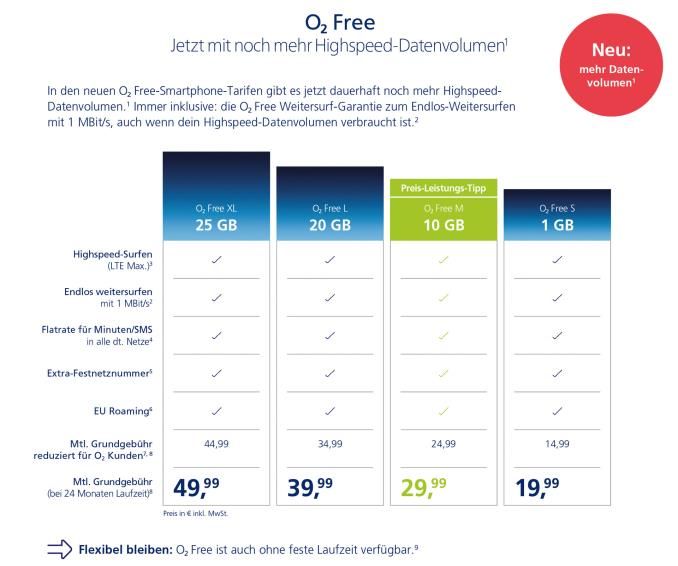
Public – Nicht vertraulich 36O2 Free portfolio and O2 DSL portfolio
Public – Nicht vertraulich 37Product and service extension associated with
additional willingness to pay
2022 Revenue ~5m
growth customers
2008 new services in 2022 new services in 2022
Near &
non-telco
Music & video
• Establish Telefónica D
DATA Financial O2 as relevant player in
services BANKING
VOICE defined near &
non-telco segments
Fitness
• Address new market
SMS VOICE segment & upcoming
Gaming
• trends
Security & • Increase hardware
O2
Cloud PROTECT market share and take
strong position in
Consumer IoT • consumer IoT segment
Public – Nicht vertraulich 38Value generation drives our success
Develop existing
customers & • Focus on ARPU-up & churn-down -2% pts ~60%
• Driving data usage via mobile freedom new O2 Free customers pay
Attract high-value new • Up- and cross-selling
PO Churn
customers by 2022 ≥EUR 30 today
• Data growth as monetisation opportunity Connected devices
• Near & non-telco as value drivers per customer:
Willingness to pay
• Strong position in consumer IoT
#4 by 2022
Enhance • Omnichannel experience >80%
• Digital transformation of touchpoints ~80%
customer experience & • AI to increase automation & reduce cost Share of eCare events
O2 app
penetration
digitalisation by 2022
by 2022
Public – Nicht vertraulich 39From integration to transformation
Targeting ‘Simpler, Faster, Better’ in three dimensions:
Processes Automation Technology
A future-proof network which
• Driving proactivity • Agile network for an provides a competitive customer
• Agile
• Customer and service- agile organisation • Future-proof experience
centric processes • Building a digital • Reliable
skillset Customer-centric
way of working
• All-IP / Virtualisation
• Analytics / SON1 • Operational model / • SDN / Fiber / Simple and efficient
SOC1 • 5G readiness / IoT
1 Service Operations Centre (SOC), Self Organising Network (SON)
Public – Nicht vertraulich 40Ready for accelerating capacity demand
Increasing data volumes, ~95% of network capacity is capable of carrying even
driven by 4G big bucket propositions more traffic volumes, ~5% require capacity upgrades
total Smart invest needed
Data traffic per cell 1
Mobile data traffic 1
in only ~5% of sites
4G
2G & 3G Forecast
Today
2016 2017 0% 50% 100% of cells
1 Company research: Network Analysis (2016-2017)
Public – Nicht vertraulich 41Future-proof spectrum setup,
to enable best customer experience
Balanced coverage position Leadership in capacity spectrum
Potential future 5G 4G 4G 4G 5G 4G 5G
utilisation 2G 4G
Utilisation today 4G 2G 2G 3G 4G
2x10
2x10
2x20
2x30
2x15
2x25
1x42
1x42
2x10
Telefónica Deutschland 2x10 2x10 2x15 2x20
2x10 2x10
Vodafone 2x10 2x10 2x5
Deutsche Telekom 2x10 2x10 2x15 2x15 2x10 2x20 2x21
Frequencies 700 MHz 800 MHz 900 MHz 1,800MHz 2,100MHz 2,600MHz 3,500 MHz
Maturity 2017-2033 2010-2025 2015-2033 2010-2025 2000-2020 2010-2025 2006-2021/22
2015-2033 2010-2025
Public – Nicht vertraulich 42O2D - Factsheet
Telefónica Deutschland at a glance
Share price development until 27.02.2018 Telefónica Deutschland at a glance
O2D DAX Euro telco
YTD’18 Market segment Prime Standard
4.4
4.3
Industry Telecommunications
4.2
-3.3%
4.1 Shares outstanding 2,974,554,993 shares
4.0 -5.7%
3.9
Share capital EUR 2,974.6 m
-8.5%
EUR 3.83
3.8
Market cap (as of 31.12.2017) EUR 12,451.5 m
3.7
01.01.2018 15.01.2018 29.01.2018 12.02.2018 26.02.2018 Share price (as of 31.12.2017) EUR 4.186
Shareholder structure as of 31.12.20171 Regional split of shareholder structure3
Telefónica Germany Holdings Ltd 2 UK & Ireland 7.3%
4.9%
Koninklijke KPN N.V. 22.2% North America 25.0%
5.4%
Freefloat France
5.0%
Germany
8.6% 5.5%
Continental Europe
69.2% Scandinavia
Rest of World
46.9%
1 According to shareholders register as of 31 December 2017
2 Telefónica Germany Holdings Limited is an indirect wholly owned subsidiary of Telefónica S.A
3 Source: NASDAQ; Shareholder ID as of October2017
Public – Nicht vertraulich 43Quarterly detail of relevant financial and
operating data for Telefónica Deutschland
2016 2017
Financials
Q1 Q2 Q3 Q4 FY Q1 Q2 Q3 Q4 FY
Revenues 1.858 1.834 1.876 1.936 7.503 1.771 1.771 1.850 1.904 7.296
Mobile service revenues 1.336 1.358 1.394 1.349 5.437 1.292 1.318 1.344 1.332 5.287
Mobile service revenues (ex regulatory
- - - - - 1.328 1.353 1.392 1.361 5.433
effects)
1
OIBDA post Group fees, pre exceptionals 392 450 458 493 1.793 401 472 468 499 1.840
CapEx 218 212 314 358 1.102 208 226 254 262 950
Revenue and Opex related Synergies ~55 ~40 ~30 ~25 ~150 ~35 ~40 ~40 ~45 ~160
2016 2017
Accesses
Q1 Q2 Q3 Q4 FY Q1 Q2 Q3 Q4 FY
Total Accesses 48.252 48.605 49.196 49.346 49.346 49.550 49.907 49.403 47.604 47.604
o/w Mobile 43.008 43.417 44.074 44.321 44.321 44.675 45.194 44.842 43.155 43.155
Prepa y 23.744 23.814 23.873 23.784 23.784 23.967 24.289 23.754 21.881 21.881
Pos tpa y 19.264 19.603 20.201 20.537 20.537 20.708 20.905 21.088 21.274 21.274
1 Exceptional effects include restructuring costs as well as the net capital gain from the sale of Telefónica Deutschland’s passive tower infrastructure in April 2016. We have calculated a
pro-forma OIBDA of EUR 1,793m for 2016, which includes the operating lease-related effects related with the before mentioned sale of assets as if it had occurred on 1 January 2016
Public – Nicht vertraulich 44You can also read