GET READY TO EXPLORE - Company presentation - Cision

Page created by Arthur Parsons
 
CONTINUE READING
GET READY TO EXPLORE - Company presentation - Cision
GET READY TO
    EXPLORE

Company presentation
                       0
September
GET READY TO EXPLORE - Company presentation - Cision
IMPORTANT NOTICE AND DISCLAIMER

  This presentation does not constitute an offering of securities or otherwise constitute an invitation or inducement to any person to underwrite, subscribe for or
  otherwise acquire securities in Hurtigruten Group AS (the "Company") or any affiliated company thereof.

  This presentation may include certain forward-looking statements, estimates, predictions, influences and projections relating to the business, financial
  performance and results of the Company and its affiliates and/or the industry in which it operates. Forward-looking statements concern future circumstances and
  results and other statements that are not historical facts, sometimes identified by the words "believes", "expects", "predicts", "intends", "projects", "plans",
  "estimates", "aims", "foresees", "anticipates", "targets", and similar expressions. These forward-looking statements may or may not prove to be correct and no
  representation is made as to the accuracy of such statements, estimates, projections, predictions and influences. Forward-looking statements involve risk and
  uncertainty because they relate to events and depend on circumstances that will occur in the future. The information and opinions contained in this presentation
  are subject to change without notice. Except as required by law, the Company assumes no obligation to update any forward-looking statements or to conform
  these forward-looking statements to its actual results.

  This presentation contains alternative performance measures that are not required by or presented in accordance with IFRS. These non-IFRS measures may not
  be comparable to other similarly titles measures of other entities and should not be considered in isolation or as a substitute for the Company's operating results
  as reported under IFRS. Definitions and calculations of alternative performance measures are presented in the Company's interim reports.

  This presentation is being made only to, and is only directed at, persons to whom such presentation may lawfully be communicated. The release, publication or
  distribution of this presentation in certain jurisdictions may be restricted by law, and therefore persons in such jurisdictions into which this presentation is released,
  published or distributed should inform themselves about, and observe, such restrictions.

                                                                                                                                                                               1
GET READY TO EXPLORE - Company presentation - Cision
Company profile

                  2
GET READY TO EXPLORE - Company presentation - Cision
Leading expedition travel company focusing on sustainable expedition cruising

   Unparalleled commitment to           An inspiring global brand               Digital ownership of guests
sustainability and to enhancing        synonymous with experience-focused        seeking authentic and unique travel
        local communities                    travel on sea and land                         experiences

Unique land offerings that             Global operational excellence; Able to   A premium product with world
                                           operate safely and at scale in
enhance and differentiate our cruise                                            leading experts and the best local food
             sailings                     all areas of the world                           and beverages

                                                                                                                          3
GET READY TO EXPLORE - Company presentation - Cision
Global leader in cruise-based exploration and adventure travel with strong financial
 performance pre Covid-19 (As of Q1 2020)
                                                                             Exploration and adventure travel – high growth and margin businesses

                                               Expedition                                                         Norwegian Coast                                                                             Landbased                                                              Government agreement4
                        A                                                                           B                                                                                    C                                                                                    D
                                                                                                                                                                                                                                                                                                                                  Honningsvåg
                                                                                                                                                                                                                                                                                                                     Hammerfest           Vardø
                                     Expedition-based cruises to the Arctic,                            Authentic exploration cruise offering along the                                        Landbased operations at Svalbard and in                                            Contract with the Norwegian
                                                                                                                                                                                                                                                                                                       Tromsø     government
                                                                                                                                                                                                                                                                                                                                  Vadsø
                                                                                                                                                                                                                                                                                                                          Kirkenesfor
                                  Antarctica, North America and South America                                         Norwegian coast                                                           Kirkenes, including hotels and activities                                            transportation
                                                                                                                                                                                                                                                                                              Risøyhamnof travelers and cargo
                                                                                                                                                                                                                                                                                                                        Harstad
                                                                                                                                                                                                                                                                                                           Svolvær
                                                                                                                                                                                                                                                                                                                        Bodø
                                                                                                                                                                                                                                                                                                            Øres

                                                                                                                                                                                                                                                                                             Brønnøysund

                                                                                                                                                                                                                                                                                       Kristiansund
                                                                                                                                                                                                                                                                                        Torvik              Trondheim
                                                                                                                                                                                                                                                                                                   Molde
                                                                                                                                                                                                                                                                                     Måløy     Ålesund
                                                                                                                                                                                                                                                                                                                                          Routes
                                                                                                                                                                                                                                                                                              Bergen                                      Ports

        CAGR
     17-Q120 LTM                                    35.4%                                                                       2.6%                                                                                -4.4%                                                                                            1.8%

                                                                                                                                                                                                                        4%
                                                                                                                                                                                                                       5%
          Revenue contribution1

                                                                    Expedition expected to account                                                                                                                                                                                                                       12%
                                                         27%         for ~50% of capacity in 2021.
              Q1 2020 LTM

                                                                      Segment with >100% higher
                                                                     gross revenue yield compared                                          56%
                                                                    to Norwegian Coast historically2

                                                EUR 170m                                                                  EUR 352m3                                                                              EUR 28m                                                                                     EUR 75m

                                          EURm                                                                      2017                           2018                           2019               Q1 2020 LTM
                                          Revenue                                                                    527                            566                            619                        630
                                          EBITDA excl. gains/losses (Norm.)5,6                                        107                            128                           145                            145
                                           % Margin (adjusted)                                                    20.3%                          22.6%                          23.8%                          23.0%

Note: All numbers presented are based on Hurtigruten Group AS on a consolidated basis
1) Figures shown before internal eliminations of EUR 1m
2) Gross revenue yield excluding government contract. Defined as (Total revenue – Contractual revenues – Goods revenues) / Passenger cruise nights
3) Excluding revenue from the Government agreement (contractual revenue and goods revenues)                                                                                                                                                                                                                                                        4
4) Exclusive, fixed fee contract with the Norwegian Government for transportation of distance travelers and cargo between Bergen in the south of Norway and Kirkenes in the north, with 33 northbound and 32 southbound departures (i.e. 34 ports served along the coast in total) 7 days a week, 365 days a year with 11 vessels
(expires end of 2020) – reported under Norwegian Coast segment
5) Normalisations and adjustments of,EUR 19m, 5m, 22m and 17m in 2017, 2018, 2019 and Q1 2020 LTM, respectively. Further details about normalisations and adjustments are provided on page 32
6) In 2018, 2019 and 2020, leasing contracts are booked in accordance with IFRS 16. 2016-2017 not restated
GET READY TO EXPLORE - Company presentation - Cision
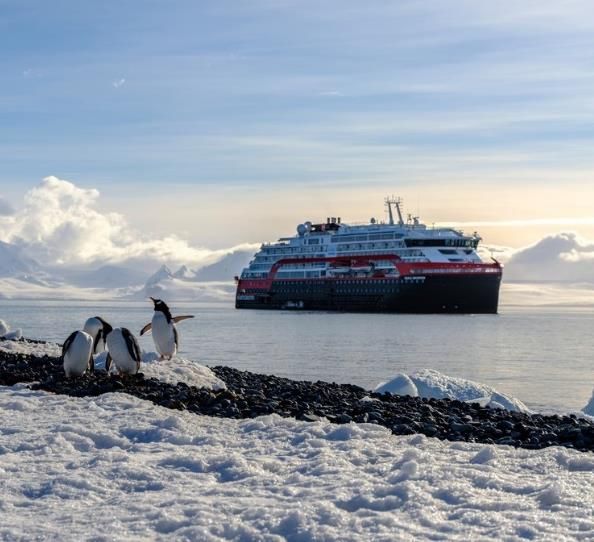
We entered 2020 with a history of strong growth en-route for EBITDA >EUR 200m pre
Covid-19 with two state of the art vessels just delivered

Consistent positive normalised adjusted EBITDA improvement pre Covid-191                                                                                    Clear bridge to achieve EBITDA >EUR 200m in 2020 pre Covid-192

 EURm                                                                                                                                                   EURm

160                                                                                                                                                   220
                LTM normalised adjusted EBITDA                                                                                 EUR 150m
                LTM reported EBITDA before other gains/losses
150                                                                                                                                                                                                                                                                                    207
                                                               CAGR 18%
140                                                                                                                                                   200

130

120                                                                                                                                                   180

110

100                                                                                                                                                   160

                                                                                                                                                                   150
 90

 80                                                                                                                                                   140
                                                                                                                                                                LTM Feb         Government          Full year RA       Full year FN      Project ECO       SG&A increase       Pf norm adj
                                                                                                                                                               2020 norm       agreement fixed      contribution       contribution                                             EBITDA
                                                                                                                                                              adj EBITDA

      •      Consistent upward trajectory leading into Covid-19                                                                                   •      The uplift is mainly explained by full year earnings contribution from Amundsen
                                                                                                                                                         and Nansen
      •      LTM February 2020 EBITDA at all time high with EUR 150m
                                                                                                                                                  •      ~80% of the budgeted group revenues for 2020 were pre-booked as of 1 March
                                                                                                                                                         2020, up from ~60% in January 2020

 1) As of 1st of January 2020 Hurtigruten is changing functional and reporting currency to EUR. LTM graph is based on last three years reported numbers and normalization as if the functional and reporting currency was EUR for the period 2017 to YE 2019 in accordance with IFRS         5
 2) Numbers are converted from NOK to EUR using a EUR/NOK exchange rate of 9.8500 which was the basis of the 2020 budget
GET READY TO EXPLORE - Company presentation - Cision
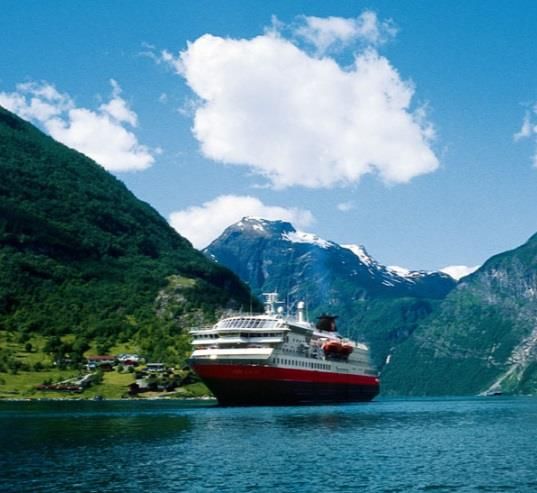
Capacity deployment from 2021 and onwards to be split 50/50 between Expedition and
 Norwegian Coast

                          2020 year end                                                          2021                            Estimated available passenger cruise nights per segment
           Norwegian Coast                              Expedition           Expedition                 Norwegian Coast      Available passenger cruise nights (thousands)
                                                                                                                                                                                             Expedition segment expected to constitute
                                                                                                                                                                                             more than half of total capacity from 2021
                                                                                                                                                                                               and onwards. With the higher yield per
                                                                                                                                                                                              PCN this is expected to drive topline and
                                                                                                                                                                                              EBITDA growth when travelling resumes
      MS Vesterålen              MS Lofoten1                MS Fram                                        MS Vesterålen         85%       15%               81%       19%                                 post Covid-19
                                                                             MS Spitsbergen

                                                                                                                                1 619                       1 649
                                                                                                                                                                                          341       552
       MS Nordnorge              MS Trollfjord          MS Nordstjernen2        MS Maud                     MS Nordnorge
                                 (MS Maud)                                    (MS Trollfjord)
                                                                                                                                                                                         45%       55%                37%       63%

                                                                                                                                                                                         1 059     1 062                       1 080
       MS Nordkapp             MS Finnmarken                                  MS Eirik Raude                MS Nordkapp
                             (MS Otto Sverdrup)                               (MS Midnatsol)                                                                                                                          943

        MS Polarlys                        MS Spitsbergen                    MS Otto Sverdrup                MS Polarlys
                                                                             (MS Finnmarken)                                                                            489

                                                                                                                                            288

     MS Richard With                         MS Midnatsol                       MS Fram                    MS Richard With
                                           (MS Eirik Raude)

                                                                                                                                     2019                        2020e                       2021e                         2022e

        MS Nordlys                                     MS Fridtjof Nansen   MS Fridtjof Nansen               MS Nordlys             1 907                        2 128                       2 121                         2 023 3

                                                                                                                                 Norwegian Coast            Expedition             Total available passenger cruise nights

      MS Kong Harald                                  MS Roald Amundsen     MS Roald Amundsen              MS Kong Harald           % of total available passenger cruise nights
                                                                                                                                    Yield based on gross booking revenue (EUR)
                                                                                                                             Note that yield based on booking figures does not include all revenue streams (such as e.g.
1)   Will be taken out of service in December 2020                                                                           onboard spending) and can not be compared to yield calculated based on reported figures
2)   Time charter used for Svalbard cruises
3)   APCN reduced due to expected LNG docking of MS Kong Harald
                                                                                                                                                                                                                                          6
GET READY TO EXPLORE - Company presentation - Cision
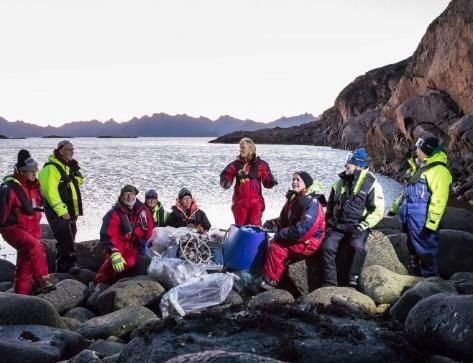
Sustainability is at the core of Hurtigruten’s way of operating
Several tangible initiatives to leave a footprint that our company and our guests can be proud of and to achieve the 2040 zero emission target

                                                                                                                                                                           Member/partner of climate/polar organisations and initiatives
                                                                          • First major travel company in the world and first cruise line to remove single-
                                                                            use plastic from all its ships and hotels
     Hurtigruten is a sustainability pioneer within the cruise industry

                                                                          • On track to reduce plastic waste by 32 tons annually

                                                                          • Advocates for a total ban on HFO1 – has used MGO/MSD1 since 2009
                                                                          • Have built the world’s first hybrid-electric powered expedition cruise ships
                                                                          • Will retrofit several ships with LNG propulsion, also compatible with climate-
                                                                            neutral biogas, paving the way for low emission shipping on all routes

                                                                          • Takes an active role to reach zero emission target by 2040 through investing
                                                                            in R&D of fossil-free fuel alternatives                                           UN Sustainable Development Goals interrelated in the core of our operations
                                                                                                                                                                                     and governance system2

                                                                          • Arranges beach clean-ups and climate lectures to raise awareness
                                                                          • Invites all guests to join crew members picking up litter at all destinations
                                                                            where this is possible

                                                                                                                                                                Examples:

                                                                          • Focuses on minimising food waste
                                                                                                                                                                 “All employees of Hurtigruten
                                                                          • Dedicated to enhancing local communities – sources food and
                                                                                                                                                                       shall be given equal
                                                                            services/activities from local suppliers                                             opportunities for employment
                                                                                                                                                                and professional development,
                                                                                                                                                                   regardless of their gender,
                                                                                                                                                               ethnic and cultural background,
                                                                          • Has established Hurtigruten Foundation to support great sustainability             religion, age, sexual orientation,
                                                                                                                                                                      functional ability, and
                                                                            initiatives                                                                                   political view”
                                                                          • Conserving the world’s polar bear population, fighting against marine and            HRG gender equality policy
                                                                            plastic pollution and supporting local initiatives                                                excerpt

1) HFO = Heavy fuel oil, MGO = Marine gas oil, MSD = Marine special distillate
2) Selected UN Goals

                                                                                                                                                                                                                                            7
GET READY TO EXPLORE - Company presentation - Cision
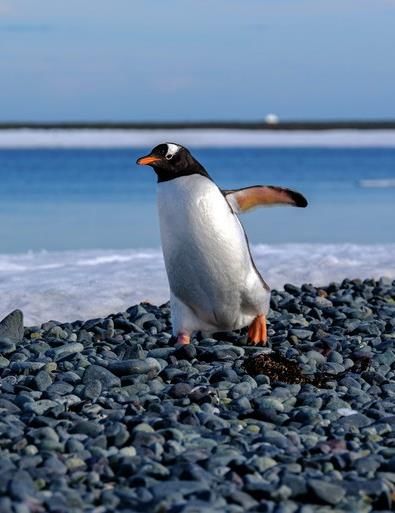
Well positioned for the rebound when travel resume in 2021 through fleet size,
 distribution platform, brand recognition and digital customer ownership

                                            Fleet size                                                                                  Distribution platform                        Brand recognition                       Digital and customer ownership
                              Large and flexible fleet….                                                                   Local distribution teams on the ground in key   Unique, powerful and well-known brand        Hurtigruten is investing in digital development in
                                                                                                                                             markets…                                                                    order to strengthen customer ownership and
                                                                                                                                                                                 Hurtigruten brand awareness3             reduce the future customer acquisition cost
                     Unique, purpose-built and versatile fleet

                                                                                                                                                                                                                  91%        How Hurtigruten creates customer ownership:
                                                                                                                                                                                                                  93%
                                                                                                                                                                                                                         Identify customers and capture contact information
                                                                               Vessels                                                                                                                          84%      ⚫   Resilient customer database where insight regarding guests is
                                                                                                                                                                                                                             connected
                                                                                                                                                                                                                84%
                                                                                       16                                                                                                                                ⚫   Previous trips, preferences, excursions, feedback, etc.

                                                                                                                                                                                                     59%
                                                                                                                                                                                                     59%
                                                                                                                                                                                                                               Provide a seamless customer journey from
         …with leading position in the expedition                                                                                      …driving sales in all regions
                                                                                                                                                                                                                                         inspiration to booking
          market and a unique 500 pax offering                                                                                                                                                43%
                                                                                                                                                                                                                         ⚫   New B2B portal aimed at strengthening relationships with agents
                                                                                                                                                                                               45%
  Expedition cruise market capacity in 2021 (# of berths)1                                                                            2021 booked revenue by geography2                                                  ⚫   Significant investments in B2C sites tailored to each of the main
                                                                                                                                                                                                                             markets
       3 670

                                                                                                                                                                                 9%
                                                                                                                                      10%                                        8%
                     2 462

                                                                                                                                                                                                                             Provide value-added services while travelling
                                                                                                                                                                                                                         ⚫   Guests get access to value-added services, incentivising
                                                                                                                                                                    DE           6%
                                                                                                                                                                                                                             customer to self-register and add details of previous trips
                               1 105

                                                                                                                                                                                            Increasing awareness in
                                                                                                                                                                                 6%
                                       972

                                                                                                                                                                    EMEA                      US – large remaining
                                                  854

                                                                                                                                                                                                                         ⚫   Hurtigruten App, MyPage, Expedition Logbooks, etc.
                                                                746

                                                                            714

                                                                                                                           22%
                                                                                        552

                                                                                                                                                         43%
                                                                                                   420

                                                                                                               406

                                                                                                                                                                    FR                       potential for increased
                                                                                                                                                                                4%            awareness in growth
                                                                                                                                                                    NO
                                                                                                                                                                                4%                  markets
                                       Lindblad

                                                                Silversea

                                                                                                               Oceanwide
                                                  Hapag-Lloyd
    CIN definition

                                                                                        UnCruise
     Hurtigruten,

                     Ponant

                                                                            Seabourn

                                                                                                   Australis
                               Quark

                                                                                                                                                                    UK                                                                      Inspire and sell next trip
                                                                                                                                                                    US                                                   ⚫   Provide inspiration and offers for future trips through a
                                                                                                                                 8%                                             3%                                           combination of channels (e.g. app, e-mail, onboard screens)
                                                                                                                                       5%                                       4%               2018      2019          ⚫   Analytics and algorithms to build targeted offers and
                                                                                                                                             7%                                                                              communication

Source: Cruise Industry News – 2019 Expedition Market Report
1) Scenic is excluded due to uncertainty with regards to delivery of Scenic Eclipse II as the yard is in financial distress
2) Port-to-port included in Nordic. As of 13 January 2020
3) Question: Which of the following exploration/adventure/expedition cruise companies are you aware of? N = 2 500                                                                                                                                                                                8
GET READY TO EXPLORE - Company presentation - Cision
Majority of customer base in Northern Europe provides a good foundation for a swift rebound post Covid – 19
Northern Europeans have multiple options when planning a voyage with Hurtigruten due to favourable location and communication

 Hurtigruten is well positioned to bounce back quickly post Covid-19 with its
    customer base and key itineraries centered around Northern Europe                                      Direct flights and other transportation alternatives

⚫   With Covid-19 guidelines still restricting international travel in most Northern     Direct flights from large
                                                                                         cities in Europe to Bergen
    European countries, non-diversified cruise lines dependent on passengers
    from all corners of the world are experiencing extraordinary hardship                                              Northern Europe is both a
                                                                                           London - Bergen
                                                                                                                      destination and core source
⚫   Hurtigruten is relatively well-positioned in the cruise segment, with a majority                                     market to Hurtigruten
                                                                                          Hamburg - Bergen
    of the customer base located in Northern Europe – in close proximity to the
    itineraries                                                                            + 40 other cities

⚫   When restrictions are gradually lifted all over Europe, domestic travel within
                                                                                        European cities where
    the European Union and Norway is expected to surge                                  Hurtigruten has turn around
⚫   Direct flights from large European cities to Bergen greatly enhances the                London/Dover
    attractiveness of Hurtigruten as a travel destination
                                                                                              Hamburg
⚫   Starting sailing with Dover and Hamburg as turnaround ports to cater for close
    proximity for these markets to embark the ship.
⚫   Hurtigruten is monitoring the development of the Covid-19 pandemic                 Share of European guest
                                                                                       in pre Covid 19 2020
    continuously and evaluate whether or not we are of the opinion that it is safe     bookings
    to sail
                                                                                          Germany – 41%

                                                                                             UK – 17%

                                                                                                                                                             Direct flight
                                                                                           Nordics – 20%
                                                                                                                                                             European port
                                                                                        Rest of Europe – 12%

                                                                                                                                                                             9
1

    Business Update 1H 2020

                              10
1H 2020 Update

  The Covid-19 pandemic has temporarily decreased the level of travel and the cruise-based travel industry has more or less
  laid up their fleet until Q4 2020

  Hurtigruten started operating the Coastal segment on the 16th of June and is now currently operating 6 ships in the Bergen to
  Kirkenes service. Hurtigruten initiated Expedition sailings with the first cruise starting out of Hamburg on the 24th of June
  cruising along the Norwegian coast before returning to Hamburg

  Hurtigruten has temporarily paused all expedition cruises until the start of the 2020 Antarctica season due to the increased
  level of Covid-19 infections in Europe and the Covid-19 case on MS Roald Amundsen in the beginning of August

  The Antarctica season for Q4 2020 and Q1 2021 is currently under review in light of the recent surges in infection levels of
  Covid-19 in Europe and the operating environment in South America. The safety of our crew and guests will always be our
  top priority

  The liquidity situation of Hurtigruten is good, as of 30th of June Hurtigruten had a liquidity position of EUR 174 million of cash
  and cash equivalents and another EUR 32 million in expected and committed Covid-19 government backed loans and grants

  Pre-booking levels for 2021 are developing according to planned booking curves with demand coming from Q2 2021 and
  onwards. There is no sign of increased level of cancellations after the MS Roald Amundsen incident
                                                                                                                                       11
Key operational and financial considerations under Covid-19

  I                                ⚫   Hurtigruten has introduced enhanced health and safety procedures which has received great
       Safe operations under a         feedback from our guest
          new environment
                                   ⚫   Expedition cruising can be offered under a new operating environment without jeopardizing the
                                       experience

  II    Execution of a funding     ⚫   Raised additional EUR 105 million in funding in June 2020 that increased the financial flexibility
       plan to ensure sufficient   ⚫   Deferral of EUR 160 million of non critical capex for the period Q2 2020 to Q4 2021
         liquidity through the
            Covid-19 crisis        ⚫   Temporary suspension of leverage ratio covenants in the RCF to the end of 2021

                                   ⚫   The demand for the Expedition cruise product is still present with bookings for 2021 developing
 III                                   according to the revised plan
       Demand for expedition       ⚫   Good interest for sailings starting in Q2 2021 and onwards with no visible effect from the MS
        cruises are still there        Roald Amundsen incident
                                   ⚫   Normalisation of global travel patterns expected in 2H of 2021 with Hurtigruten positioned for
                                       earlier ramp up with key source markets close by like Germany, UK and the Nordics

                                                                                                                                            12
Strong customer satisfaction after start-up of operations shows the appreciation from
      our guests with regards to the product

                                                                                   Monthly NPS Score1
     Net promoter score (NPS)

                                                                                                                                             Suspended operations

85                                                                                                                                                                               82
       81
80
                                                   76                                                                             76                                                             76              75
75                                                                 72
                                                                                   70                             69
70

65                                                                                                 62
60                  59

55

50
                                   47
45

40

35

30

25

20

15

10

5

0
Jul-19           Aug-19         Sep-19           Oct-19         Nov-19          Dec-19          Jan-20         Feb-20          Mar-20          Apr-20         May-20           Jun-20          Jul-20         Aug-20

      1) Net Promoter Score calculated by scores from customers travelling on an expedition cruise or on coastal voyage (costal voyage = 6 or more cruise nights). NPS score includes the MS Roald Amundsen sailings in July 2020   13
      Source: Hurtigruten, Facebook
Strong customer satisfaction supports robust booking development for 2021, with current
2021 bookings 7% higher compared to same time last year for the period Q2-Q4 2021
                   Booking status as of 4th of September 2020 (EURm)1                                                                                                                 Comments
                                     78
                         80                                              67                                                       2020              ⚫   The booking level for Q2-Q4 is 7 % higher compared to same time last year
                                                               58              57         60
                         60                    53                                                                                 2021
 Bookings for                                                                                                                                       ⚫   80% of the bookings for 2021 is cash bookings and 20% is voucher bookings
                         40                                                                             29            26
  next year                                                                                                                                         ⚫   Approx. EUR 35 million in vouchers which represents EUR 60 million in gross
                         20
                                                                                                                                                        booking value not yet rebooked to a 2021 sailing
                             0
                                          Q1                        Q2               Q3                          Q4

                             15                                                                                                                     ⚫   Inflow over the last 30 days is lower compared to same period last year driven
                                                               11                                                                 2020
                                                                                10                                                                      postponement of early bird campaign in Germany to October
                             10       8                                                                                           2021
Booking inflow                                                                             4
                                                                                                         6
                                                                                                                       7
                                                                                                                                                    ⚫   The recent increase in infections rates across Europe and in Norway is affecting
                                 5                                        3
last thirty days                                                                                                                                        new bookings for 2021
                                 0
                                                -2
                                                                                                                                                    ⚫   No increase in cancellations compared to same period last year for the period Q2-
                             -5                                                                                                                         Q4 2021
                                          Q1                        Q2               Q3                          Q4

                         15                                                                                                       2021
                                                               11
2021 and 2022            10
                                               10                                                                                 2022
                                                                                                                                                    ⚫   We are seeing an increased booking inflow for 2022 driven by interest especially in
                                                                                                                                                        Q1 2022
 booking and                 5                                                                               4
                                                                                          2                                                         ⚫   We are launching the rest of the 2022 season this fall
    inflow
                             0
                                                    Bookings                                  Last 30 days

                                                        Gross yield trending higher on all ships for 2021, particularly with expedition ships
                                                       Amundsen class vessels                                                            Coastal                         Norway Expediton (Millenium class)

                     ’20 / ’21                                                                       +7%                                                                                                         +24%
                                                                     EUR 561 / 603                                                  EUR 289 / 341         +18%                        EUR 328 / 407
                     EUR per PCN
                                                                                                                      Vesterålen, Nordlys, Nordkapp, Richard With,                                                                          14
                     Ships                            Roald Amundsen, Fridtjof Nansen                                                                                        Midnatsol, Finnmarken, Trollfjord
                                                                                                                           Polarlys, Kong Harald, Nord Norge
2

    Key Financials

                     15
1H and Q2 numbers significantly impacted by Covid-19

                   Reported Total Revenue (EURt)                                                                           Normalised Adjusted EBITDA1 (EURt)                                                                                              Reported EBITDA (EURt)
                                                                                                             Margin 28 %                            -13 %                     22 %                        9%                                    25 %                   -35 %                       19 %        5%
                                                                                                             (%)

                                                                                                                                                                                                                                                                                                   54,194
                                                                                                                                                                             64,418
                                                            283,511
                                                                                                                                                                                                                                                38,497
                                                                                                                        44,701
                                                                                    171,526
            154,082
                                                                                                                                                                                                                                                                                                              8,764
                                                                                                                                                                                                       15,255

                                     31,352                                                                                                                                                                                                                             -11,048
                                                                                                                                                   -3,975

           Q2 2019                Q2 2020                First half              First half                          Q2 2019                   Q2 2020                  First half                 First half                               Q2 2019                  Q2 2020                 First half     First half
                                                           2019                    2020                                                                                   2019                       2020                                                                                      2019           2020

       •      Revenue in the first half of 2020 down 39.5% to EUR 171.5 million. Total reported EBITDA in first half of 2020 decreased with EUR 45.4 million (83.8%) to EUR 8,8
              million compared to same period last year.

                    •      Main revenue items in Q2 2020 are revenue generated from sailings in June 2020 and contractual revenues from the Norwegian state agreement.

       •      Group revenue decrease by EUR 79.7% to EUR 31.3 million in the second quarter of 2020 compared to Q2 2019

                                                                                                                                                                                                                                                                                                                         16
1) Normalized adjusted EBITDA is calculated as Reported EBITDA excluding other gains and losses adjusted for cost and revenue items which is deemed extraordinary, exceptional, unusual or non-recurring. Due to the Covid-19 pandemic we have decided not to do any normalizations for Q2 2020.
Solid cash position at the end of June 2020

EURt                                                                                     2018            2019         First half 2020    Q2 2020                                          Commentary

                                                                                                                                                        ⚫   Negative cash flow in Q2 of EUR 30.5m mainly driven by working capital
                                                                                              105 196      141 425              9 559        (30 597)       items
Operating Cash flow
                                                                                              (16 779)      13 147            (15 966)       (31 408)
Of which change in working capital1                                                                                                                     ⚫   Levels of prepayments for future travel was kept stable due to a
                                                                                                                                                            combination of inflow of new cash bookings and relative low level of refund
                                                                                                                                                            claims
                                                                                            (136 775)     (396 575)           (92 593)       (20 102)
Cash flow from investments
                                                                                                                                                        ⚫   Change in working capital mainly driven by chew up of payables and
                                                                                              (34 305)    (405 380)           (86 632)       (12 616)       accrued expenses as operations was temporary seized in March
Of which CAPEX

                                                                                                                                                        ⚫   Decrease in investment level in current half year is due to the construction
                                                                                                                                                            of both MS Roald Amundsen MS Fridtjof Nansen in 2019, with no similar
                                                                                                38 122     251 933           214 607         92 117
Cash flow from Financing                                                                                                                                    event in second quarter 2020.

                                                                                                98 651     290 091           250 257        102 593
Of which change in debt                                                                                                                                 ⚫   In June Hurtigruten raised an additional TLB of EUR 105 million to improve
                                                                                              (59 662)     (32 487)           (33 331)        (9 753)       the liquidity position of the company.
Of which paid interest and transaction costs

Note: All numbers presented are based on Hurtigruten Group AS on a consolidated basis.
1) Change in working capital calculated as Inventories + Receivables – Pre bookings and Payables.                                                                                                                                      17
Net cash burn rate of EUR 10 million per month in Q2 2020 before working capital

                                               Net expenses of ~EUR 9.9 million per month following reduction measures                                                                                    Comments

                                             EURm 0 1 2 3 4 5 6 7 8 9 10 11 12 13 14 15 16 17 18 19
                                                                                                                                                                                         ⚫   Reduction in Cruise operating expenses in
                                                                                                                                                                                             the range of 58% compared to baseline
                                                                                                 ⚫     ~58% reduction in Cruise operating expenses compared to normal operations             operations.
                                                                       11.9                      ⚫     Marketing reduced to a minimum, only critical personnel remains, consultants
                                          OPEX
                                                                                                       stopped
                                                                                                 ⚫     Fuel costs reduced to minimum during harbor, R&M postponed, port costs reduced
                                                                                                                                                                                         ⚫   Revenue from the Public Service contract
                                                                                                  ⚫    Total revenues of EUR 10.5 million per month, Including EUR 6.4 million in
                                        Revenues                           10.5                        contractual revenues. Contractual revenues to be received also for warm-stacked
                                                                                                                                                                                             with the Norwegian Government,sailings
                                                                                                       vessels in 2020                                                                       that was resumed in June and the Covid-
  Q2 Monthly average cash expenses

                                                                                                                                                                                             19 grant from the Norwegian Government
                                        BB charter                                               ⚫     ~EUR 0.9 million amortization
                                                         1,4
                                                                                                 ⚫     ~EUR 0.5 million interest

                                                                                    6.6                                                                                                  ⚫   EUR 10 million monthly cash burn
                                         Net opex      2.8                                       ⚫     Monthly average cash expense in Q2 2020                                               including BB charters in Q2 2020, pre
                                                                                                                                                                                             working capital changes
                                                                                                 ⚫     Interest on TLB, Explorer II bond and RCF paid semi annually, August and
                                      Debt service                                  2.9                February. Svalbard/Kirkenes facilities paid quarterly
                                                               2.9
                                                                                                 ⚫     ~EUR 0.1 million amortization ~EUR 2.8 million interest                           ⚫   Working capital outflow driven by
                                                               9.0                                                                                                                           payables, accrued expenses and refund
                                                                                                                                                                                             payments as operations was temporary
                                         Capex                                4.2                ⚫     Among others docking of MS Fram and MS Roald Amundsen
                                                                                                                                                                                             suspended in March

                                          Net
                                       expenses
                                                                     9.9                          ⚫    Monthly average expense in Q2 2020                                                ⚫   Approx. EUR 20 million in refund claims
                                                                                                                                                                                             paid YTD
                                      Change in                                           8.5   8.5⚫   Change in working capital per month in Q2 2020
                                     working capital

                                                                                                                                                                                                                                         18
Net debt as of Q2 2020

                                                                    NIBD (EURm)1                                                            Change in net interest bearing debt – YE 2019 to end Q2-20
                                                                                                                                  EURm

                                                                                                               1.057
                                                                                                                                      Debt elements         Cash elements
                                                                                                                84
                                                                                                                                                                                         93
                                                                                                                                                                       10                               215
                                         940
                                          40                                                                                                                                                                                           1 057
                                                                                                                                                      244                                                                  5

                                                                                                               645                    940
                                                                                                                                                                                                       Increase in total cash,
                                                                                                                                                 (EURm)                                                    incl. restricted:
                                                                                                                                                 Change in RCF                                  44           EUR127m
                                         643                                                                                                     New TLC                                        95
                                                                                                                                                 New Explorer II bond                          295
                                                                                                                95                               ECA loan repaid                              -245
                                                                                                                                                 RW & NL lease                                  56
                                                                                                                                                 TLB; change in balance of amort. fees           2
                                           0
                                                                                                               295                               Change in Svalbard loans                       -1
                                         245                                                                                                     MS Spitsbergen Sale Leaseback                  -2
                                                                0
                                                                0                                       43                                       Kirkenes DNB Transje A & B                      0
                                45                              2                                                        56   2                  Change in interest bearing debt               244
                                                    11                                                  10
                                47                                                                                                               Of which FX effects                             1
                                                                                                               174

                                     31-Dec-19                                                               30-Jun-20

                 RCF                              RW / N Lease
                 Term Loan B                      Svalbard loans                                                                  NIBD YE 2019     Change in      Net CF from      Net CF from       Net CF from     FX effects on    NIBD per
                                                                                                                                                    interest       Operating       Investment         Financing     cash elements    end Q2-20
                 Term Loan C                      Kirkenes loans
                                                                                                                                                  bearing debt     activities       activities        activities
                 Explorer II ECA                  Cash
                 Explorer II Bond
                 Spitsbergen Lease

Note: All numbers presented are book value and based on Hurtigruten Group AS on a consolidated basis.                                                                                                                                            19
1) Excluding IFRS 16 debt of EUR 17m at year-end 2019 and EUR 14m at end of Q2 2020.
3

    Summary and Outlook

                          20
Summary

                                      ⚫   Hurtigruten’s differentiated destinations in regions with low level of infections and small ship focus position us
  I                                       well as the cruise industry emerges from Covid-19
       Hurtigruten will have a good
        position coming out of the    ⚫   Key source markets in Northern Europe are close to the key destinations we are sailing to
                  crisis
                                      ⚫   Hurtigruten has operated 6 ships over the last 3 months in the Coastal segment with the ability to test post
                                          Covid-19 operating procedures

                                      ⚫   Swift execution of firm wide cost cutting program and postponement of non critical capex
 II                                   ⚫   Raised additional EUR 105m in funding in June 2020 and have as of 30th of July a liquidity position of EUR
         Hurtigruten has a solid          195 million
           liquidity position
                                      ⚫   Lower level of refund claims in % of prepayments of cancelled sailings compared to industry average

                                      ⚫   Average monthly cash burn (before customer refunds and working capital) in current environment of EUR in
                                          the range of EUR 12-15 before working capital items

 III                                  ⚫   Hurtigruten is relatively well-positioned in the cruise segment, with a majority of the customer base located in
                                          Northern Europe – in close proximity to the routes- as restrictions are gradually lifted all over Europe,
       Pent up demand for travel          domestic travel within the European Union and Norway is expected to surge
       experiences post Covid-19
                                      ⚫   2021 Pre-booking levels for 2021 are developing according to planned booking curves with demand coming
                                          from Q2 2021 and onwards

                                                                                                                                                               21
Appendix

           22
Suspended operations due to COVID-19 affects 1H and Q2 numbers

                                                                                                                                                                                                                                                Commentary
                                                                                    CAGR: 7%
                                                                                                                         608 815
   Reported Total                                   527 094
                                                                                      566 174                                                                                                     ⚫    Suspended operations for both coastal and Expedition segment due to
                                                                                                                                                           496 829
     Revenue                                                                                                                                                                                           Covid-19 affects numbers for Q2 2020 significantly.
      (EURt)
                                                                                                                                                                                                  ⚫    Hurtigruten temporarily suspended most of the operations from 18th
                                                                                                                                                                                                       March. 2 out of 16 ships was kept in operation on a shortened route in
                                                                                                                                                                                                       Northern Norway serving local communities with freight and local
                                                                                                                                                                                                       transport services.
                                                      2017                              2018                               2019                        Q2 2020 LTM

                                                                                                                                                                                                  ⚫    There was underlying growth in January and February driven both by
                                                                                    CAGR: 17%
                                                                                                                                                                                                       the inclusion of MS Roald Amundsen to the expedition fleet, giving an
                                                                                                                         144 989                                                                       increased capacity, as well as a significant growth in yield in both the
  Normalised Adj.                                                                      128 171                                                                                                         Expedition and Coastal segment before the Covid-19 pandemic broke
     EBITDA                                         106 790
                                                                                                                                                            95 826                                     out in March.
      (EURt)1

                                                      2017                              2018                               2019                        Q2 2020 LTM

                                                                                   CAGR: 18%

                                                                                     123 168                            123 169
       Reported
        EBITDA                                      87 877
                                                                                                                                                           77 739
        (EURt)

                                                     2017                              2018                               2019                         Q2 2020 LTM

1) Normalized adjusted EBITDA is calculated as Reported EBITDA excluding other gains and losses adjusted for cost and revenue items which is deemed extraordinary, exceptional, unusual or non-recurring. Due to the Covid-19 pandemic we have decided not to do any normalizations for Q2 2020.
                                                                                                                                                                                                                                                                                                   23
1H and Q2 2020 segment overview – Norwegian Coast

                                                           Net Ticket Yield1 (EUR)                                                                                                                                                          Occupancy Rate4 (%)
                                         -21%
                      221                                                                                                                                                                               87%                                                                        85%
                                                                                                    191                                    191
                                                             175

                                                                                                                                                                                                                                                                                                                         32%

                                                                                                                                                                                                                                               5%

                 Q2 2019                                Q2 2020                         First half 2019                        First half 2020                                                     Q2 2019                               Q2 2020                        First half 2019                       First half 2020

                                                          Net Ticket Revenue (EURt)                                                                                                                                      Normalised adjusted EBITDA 2,3 (EURt)
                                                                                                                                                                                   Margin             51 %                                  513 %                               47 %                                   60 %
                                                                                                  129,709                                                                          (%)
                                                                                                                                                                                                                                                                              87,285

                      78,178                                                                                                                                                                       55,984
                                           -95%
                                                                                                                                          47,388                                                                                                                                                                    38,489

                                                                                                                                                                                                                                         11,553
                                                              3,719

                   Q2 2019                               Q2 2020                          First half 2019                       First half 2020                                                Q2 2019                               Q2 2020                         First half 2019                       First half 2020

    •       Stable Net Ticket Yield when comparing first half of 2020 to the same period last year. Net Ticket Yield decreased by 21% in Q2 2020 compared to Q2 2019.

    •       Decreased occupancy in first half of 2020 driven by Covid-19, with a small-scale start-up of operations on 16th of June. Only 2 ships sailing between Bodø and
            Kirkenes until 16th of June, mainly for local transportation and freight to communities in the north of Norway. Remaining ships have been warm stacked.

    •       Significant drop in Net Ticket revenue and normalized adjusted EBITDA due to suspension of operations.
1) Net Ticket Yield is defined as Net ticket revenues per PCN.                                                                                                                                                                                                                                                                        24
2) SG&A not allocated on segment level.
3) Normalized adjusted EBITDA is calculated as Reported EBITDA excluding other gains and losses adjusted for cost and revenue items which is deemed extraordinary, exceptional, unusual or non-recurring. Due to the Covid-19 pandemic we have decided not to do any normalizations for Q2 2020.
4) Occupancy rate is calculated based on APCN (available capacity) including any laid-up period. In 2020, due to the Covid-19 pandemic, the majority of the ships were in warm-stack since the middle of March. Adjusting APCN for the laid-up period caused by the Covid-19 pandemic, including only the available capacity on the
actual sailings, the occupancy rate was 26.9% for Q2 2020 and 61.5% for 1H 2020.
1H and Q2 2020 segment overview – Expedition

                                                           Net Ticket Yield1 (EUR)                                                                                                                                                          Occupancy Rate4 (%)
                                                                                                                                                                                                                                                                                   73%
                     390                                                                                                                      447
                                                                                                      360

                                                                                                                                                                                                     52%

                                                                                                                                                                                                                                                                                                                          30%

                                                                                                                                                                                                                                             0%
                                                             -934
                                                                                                                                                                                                Q2 2019                                Q2 2020                          First half 2019                       First half 2020
                Q2 2019                                 Q2 2020                           First half 2019                         First half 2020

                                                        Net Ticket Revenue (EURt)                                                                                                                                       Normalised adjusted EBITDA 2,3 (EURt)
                                                                                                                                                                                   Margin
                                                                                                                                                                                                      26 %                             35596 %                                  33 %                                     15 %
                                                                                                                                       35,411                                      (%)
                                                                                                                                                                                                                                                                               15,840
                                                                                                28,208
                                                                                                                                                                                                                                                                                                                     7,665
                                                                                                                                                                                                    5,996

                   10,475

                                                           -712                                                                                                                                                                         -10,812

               Q2 2019                                Q2 2020                         First half 2019                        First half 2020                                                    Q2 2019                              Q2 2020                         First half 2019                       First half 2020

       •        Operations in the expedition segment was reduced to a minimum in Q2 2020 as all expedition sailings were suspended, but operations were partly resumed
                again in end of June with MS Fridtjof Nansen sailing from Hamburg to the Norwegian Coast.

       •        For the first half of 2020, revenues were up 23.2% from EUR 40.9 million to EUR 50.4 million despite the Covid-19 pandemic. This is due to the inclusion of
                MS Roald Amundsen in second half of 2019. Net ticket revenue for the first half year was up 25.5% from last year to EUR 35.4 million.
1) Net Ticket Yield is defined as Net ticket revenues per PCN.                                                                                                                                                                                                                                                                        25
2) SG&A not allocated on segment level.
3) Normalized adjusted EBITDA is calculated as Reported EBITDA excluding other gains and losses adjusted for cost and revenue items which is deemed extraordinary, exceptional, unusual or non-recurring. Due to the Covid-19 pandemic we have decided not to do any normalizations for Q2 2020.
4) Occupancy rate is calculated based on APCN (available capacity) including any laid-up period. In 2020, due to the Covid-19 pandemic, the majority of the ships were in warm-stack since the middle of March. Adjusting APCN for the laid-up period caused by the Covid-19 pandemic, including only the available capacity on the
actual sailings, the occupancy rate was 26.9% for Q2 2020 and 61.5% for 1H 2020.
Historical key financials

EURt
P&L items                                                                                      2017                               2018                               2019                   Q2 2020 LTM
Revenue                                                                                    527 094                            566 174                            608 815                            496 829
Growth                                                                                      11,9 %                               7,4 %                              7,5 %                           -18,4 %
Contribution1                                                                              187 415                            204 427                            234 987                            185 402
Contribution %                                                                              35,6 %                             36,1 %                             38,6 %                             37,3 %
EBITDA                                                                                       87 877                           123 168                            123 169                              77 739
EBITDA margin                                                                               16,7 %                             21,8 %                             20,2 %                             15,6 %
                                2
Normalised adj. EBITDA                                                                     106 790                            128 171                            144 989                              95 826
Normalised adj. EBITDA margin                                                                 20 %                               23 %                                 0%                                  0%
EBIT                                                                                         36 416                             72 538                             67 582                             18 972
EBIT margin                                                                                   6,9 %                            12,8 %                             11,1 %                               3,8 %
Net interest and other financial costs                                                     (53 644)                           (52 929)                           (28 239)                           (46 401)
Net currency gains / losses                                                                (37 003)                           (13 511)                             9 793                            (18 706)
Net income                                                                                 (56 935)                            46 845                            (17 821)                           (45 874)
Net income margin                                                                          -10,8 %                               8,3 %                             -2,9 %                             -9,2 %

BS items                                                                               31.12.2017                         31.12.2018                         31.12.2019                         30.06.2020
Cash3                                                                                       44 633                             56 449                             47 028                           173 733
Total current assets                                                                      101 674                            118 143                            112 878                            232 715
Total assets                                                                              838 069                          1 011 173                          1 393 674                          1 484 995
Total equity                                                                                53 511                             68 981                             62 739                            (17 965)
Equity ratio                                                                                  6,4 %                              6,8 %                              4,5 %                             -1,2 %
                            4
Total current liabilities                                                                 709 488                            188 591                            333 475                            231 458
NIBD5                                                                                      543 110                            785 948                            939 715                          1 056 711

CF items                                                                                       2017                               2018                               2019                          Q2 2020
Change in NWC                                                                               (3 793)                           (16 779)                            13 147                            (31 408)
Operating cash flow                                                                         95 477                           105 196                           (396 575)                             30 597
Capex                                                                                      (37 368)                           (34 305)                         (405 380)                            (12 616)

Note: All numbers presented are based on Hurtigruten Group AS on a consolidated basis. All numbers are reported numbers unless stated.
1) Vessel contribution is defined as EBITDA contribution before SG&A, specifically calculated as revenue – total direct costs – total cruise operating expenses, 2) Refer to detailed breakdown of the adjustment on page [57], 3) Total cash including restricted cash, 4) The bond in the amount of EUR 455m, and the multicurrency
revolving credit Facility in the amount of NOK 779m were refinanced in February 2018, and as such were classified as current liabilities at 31 December 2017, 5) Book value of debt excluding IFRS 16 debt. IFRS 16 debt was EUR 17m at year-end 2019 and EUR 14m at end of Q2 2020, 6) Calculated as (Reported EBITDA –
Maintenance Capex) / Reported EBITDA.                                                                                                                                                                                                                                                                                                   26
Norwegian Coast segment – Key financials

EURm                                                                                    2017                               2018                               2019      LTM Q2 2020

PCNs - 000                                                                              1 249                              1 353                             1 314              884
APCNs - 000                                                                             1 646                              1 614                             1 619            1 594
Occupancy - %                                                                        75,9 %                             83,8 %                             81,2 %            55,5 %

Total Revenues reported                                                                   444                                439                               444              324
Of which: Contractual Revenue                                                               72                                 73                                  73            76

Direct Costs                                                                              102                                109                               105               66
Cruise Operating Costs                                                                    159                                166                               164              132
of which: Fuel costs                                                                        42                                 50                                  50            38

Reported Vessel Contribution1                                                             150                                164                               175              126
Vessel contribution margin                                                           33,7 %                             37,3 %                             39,4 %            39,0 %
Norm. Vessel       contribution2                                                          152                                164                               177              176

 •   All time high revenue and contribution from Norwegian Coast segment in 2019, driven by strong occupancy, stable PCN and positive
     yield development
              •    Revenue growth of 1.1% from 2018 to 2019
              •    -   Q2 LTM show a negative trend due to significant drop in revenue in Q2 2020 driven by Covid-19.
              •    Increase in contractual revenue by 4 % from 2019 to LTM Q2 2020.

 •   Vessel contribution margin remains stable due to cost savings. 13 ships have been warm-stacket until June 16th due to Covid-19.
     Actual warm stack cost excluding passenger costs for Q2 was approx. EUR 2.32 million per month for the 9 ships in the Coastal fleet.

1) Vessel contribution is defined as EBITDA contribution before SG&A, specifically calculated as revenue – total direct costs – total cruise operating expenses.
2) Due to the Covid-19 pandemic we have decided not to do any normalizations for Q2 2020.

                                                                                                                                                                                      27
Expedition segment – Key financials

 EURm                                                                                     2017                               2018                              2019      LTM Q2 2020

 PCNs - 000                                                                                 155                                167                                 222           223
 APCNs - 000                                                                                228                                231                                 288           445
 Occupancy - %                                                                         68,0 %                             72,1 %                             77,0 %           50,0 %

 Total Revenues reported                                                                      86                                97                                 135           145

 Direct Costs                                                                                 26                                34                                 43             45
 Cruise Operating Costs                                                                       32                                34                                 45             58
 of which: Fuel costs                                                                           7                                 8                                11             13

 Reported Vessel Contribution1                                                                27                                30                                 48             42
 Vessel contribution margin                                                            31,8 %                             30,4 %                             35,3 %           28,9 %
 Norm. Vessel        contribution2                                                            27                                35                                 56             48

  ⚫    Strong performance in the Expedition segment with revenue growth of 7.4 % from 2019 to Q2 2020 LTM, driven by both PCN and
       yield growth, despite negative Covid-19 effects.
  ⚫    Decreased occupancy due to travel restrictions.
  ⚫    Prior to Q2 2020 there was a strong utilisation on the Antarctica sailings and in the segment in general, which is expected to
       continue when operations are starting up.
  ⚫    The performance of the Expedition segment in 2020 will depend on the development of the pandemic and when we will be able to
       resume operations

1) Vessel contribution is defined as EBITDA contribution before SG&A, specifically calculated as revenue – total direct costs – total cruise operating expenses.
2) Due to the Covid-19 pandemic we have decided not to do any normalizations for Q2 2020.
                                                                                                                                                                                       28
Definitions

⚫   Passenger cruise nights (“PCNs”), measurement of guest volume, representing the number of guests onboard the ships and the length of their stay.
⚫   Available passenger cruise nights (“APCNs”), which is a measurement of capacity and represents the aggregate number of available berths on each of the ships (assuming double occupancy per cabin),
    multiplied by the number of operating days for sale for the relevant ship for the period.
⚫   Occupancy rate, PCNs for the relevant period as a percentage of APCNs for the period.
⚫   Gross revenues, ticket revenues, revenues from flights, hotels, transportation, food, beverage, shop and excursions as well as other passenger revenues, including car transportation, travel insurance and
    retained deposits in cases of cancellations.
⚫   Net revenues, Gross ticket revenues less commissions and costs of goods for flights, hotels, transportation, food, beverage, shop and excursions as well as other passenger services, including travel insurance.
⚫   Gross revenues per PCN, Gross ticket revenues divided by PCNs.
⚫   Net revenues per PCN, which represents Net ticket revenues divided by PCNs.

                                                                                                                                                                                                                        29
30
You can also read