Adani Ports and SEZ Limited - June, 2021

Page created by Roberta Cobb
 
CONTINUE READING
Adani Ports and SEZ Limited - June, 2021
Adani Ports and SEZ Limited

June, 2021
Adani Ports and SEZ Limited - June, 2021
Contents

     A     Group Profile

     B
           Transformational Journey of APSEZ

     C     Update of FY21

     D     Going Forward

     E     Opportunity embedded in Integrated logistics

     F     Capital Management and ESG

     G     Annexure

                                                          2
Adani Ports and SEZ Limited - June, 2021
Adani Group: A world class infrastructure & utility portfolio

                                                                                                                                                          Adani
            Transport & Logistics                                                                                      Energy & Utility
                                                                                                                                                           •   Marked shift from B2B to
                 Portfolio                                                                                                Portfolio                            B2C businesses–
                                                                                                                                                               •   ATGL – Gas distribution
 63.7%                                  100%                                                      75%                         56%                                  network to serve key
                                                                                                        ATL                      AGEL                              geographies across India
     APSEZ
                                              NQXT2
 Port & Logistics                                                                                       T&D                   Renewables                       •   AEML – Electricity
                                                                                                                                                                   distribution network
                  100%                                                                                               75%                   37.4%                   that powers the
                       SRCPL                                                                                           APL                      ATGL3              financial capital of
                        Rail                                          75%                                              IPP                   Gas DisCom            India
                                                                                                                                                               •   Adani Airports – To
                                                                         AEL                                                                                       operate, manage and
                                                                      Incubator                                                                                    develop eight airports in
                                                                                                                                                                   the country

                                                                                                                                                           •   Locked in Growth –
                                                                                                                                                               •   Transport & Logistics -
100%                         100%                                                                              100%                 100%                           Airports and Roads
  AAHL                         ARTL                                                                                   AWL               Data                   •   Energy & Utility –
 Airports                      Roads                                                                                  Water            Centre                       Water and
                                                              ~USD 131 bn1                                                                                          Data Centre (to form a
                                                                                                                                                                    JV with EdgeConneX )
                                                                Combined Market Cap

               Opportunity identification, development and beneficiation is intrinsic to diversification and growth of the group.
            1 . As on May 31st , 2021, USD/INR – 72.8 | Note - Percentages denote promoter holding
            2. NQXT – North Queensland Export Terminal | Light blue color represent public traded listed verticals                                                                             3
            3. ATGL – Adani Total Gas Ltd
Adani Ports and SEZ Limited - June, 2021
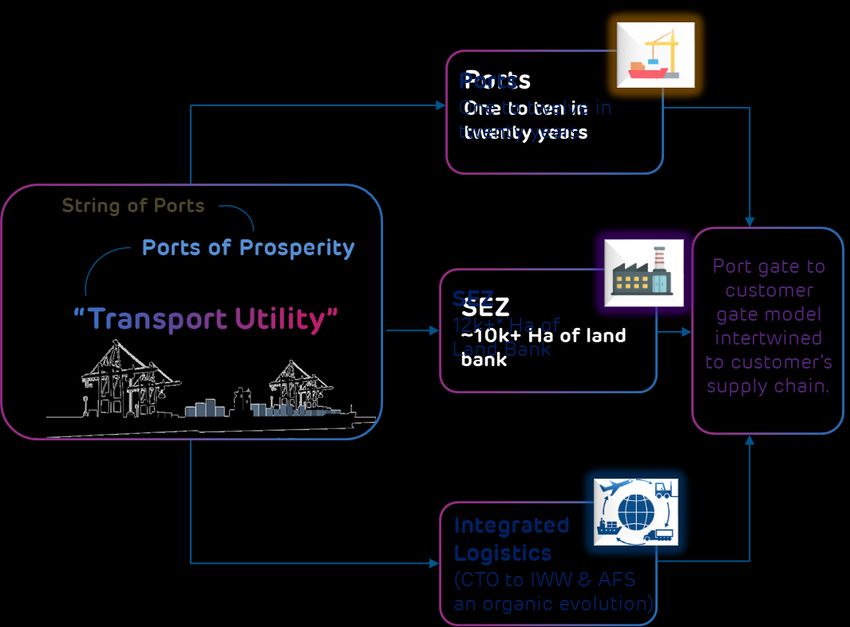
Adani Group: Decades long track record of industry best growth rates across sectors
Port Cargo Throughput (MMT)                                         Renewable Capacity (GW)                                                   Transmission Network (ckm)                                                  CGD7 (GAs8 covered)

                                      12%                                                                                                                                                                                                                  45%
                                                                                                        118%
                                                                                                                                                                                  20%
                        3x                                                               5x                                                                       3x                                                         30%
                                                                                                                                                                                                                                        1.5x

          4%                                                                                                                                           7%
                                                                              25%

        Industry                    Adani
                                    APSEZ                                  Industry                    AGEL
                                                                                                          Adani                                    Industry                        ATL                                     Industry                        AGL

2014        972 MT                 113 MMT                      2016              46 GW                    0.3 GW                         2016        320,000 ckm               6,950 ckm                      2015            62 GAs                      6 GAs
2021       1,246 MT                247 MMT                      2021             140 GW9                  14.8 GW6                        2021        441,821 ckm               17,276 ckm                     2021            228 GAs                    38 GAs

                   APSEZ                                                                   AGEL                                                                      ATL                                                               ATGL
       Highest Margin among                                              Worlds largest                                                            Highest availability                                              India’s Largest private CGD
       Peers globally                                                    developer                                                                 among Peers                                                       business
       EBITDA margin: 70% 1,2                                            EBITDA margin: 91% 1,4                                                    EBITDA margin: 92%1,3,5                                           EBITDA margin: 41%1
       Next best peer margin: 55%                                        Among the best in Industry                                                Next best peer margin: 89%                                        Among the best in industry

                                                                            Transformative model driving scale, growth and free cashflow
                   Note: 1 Data for FY21; 2 Margin for ports business only, Excludes forex gains/losses; 3 EBITDA = PBT + Depreciation + Net Finance Costs – Other Income; 4 EBITDA Margin represents EBITDA earned from power supply 5 . Operating
                   EBITDA margin of transmission business only, does not include distribution business. 6. Contracted & awarded capacity 7. CGD – City Gas distribution GAs 8. Geographical Areas - Including JV | Industry data is from market intelligence
                   9. This includes 17GW of renewable capacity where PPA has been signed and the capacity is under various stages of implementat ion and 29GW of capacity where PPA is yet to be signed’
                                                                                                                                                                                                                                                                   4
Adani Ports and SEZ Limited - June, 2021
Adani Group: Repeatable, robust & proven transformative model of investment

              Phase                                    Development                                    Operations                          Post Operations

                 Origination          Site Development                    Construction                       Operation                        Capital Mgmt
Activity

              • Analysis & market    • Site acquisition            • Engineering & design         • Life cycle O&M               • Redesigning the capital
                intelligence                                                                        planning                       structure of the asset
                                     • Concessions & regulatory    • Sourcing & quality levels
              • Viability analysis     agreements                                                 • Asset Management plan        • Operational phase funding
                                                                   • Equity & debt funding at                                      consistent with asset life
              • Strategic value      • Investment case development   project

                                                                                                                                     In FY21, APSEZ and its JV AICTPL
              India’s Largest        Longest Private HVDC           6 4 8 MW Ultra Mega          Energy Network Operation            issued three bonds amounting to
              Commercial Port        Line in Asia                   Solar Power Plant            Center (ENOC) enables               USD 1.55 bn international bonds
Performance

              (at Mundra)            (Mundra - Mohindergarh)        (at Kamuthi, TamilNadu)      centralized continuous              with 5-10 years maturity thus
                                                                                                 monitoring of solar and             elongating maturity profile and
                                                                    Constructed and
              Highest Margin            Highest line                Commissioned in              wind plants across India on         reducing WACC
              among Peers               availability                nine months                  a single cloud based
                                                                                                                                     AGEL’s issuance of $1.35Bn
                                                                                                 platform
                                                                                                                                     revolving project finance facility
                                                                                                                                     will fully fund its entire project
                                                                                                                                     pipeline

                                                                                                                                14%                            30%
                                                                                                                                                       50%
                                                                                                                               31%      55%
                                                                                                                                                               20%

                                                                                                                               March 2016             March 2021
                                                                                                                               PSU       Pvt. Banks    Bonds

                                                                                                                         All listed entities continue to maintain
                                                                                                                         liquidity cover of 1.2x-2x as a policy matter    5
Adani Ports and SEZ Limited - June, 2021
APSEZ : Transformational journey
                        Industry                                                                                 Business

        •     3x growth compared to market achieved without dilution                                     •   From a single port single commodity to an integrated
              in equity.                                                                                     logistics platform.
        •     Driving efficiency through mechanization at large scale.                                   •   Strategic partnerships to unlock value.
        •     Growing responsibly with a sustainable approach.                                           •   90% of economic hinterland coverage.
        •     Integrated logistics solution to customers through a                                       •   Business transformation from a port operator to
              single window mechanism.                                                                       transport and logistics utility.

                          O&M                                                                                      ESG

        •     Digitization of the platform through technology solutions                                  •   Formation of Corporate Responsibility committee
              (e.g. remote operating nerve center)                                                       •   Risk management through application of COSO(2)
        •     In sourced operations (e.g. in house dredging and marine                                       principles
              operations) leading to efficiency and cost reduction.                                      •   Independent board
        •     Out performed market by providing best in class                                            •   Disclosures as per CDP, TCFD and SBTi.
              efficiency - TAT of Mundra is better by 3x that of its
              peers (1)                                                                                  •   Achieving COP21 targets by 2025

                          Double digit CAGR in cargo volume in last ten years and 36% CAGR of non Mundra ports in last seven years

(1) Average Turnaround Time (TAT) for Mundra is 0.46 days in FY21 vs 1.95 days for Major Ports in FY19
                                                                                                                                                                    6
(2) COSO – Committee of sponsoring organizations
Adani Ports and SEZ Limited - June, 2021
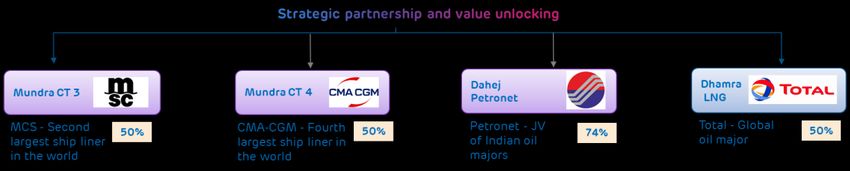
APSEZ : A transport utility with string of ports and integrated logistics network

                                                                                                                                     West Coast                                                      East Coast
                                                                                                                                  Capacity 335 MMT                                                Capacity 227* MMT

                                                                                                                                            Dahej
                                                                                                                                            14
                                                                                                                                            MMT

                                                                                                                                            Tuna
                                                                                                                                            14
                                                                                                                                            MMT

                                                                                                                                            Mundra
                                                                                                                                            264 MMT

                                                                                                                                                                                                                     Dhamra
                                                                                                                                                           Hazira
                                                                                                                                                                                                         Vizag
                                                                                                                                                                                                                     45 MMT
                                                                                                                                           Mundra -        30 MMT
                                                                                                                                                                                                         6 MMT
                                                                                                                                        India’s Largest
                                                                                                                                          Commercial        Dighi                                           Gangavaram^   Container Terminals
                                                                                                                                            Port by         8 MMT                                           64 MMT        Bulk Terminals
                                                                                                                                                                                                   Krishnapatnam
                                                                                                                                            Volume                                                                        Multipurpose Ports
                                                                                                                                                                                                   64 MMT
                                                                                                                                                               Mormugao
                                                                                                                                                                                                  Kattupalli
                                                                                                                                                               5 MMT
                                                                                                                                                                                                  18 MMT
                                                                                                                                                               Vizhinjam                Ennore
                                                                                                                                                                                        12 MMT
                                                                                                                                                               18 MMT

             An integrated approach through Ports, SEZ and                                                                  Grown from a single port to Twelve Ports ~560 MMT of
              Logistics enables presence across value chain                                                                    augmented capacity to handle all types of cargo.

Includes both SEZ and non SEZ land| Gangavaram Port on the east coast having a capacity of 64 MMT has not been included and Vizhinjam considered on east coast as its primary hinterland would be there |
GPWIS – General Purpose Wagon Investment Scheme | CTO – Container Train Operator | IWW –Inland Water Ways | AFS – Air Freight Stations | ^ Gangavaram Port is under acquisition                                                                 7
Adani Ports and SEZ Limited - June, 2021
APSEZ : Our Strategy led to dominant market leadership

                                      Cargo Diversification

                                                                                    FY02               FY11              FY21

                                                                                      Coal   Containers (mmt)   Crude   Others

                                                APSEZ’s pillars
                                                 of strategy                       Strategic Partnerships

Integrated logistics

                        FY02              FY11               FY21                 East Coast West Coast parity

                       West   East       West    East       West   East

                                     Ensured resilience and stickiness of cargo                                                  8
Adani Ports and SEZ Limited - June, 2021
Growth journey in past two decades

                                     9
APSEZ : Consistent outperformance leading to gain in market share

                            Total cargo (MMT)
                                                             247                     • Geographical diversification and parity in coasts led to
                                                                                       reduction in concentration risk and higher growth.
                                                                     All India
                                                                    CAGR – 5%
                                                                                     • Cargo diversification led to de-risking of cargo portfolio
                                                             1246
                                                                                       from commodity volatility and ensure resilience in
 3                                                                                     growth.
                                                                      APSEZ
394                                                                 CAGR – 25%       • Container segment growing faster than other cargo
                                                                                       segment.
                                                                                     • We have also diversified to new age cargos like LNG and
                           All India   APSEZ
                                                                                       LPG adding to our cargo basket.

                                                             106
                            Container (MMT)                                                0%                                                     41%
                                                                                                                      12%

                                                                                          FY02                 FY11                  FY21
        4                                                    257

                                                                         All India
                                                                        CAGR – 10%
                                                                                                            APSEZ   All India

            Container - All India        Container - APSEZ                APSEZ
                                                                        CAGR – 25%

                                                                                                                                                        10
APSEZ : Revenue and EBIDTA growth reflect robust cargo growth                                                                          (In INR Bn)

                            Revenue                                                                            EBITDA and EBITDA Margin

          CAGR – 41%                                                                        CAGR – 41%
                                                                 126   9,000                                                                                80%
                                                                                                                                                      81
                                                                       8,000                                                                                 70%
                                                                                    69%
                                                                         7,000                                                                             64%
                                                                                                                                                             60%
                                                                       6,000
                                                                                                                                                            50%
                                                                         5,000
                                                                                                                                                            40%
                                                                       4,000
                                                                                                                                                            30%
                                                                         3,000
                                                                                                                                                            20%
                                                                         2,000

                                                                         1,000                                                                              10%
                                                                                 0.13
    0.2                                                                     -                                                                               0%

                                                                                                         EBITDA (Rs.Cr)   EBITDA (%)

• Customer centric services, strategic partnership, geographical and cargo         • Operational parameters benchmarked to international standards that
  diversification allows to increase revenue consistently.                           allows EBITDA growth in line with revenue

• Integrated business model aids in capturing higher share of customer’s           • Focus on cost allows us to deploy resources optimally and save precious
  wallet resulting in 41% growth in revenue.                                         dollars.

• Handling higher realization products help achieve growth in revenue.             • Adoption of technology and automation of operations allowed efficiency
                                                                                     improvement and boost margins.

                                                                                                                                                                 11
FY21 Update and FY25 outlook

                               12
APSEZ : Operational and Financial Highlights of FY21

                                                                                                           Operating revenue at Rs.125 Bn                          6%
 Cargo volume of 247 MMT                                                         11%
                                                                                                           EBITDA* at Rs.80 Bn                                     7%

                                                                                                            Port revenue at Rs.107 Bn                             12%
                                                                                                            Port EBITDA* at Rs.76 Bn                              15%
 Market share in cargo volume at 25%                                              4%

                                                                                                           Port EBITDA margin at 70%                               1%

 Container volume of 7.2 mn TEUs                                                 16%
                                                                                                           PBT at Rs.63 Bn                                        48%
                                                                                                           PAT at Rs.50 Bn                                        33%

 APSEZ’s market share in container                                                                         Free cash flow^ at Rs.58 Bn                            47%
 segment at 41%                                                                   5%
                                                                                                           Net Debt to EBITDA^^                                   3.3x

• Enhanced value for shareholders through acquisition of                                             • Overhauled cost structure towards variable cost
  Krishnapatanam, Gangavaram, & Dighi ports at attractive value.
                                                                                                     • Focused capital allocation resulted in curtailing discretionary Capex,
• Improved hinterland reach and east coast west coast parity.
                                                                                                     • rigorous financial management improved working capital position, to
• Second international foray through Colombo port.                                                     increase free cash flow^ by 47% and improve liquidity.

     Strategic acquisition of ~Rs.260 Bn Krishnapatnam, Gangavaram and Dighi Ports along with SRCPL to ensure resilience
  *EBITDA excludes forex gain of Rs.715 cr. in FY21 vs. forex loss of Rs.1626 cr. in FY20 and FY21 EBITDA excludes one time donation of Rs.80 cr.                               13
  ^^EBITDA ratio calculation includes Rs.614 cr. of KPCL EBITDA earned in H1 FY21
APSEZ : Medium term outlook
         Business                                 Strategy                                  Finance

• Expanding capacity in             • Going regional to build                    • To maintain Investment
  east and southern ports             on our network strength                      grade rating.
  to capture hinterland
                                    • Focus on providing                         • Operational excellence &
  growth in the areas.
                                      single window service to                     sweating of assets to
• Working towards east                ring-fence port cargo &                      improve Port EBIDTA
  coast west coast parity             improve customer                             margin 73% by FY25
                                      stickiness
• Continue diversification                                                       • Incremental revenue &
  of cargo base with an             • Expanding logistics                          resultant EBIDTA will
  ability to handle all               business by providing                        ensure higher
  types of cargoes, thus              Integrated logistics                         conversion of free cash
  resulting in higher                 solutions to the                             flows of 85% by FY25
  capacity utilization and            customers – Port to door
                                                                                 • Future ROCE to be in
  improving market share              and door to Port.
                                                                                   excess of 20%+ by FY25

                    To be among the top 10 Port Operators in the world in next five years
                                                                                                              14
APSEZ : FY25                                                                                               (In INR Bn)

  Cargo Volume (MMT)                  Revenue                            EBITDA
                                                274                               187
                 500
          2x                          2.2x                               2.3x

  247                           126                               81

                                                                                               • Our business will grow as a
                                                                                                 transport utility in next five years
  FY21          FY25           FY21             FY25             FY21             FY25
                                                                                               • This period to witness Multiple
                                                                                                 times growth
         PAT                           FCF                                ROCE
                                                                                               • Our focus on free cash generation
                 122                            159
                                                                                  20%            and return to stakeholders to
         2.4x                          2.7x                               1.7x                   amplify in line with our operational
                                                                                                 performance
                                                                  12%
  50
                                58

  FY21          FY25           FY21             FY25              FY21            FY25

                       To be among the top 10 Port Operators in the world in next five years
                                                                                                                                        15
Opportunity embedded in Integrated Logistics

                                    16
APSEZ : Ample headroom for growth in expanding Infrastructure footprint

                             Rail - Container                                                                  Grain Logistics - AALL
            0.3               • 4.1 Mn TEU - Market Size                                    1.28               • 10.5 MMT - Market Size
           Mn Teu             • 0.3 MnTEU - ALL Market Share                                   MMT             • 1.28 MMT - ALL Market Share
                                (8%)                                                                             (12%)                         • Market Expected to grow at
                                                                                                                                                 healthy 12% growth

                                                                                                              Bulk Rail Logistics              • Government focus on
                            Multi Modal Logistics Park                                                                                           logistics sector and policy
           0.3              • 4.1 Mn TEU - Market Size                                       2.7              • 1,020 MMT - Market Size          formulation to further bring
                                                                                              MMT             • 2.7 MMT - ALL Market Share       efficiencies and opportunities
           Mn Teu           • 0.3 Mn TEU - ALL Market Share
                              (8%)                                                                              (negligible)
                                                                                                                                               • Infrastructure push to further
                                                                                                                                                 propel the growth prospects

                             Warehousing                                                                      Inland Water Ways
                                                                                                                                               • Vast scope of growth through
           0.4               • 140 Mn sft- Market Size                                      New
                                                                                          Business            • 0.15 Mn TEU - Market Size
                                                                                                                                                 consolidation of regional and
                                                                                                                                                 small-scale players
            Mn sft           • 0.4 Mn sft - ALL Market Share
                                                                                                              • New Business for ALL
                               (negligible)

                                           India’s Logistics Market is very fragmented, thus providing opportunity for consolidation
                                                                                                                                                                                  17
ALL – Adani Logistics Limited | AALL – Adani Agri Logistics Limited | TEU- Twenty Foot Equivalent Unit| E-2-E : End to End
APSEZ : Integrated logistics to provide growth impetus & bring customers to ports gate

                                                                                                     Grain                              Rail
                                 Trains                                MMLPs                                          Ware-housing
                                                                                                     Silos                             Tracks
          Assets

                                 60                                       5                          0.87               0.4 mn         620*
     FY21                       Trains                                   MMLP                         MMT                 Sq. ft.       KMs

                                     3X                                    3X                          3X                   75X        1.2X

                           200+Trains                                 15 MMLP                     2.5+ MMT            30 mn Sq. ft.    760+
    FY26                    (Largest Private                        (Covering all key           (market leader with     (15% of mkt
                                                                                                                                        KMs
                                Player)                                 market)                  40% of Capacity)        capacity )

                                Logistics business to emerge as key value driver, to grow multi-fold with more than 50% CAGR by FY26

MMLP – Multi Modal Logistics Park |MMT – Million Metric Tonne, IFT – Inland Freight Terminals                                                   18
Capital Management and ESG

                             19
APSEZ : Disciplined capital management policy

     Consistent investment                  Shift towards long term                 FX risk management-
     grade rating                           financing and profile                   Natural Hedge

 •   Since FY16, capped at                                                      •    Natural hedge flows as carrying
                                        •   94% of debt is long term
     sovereign.                                                                      ~60% of EBIDTA in USD terms.
                                            (compared to 74% in FY16).
 •   Earnings growth and free cash                                              •    Debt mix - FX 70% and INR 30%
                                        •   Elongating maturity profile of
     flow generation to fortify                                                      enabling lower interest cost (current
                                            more than 6 years.
     coverages.                                                                      cost of 6.5%).

     Reduce Cost of Capital                 Robust capital allocation policy        Optimized Credit Structure

                                        •   Economic value add enshrined into   •   Desired level : to maintain Net
 •   Progressive reduction in cost of
                                            all capital deployment.                 Debt/EBITDA 3.0x - 3.5x. Currently
     debt.
                                        •   Pre-tax project IRR of >16%.            at 3.3x.
 •   Timely and quality disclosure
     and active guidance policy to      •   Rationalization of assets for       •   Shareholder’s return policy targeting
     increase predictability.               improving ROCE. (Targeted to be         20% to 25% of earnings.
                                            20% by FY25)

                                                                                                                             20
APSEZ: Robust ESG framework driven by policies backed by assurance

                                                                                                                         Environmental Policy
                                                                              Environment                                Energy and Emission Policy
                                                                                                                         Water Stewardship Policy
              Focus Areas
                                                                                                                         Occupational Health and Safety Policy
                                                                                                                         Stakeholder Engagement policy
        Occupational Health &

                                                             Policies
                                                                                    Social                               Corporate Social responsibility policy
         Safety
                                                                                                                         Group Human Rights Policy
        Biodiversity conservation
                                                                                                                         Guidelines on Human Rights, Code of Conduct,
        Climate Change
                                                                                                                          Employment of Differently Abled Person
        Pollution control
        Resource conservation                                                                                           Code of Conduct
        GHG emission reduction                                                                                          Board Diversity Policy
        Education                                                                                                       Related Party Transaction for Sale of Assets
                                                                               Governance
        Sustainable livelihood                                                                                          Dividend Distribution and Shareholders Return
        Corporate Governance                                                                                            Cyber Security Policy
        Sustainable Supply                                                                                              Whistle Blower Policy
         Chain
                                                                                               United Nations Global                  Sustainable
        Customer centricity                                                                                                                                  GRI Standards
                                                                                                     Compact                       Development Goals
                                                            APSEZ Guiding
                                                              principle                                   TCFD                              SBTi              CDP disclosure

                                   First ever Port Company to be a signatory to TCFD and Sty. To be carbon neutral by 2025.

IUCN -International Union for Conservation of Nature| SBTI – Science Based Targets Initiatives | TCFD – Task Force on Climate-related Financial Disclosures                    21
APSEZ: ESG score comparison with global peers
               Bloomberg ESG Disclosure Score                                              MSCI Rating                                      Independent Directors %
                                                                                 Maersk                      ICT, SIPGL, Concor      60                                   60
          48                                             49                                                                                               56
                    42                                                                                                                                            50
                             38                                                                                                             43
                                       34                                                                                                          36
                                                22
                                                                           AAA AA          A      BBB   BB    B    CCC

                                                                                                                  APSEZ

                                                                              Sustainalytics ESG Risk Rating                                       Free Float %
                     Member of # Indices
                                                                                                        38                                                  72
         109                                            99
                                               98                                                                 28                          51
                   82        76       79                                                                                  23                                       40      39
                                                                                                  20                                   34
                                                                            14        17
                                                                                                                                                     12

   • Bloomberg ESG score at par with peers                            • Scope for improvement in MSCI ESG rating                  • High percentage of independent directors
   • Present in highest number of indices                             • Low ESG Risk rating by Sustainalytics                     • Free float continues to be adequate

                                   First ever Port Company to be a signatory to TCFD and SBTi. To be carbon neutral by 2025
                                                                                                                                                                                22
TCFD: Taskforce on Climate Related Financial Disclosure, SBTi: Science Based Targets Initiative
APSEZ: ESG Targets - Environment

                           Carbon neutral by 2025 | Zero waste to landfill by 2025 | Single use plastic free by 2025
                           Mangrove afforestation 4000 Ha | Terrestrial Plantation in 1200 Ha by 2025

                                                                                          FY21                   FY25

                                     Renewable energy installation                        20 MW                100 MW
Environmental Parameters

                                      Energy intensity reduction                           30%                   50%

                                     Emission intensity reduction                          35%                   60%

                                                                                                         12 Ports + 4 ICDs + 14
                                      Single use plastic free sites                       9 Ports
                                                                                                                AL sites

                                  Zero waste to landfill certified ports                  3 Ports              12 Ports

                                        Mangrove afforestation                           2989 Ha               4000 Ha

                                         Terrestrial plantation                          965 Ha                1200 Ha

                                                                                                                                  23
APSEZ: ESG Targets - Social & Governance

                                                                                            FY21                 FY25

                                    Employee Satisfaction
Social Parameters

                                                                                            4.1/5                4.5/5

                                    Supplier Satisfaction                                   3.9/5                4.75/5

                                    Customer Satisfaction                                   4.2/5                4.75/5

                                             Safety                                  6 Fatalities + 17 LTI   Zero Fatalities

                    •   All CXO level salaries are linked to safety
Governance

                    •   Audit committee, nomination and remuneration committee to consist of only independent directors by FY22
                    •   No over boarding of directors
                    •   Gender diversity
                    •   Establishment of global code and policy committee Sep 2021
                    •   Establishment of disclosure committee Sep 2021

                                                                                                                                  24
APSEZ : Recent news flow on ESG front

 DJSI committee decided to remove APSEZ from its sustainability index on account of two key issues
 •   APSEZ’s holding in Bowen Rail and its perceived link to Carmichael Coal mines.
 •   APSEZ’s Investment in Myanmar Project - Sanction by US and European authorities to the institutions link to the Myanmar Army, post a
     military coup
 In our view DJSI took a hasty decision without proper due diligence.

Myanmar Project Status:
•    APSEZ, in May 2019 announced its intent to set up a container terminal at Yangon, Myanmar and entered through a lease agreement with the
     democratically elected government.
•    Total investment as of date - USD 127 mn (including USD 90 mn for the upfront payment for land lease)
•    United States had recently imposed sanctions on MEC. APSEZ has a zero-tolerance policy on sanctions and will ensure that there is no
     contravention of the US and other sanctions.
•    APSEZ appointed US-based counsels “Morrison Foerster” to approach the OFAC.
•    In a scenario wherein Myanmar is classified as a sanctioned country under the OFAC, or if OFAC opines that the project violate the current
     sanctions APSEZ will not hesitate to abandon the project and write down the investments. The write-down will not materially impact APSEZ, as
     it is equivalent to about 1.3% of the total assets.
Bowen Rail Status:
In case of Bowen rail, Board of APSEZ had decided to divest the holding in September 2020 to promoters and process for transfer of the asset is
completed in March 2021 only approval is pending with relevant authorities to clear the same.
This was communicated to S&P the rating agency, DJSI’s sister concern and reported in its report released in Feb/March detailing the actions of
APSEZ which was left by oversight by DJSI.

                                                                                                                                                    25
APSEZ : Significant potential to unlocking value

                  Ports                                       Logistics                                    SEZ / Land
             (Value Creator)                              (Value Multiplier)                             (Value Enabler)

–   Next     gen   ports   viz.  Dhamra,      –   Unique & diversified business model of    –   Bringing customer to the port gate to
    Gangavaram,       Krishnapatnam,  &           providing integrated logistics services       enhance stickiness of cargo
    Vizhinjam to add more than current            to the customer                           –   Enables future growth & bring
    value of Mundra                           –   Higher wallet share in the customer’s         synergies to existing line of business
–   Continued double digit growth with            supply chain                              –   Perpetual stream of annuity income at
    International footprint to further        –   Estimated EBITDA growth of over 50%           near 100% margins
    enhance value                                 over next 5 years                         –   Potential to add new stream of income
–   Increasing average concession life of     –   Bringing the stability and perpetual          to existing line of business
    over 25 years                                 stream of business

    • Largest transport utility covering entire supply chain with 25% market share and 90% of hinterland coverage in India.
    • Diversification of cargo mix, east coasts west coast parity and de-risks our portfolio from concentration and volatility.
    • Future ready by adopting automation and cutting edge technology for a sustainable and environment friendly growth.
    • Disciplined capital management ensures credit quality while balancing funding for growth and returns to stakeholders.
    • Governance framework backed by a formal assurance program to further strengthen our value proposition.

                    ~33%                     ~17%                         ~18%                   20%+
                    All India Market Share   Revenue CAGR                 EBITDA CAGR            ROCE

       Resilient business model, clear growth visibility and strong ESG focus places APSEZ well, to capture prolific value
                                                                                                                                         26
Thank you

            27
Annexure

           28
APSEZ : Outlook FY22

                In the range of 310 MMT - 320 MMT (includes 10 MMT of Gangavaram port from Q4 FY22) a growth of 29%

                Consolidated revenue expected to be around Rs.160 Bn. – Rs.168 Bn., a growth 34%
                Port revenue to be around Rs.130 Bn. – Rs.140 Bn., a growth of 30%
                Logistics revenue to be around Rs.14 Bn. – Rs.15 Bn., growth of 57%
                SEZ and Port led development revenue to be around Rs.6 Bn.

                Consolidated EBITDA expected to be around Rs.102 Bn. – Rs.107 Bn, a growth of 33%
                Port EBITDA margin to be around 71% - 71.5%., an improvement of 150 bps.

                Capex to be around Rs.31 Bn. – Rs.35 Bn. (Port Rs.23 Bn. – Rs.25 Bn., Logistics Rs.8 Bn. – Rs.10 Bn. and
                 incl. maintenance Capex of around Rs.5 Bn.)

                Free cash from operations (after adjusting for working capital changes, Capex and net interest cost) to
                 be around ~Rs.55 Bn. – Rs.60 Bn.

                Board has proposed 20% of PAT as dividend in line with dividend distribution and shareholders return policy
                Expected to be in our target range of 3 times – 3.5 times.

                                                                                                                               29
APSEZ : Debt profile – FY21                                                                                                                                 (YoY - Rs. in cr.)

         Gross Debt, Net Debt & Average Maturity                                                                 Gross Debt Movement

40,000                                                                                             6.2
                                                                   34,401   6                                               5,447
35,000                                                                                                                                        776           267            34,401
                                                                                                   6
                     29,463                                                 28,472
30,000
                                                                                                   5.8       29,463
25,000                           22,137
                                                                                                   5.6
20,000
                                                                                                   5.4
15,000
                         5                                                                         5.2
10,000
 5,000                                                                                             5

    0                                                                                              4.8
                        Mar'2020                                      Mar'2021                                FY20    Additional FX debt   Forex MTM   Net Debt Repaid      FY21
                                                                                                                         of $750 mn
                    Gross Debt            Net Debt          Average Maturity (years)

         Maturity profile of Long Term Debt                                                              •    Gross Debt increased on account of new issuance of USD
                                                                                            60%
                                                                                                              bond of 750 mn (coupon of 4.2% and 7 year bullet maturity)
                                                                                     47%
                                                                                                              for KPCL acquisition and Rupee bonds for Capex program.
                                                                                                         •    Average maturity of debt improved from 5.2 years to ~6
                                                                                                              years on account of refinancing of USD 500 mn bond
                                 24%
                                          26%
                                                            22%
                                                                                                              (coupon of 3.1% and 10 year bullet maturity) of one year
                                                                                                              ahead of time.
         6%
                                                                    10%
                                                                                                         •    Average cost of borrowing has decreased from 6.9% to
               4%
                                                                                                              6.7% due to new issuances and refinancing with lower
           5 years
                                                                                                              coupons.
                                               Mar '20   Mar '21
                                                                                                                                                                                    30
APSEZ : Strong operational performance improves FCF* in FY21                                                                                                                              (YoY - Rs. in cr.)

                       Cash Flow Conversion                                                                                            Free Cash Flow Movement
                                                                                                                         7000

   9000                                                                                                             80%                                                                   1668             36
                                                                                      72%                             6000
   8000                                                                                                             70%
                                                                              8063                                     5000                             760              606
   7000                    7565       52%                                                                           60%
   6000
                                                                                                                    50%4000
   5000                                                                                      5800
                                                                                                                    40%3000
   4000                                                                                                                                                                                                               5800
                                           3942                                                                     30%
   3000                                                                                                                2000           3942
   2000                                                                                                             20%

    1000                                                                                                            10%1000
        0                                                                                                           0%       0
                                  FY20                                                FY21                                            FY20          Increase in     Change in WC      Decrease in      Net Interest   FY21
                                                                                                                                                     Op. Profit                         Capex             Cost
                                EBITDA            Free Cash Flow*             FCF to EBITDA (%)

                                 Net debt to EBITDA^

                4.4x
                                                                                                                                        •     Increase in free cash flow was on account of
                                                                                                                                              increase in operating profit, working capital
                                   3.4x                                                                          3.3x                         improvement and reduction in Capex.
                                                                          2.9x
                                                       2.5x
                                                                                                                                        •     FCF conversion was higher due to free cash
                                                                                              2.9x
                                                                                                                                              generation and lower denominator
                                                                                                                                        •     Net debt to EBITDA* is with in the guided range at
                                                                                                                                              3.3x. The increase is on account of use of cash for
               FY 16               FY 17              FY 18              FY 19               FY 20              FY21                          latest acquisitions.
                                                              Net Debt /EBIDTA

                                                                                                                                                                                                                             31
Note –*FCF – Free cash flow after adjusting for changes in working capital and investing activities | ^ EBITDA used in computing the ratio includes Rs.614 cr. which is EBITDA earned by KPCL in H1 FY21
APSEZ : Key ratios of FY21
                        Rating Ratios                                                                                                        ROCE^ and ROE
           30%                              27.6%                                     5.1x                              5.2x
                                                                                               25.4%                    5.1x                                                                             17%
           25%                      22.7%                                            22.3%                              5.1x                                 15%
           20%                                                                                                          5.0x
                                                                                                                                                    13%
                                                                                                                        5.0x                                                                    12%
            15%                                                                                                         4.9x
                                         4.8x                                                                           4.9x
            10%                                                                                                         4.8x
             5%                                                                                                         4.8x
                                                                                                                        4.7x
             0%                                                                                                         4.7x
                                        FY 20                                               FY21
                       FFO / Gross Debt (18% - 25%)                              FFO / Net Debt (13% to 15%)                                           FY 20                  ROCE        ROE     FY21
                       FFO Interest coverage (3x – 4.5x)

              FX Revenue and Debt Maturity#, Coverage
            (In USD mn)                                                                                                  •     All key rating ratios continue to be in the prescribed range.
        3500
                                     2.9x                                          2.8x
                                                                                                                 350%
                                                                                                                         •     ROE improvement is on account of increase in PAT by 33%.
        3000                                                                            3,237                    300%
                                                                                                                         •     Dollar denominated debt has increased to ~USD 3.2 bn. due to
        2500                                                                                                     250%
                                         2,652
                                                                                                                               new USD bond issuance of USD 750 mn. for acquisition of KPCL.
        2000                                                                                                     200%
        1500                                                                                                     150%    •     Total Revenue includes US$ 474 mn of earnings in FX currency
        1000                                                                                                     100%          an increase of 10% over FY20. The growth is on account of
                                430                                            474                                             higher share of FX earning cargo and addition of KPCL.
         500                                                                                                     50%
                                      16%                                            15%
            0                                                                                                    0%
                                     FY20                                          FY21

                  FX Revenue          Total FX Debt        FX Rev/Total FX Debt             FX Maturity Coverage
                                                                                                                                                                                                               32
* EBITDA excludes forex gain/loss   #Payouts of Annual Debt maturity are net of refinance     ^ EBIT Calculation for ROCE includes Rs.614 cr. which is EBITDA earned by KPCL in H1 FY21
Disclaimer

Certain statements made in this presentation may not be based on historical information or facts and may be “forward-looking statements,” including
those relating to general business plans and strategy of Adani Ports and Special Economic Zone Limited (“APSEZL”),the future outlook and growth
prospects, and future developments of the business and the competitive and regulatory environment, and statements which contain words or phrases
such as ‘will’, ‘expected to’, etc., or similar expressions or variations of such expressions. Actual results may differ materially from these forward-looking
statements due to a number of factors, including future changes or developments in their business, their competitive environment, their ability to
implement their strategies and initiatives and respond to technological changes and political, economic, regulatory and social conditions in India. This
presentation does not constitute a prospectus, offering circular or offering memorandum or an offer, or a solicitation of any offer, to purchase or sell, any
shares and should not be considered as a recommendation that any investor should subscribe for or purchase any of APSEZL’s shares. Neither this
presentation nor any other documentation or information (or any part thereof) delivered or supplied under or in relation to the shares shall be deemed to
constitute an offer of or an invitation by or on behalf of APSEZL.
APSEZL, as such, makes no representation or warranty, express or implied, as to, and does not accept any responsibility or liability with respect to, the fairness,
accuracy, completeness or correctness of any information or opinions contained herein. The information contained in this presentation, unless
otherwise specified is only current as of the date of this presentation. APSEZL assumes no responsibility to publicly amend, modify or revise any forward-
looking statements, on the basis of any subsequent development, information or events, or otherwise. Unless otherwise stated in this document, the
information contained herein is based on management information and estimates. The information contained herein is subject to change without
notice and past performance is not indicative of future results. APSEZL may alter, modify or otherwise change in any manner the content of this
presentation, without obligation to notify any person of such revision or changes.
No person is authorised to give any information or to make any representation not contained in and not consistent with this presentation and, if given
or made, such information or representation must not be relied upon as having been authorised by or on behalf of APSEZL.
This presentation does not constitute an offer or invitation to purchase or subscribe for any securities in any jurisdiction, including the United States.
No part of its should form the basis of or be relied upon in connection with any investment decision or any contract or commitment to purchase or
subscribe for any securities. None of our securities may be offered or sold in the United States, without registration under the U.S. Securities Act of 1933,
as amended, or pursuant to an exemption from registration therefrom.

Investor  RelationsTeam:
 Investor Relations Team : -
MR. D. BALASUBRAMANYAM                        MR. SATYA PRAKASH MISHRA                           MR. ATHARV ATRE
Group Head - Investor Relations               Senior Manager - Investor Relations                Assistant Manager - Investor Relations
  d.balasubramanyam@adani.com                    satyaprakash.mishra@adani.com                      atharv.atre@adani.com
  +91 79 2555 9332                               +91 79 2555 6016                                   +91 79 2555 7730

                                                                                                                                                                      81
You can also read