Grocery Outlet Business Overview - March 2021 - Investor Relations ...

Page created by Suzanne Ryan
 
CONTINUE READING
Grocery Outlet Business Overview - March 2021 - Investor Relations ...
Grocery Outlet Business Overview
    March 2021

1
Grocery Outlet Business Overview - March 2021 - Investor Relations ...
Disclaimer
  Forward-Looking Statements
  This presentation contains forward-looking statements within the meaning of the Private Securities Litigation Reform Act of 1995 as contained in Section 27A of the Securities Act of 1933, as amended, and
  Section 21E of the Securities Exchange Act of 1934, as amended, which reflect management's current views and estimates regarding the prospects of the industry and the Company’s prospects, plans, business,
  results of operations, financial position, future financial performance and business strategy. These forward-looking statements generally can be identified by the use of forward-looking terminology such as
  "may," "should," "expect," "intend," "will," "estimate," "anticipate," "believe," "predict," "potential" or "continue" or the negatives of these terms or variations of them or similar terminology. Although the
  Company believes that the expectations reflected in these forward-looking statements are reasonable, the Company cannot provide any assurance that these expectations will prove to be correct.
  The following factors are among those that may cause actual results to differ materially from the forward-looking statements: failure of suppliers to consistently supply us with opportunistic products at attractive
  pricing; inability to successfully identify trends and maintain a consistent level of opportunistic products; failure to maintain or increase comparable store sales; changes affecting the market prices of the products
  we sell; failure to open, relocate or remodel stores on schedule; risks associated with newly opened stores; inability to retain the loyalty of our customers; costs and implementation difficulties associated with
  marketing, advertising and promotions; failure to maintain our reputation and the value of our brand, including protecting our intellectual property; any significant disruption to our distribution network, the
  operations of our distributions centers and our timely receipt of inventory; inability to maintain sufficient levels of cash flow from our operations; risks associated with leasing substantial amounts of space; failure
  to participate effectively or at all in the growing online retail marketplace; unexpected costs and negative effects if we incur losses not covered by our insurance program; inability to attract, train and retain highly
  qualified employees; difficulties associated with labor relations; loss of our key personnel or inability to hire additional qualified personnel; risks associated with economic conditions; competition in the retail
  food industry; movement of consumer trends toward private labels and away from name-brand products; major health epidemics, such as the outbreak of COVID-19, and other outbreaks; natural disasters and
  unusual weather conditions (whether or not caused by climate change), power outages, pandemic outbreaks, terrorist acts, global political events and other serious catastrophic events; failure to maintain the
  security of information we hold relating to personal information or payment card data of our customers, employees and suppliers; material disruption to our information technology systems; risks associated with
  products we and our independent operators ("IOs") sell; risks associated with laws and regulations generally applicable to retailers; legal proceedings from customers, suppliers, employees, governments or
  competitors; failure of our IOs to successfully manage their business; failure of our IOs to repay notes outstanding to us; inability to attract and retain qualified IOs; inability of our IOs to avoid excess inventory
  shrink; any loss or changeover of an IO; legal proceedings initiated against our IOs; legal challenges to the IO/independent contractor business model; failure to maintain positive relationships with our IOs; risks
  associated with actions our IOs could take that could harm our business; our substantial indebtedness could affect our ability to operate our business, react to changes in the economy or industry or pay our debts
  and meet our obligations; our ability to generate cash flow to service our substantial debt obligations; impairment of goodwill and other intangible assets; any significant decline in our operating profit and
  taxable income; risks associated with tax matters; changes in accounting standards and subjective assumptions, estimates and judgments by management related to complex accounting matters; failure to
  comply with requirements to design, implement and maintain effective internal controls; and the other factors discussed under "Risk Factors" in the Company’s most recent reports on Forms 10-Q and 10-K. Such
  risk factors may be updated from time to time in the Company’s periodic filings with the SEC. The Company’s periodic filings are accessible on the SEC’s website at www.sec.gov.
  You should not rely upon forward-looking statements as predictions of future events. Although the Company believes that the expectations reflected in the forward-looking statements are reasonable, the
  Company cannot guarantee that the future results, levels of activity, performance and events and circumstances reflected in the forward-looking statements will be achieved or occur. Except as required by
  applicable law, the Company undertakes no obligation to update publicly any forward-looking statements for any reason after the date of this news release to conform these statements to actual results or to
  changes in our expectations.
  Industry Information
  Market data and industry information used throughout this presentation are based on management’s knowledge of the industry and the good faith estimates of management. We also relied, to the extent
  available, upon management’s review of independent industry surveys and publications and other publicly available information prepared by a number of third-party sources. All of the market data and
  industry information used in this presentation involves a number of assumptions and limitations, and you are cautioned not to give undue weight to such estimates. Although we believe that these sources
  are reliable, we cannot guarantee the accuracy or completeness of this information, and we have not independently verified this information. While we believe the estimated market position, market
  opportunity and market size information included in this presentation are generally reliable, such information, which is derived in part from management’s estimates and beliefs, is inherently uncertain and
  imprecise. Projections, assumptions and estimates of our future performance and the future performance of the industry in which we operate are necessarily subject to a high degree of uncertainty and risk
  due to a variety of factors, including those described above. These and other factors could cause results to differ materially from those expressed in our estimates and beliefs and in the estimates prepared by
  independent parties.
  Non-GAAP Financial Measures
  We present Adjusted EBITDA and Adjusted EBITDA margin to help us describe our operating performance. Our presentation of Adjusted EBITDA and Adjusted EBITDA margin is intended as a supplemental
  measure of our performance that is not required by, or presented in accordance with, U.S. generally accepted accounting principles (“GAAP”). Adjusted EBITDA and Adjusted EBITDA margin should not be
  considered as an alternative to operating income (loss), net income (loss), earnings per share or any other performance measures derived in accordance with U.S. GAAP as measures of operating
  performance or operating cashflows or as measures of liquidity. Our presentation of Adjusted EBITDA and Adjusted EBITDA margin should not be construed to imply that our future results will be
  unaffected by these items. See the supplemental materials to this presentation for a reconciliation of Adjusted EBITDA and Adjusted EBITDA margin to net income (loss).

2 Data in this presentation are generally as of, or for the 2020 fiscal year ended January 2, 2021, unless otherwise noted.
Grocery Outlet Business Overview - March 2021 - Investor Relations ...
COMPANY OVERVIEW
Grocery Outlet Business Overview - March 2021 - Investor Relations ...
Our Positioning & COVID-19 Response

                                                                          …And We have Acted Decisively to Support
        Our Business Model is Well Positioned…
                                                                                Customers, IOs and Partners

        IOs manage labor payment at the store-level and comply with         Enacted comprehensive safety measures in observance of
           the mandates of their local government                                     CDC & public health guidelines

         We provide our customers with extreme value at a time              Worked closely with supplier partners to keep pace with
             when they are seeking to maximize savings                    demand, purchasing opportunistic & everyday products

         We offer an assortment of familiar & trusted high-quality,        Supported IOs by providing financial support and
          name-brand consumables along with fresh products                guidance through a COVID call center, Clean, Safe Store
                                                                            initiative, and updates on local operating requirements

          We have a flexible supply chain, logistics network and               Focused customer communications on local product
             merchandising to respond to demand spikes                     availability, safety precautions and community outreach

             We serve as pillars of our local communities with
                          personalized service                           Maintained a strong liquidity position with $105mm of cash
                                                                            and over $90mm available on our revolving credit facility

        We Are Proud of Our IOs & Their Employees, Who Have Stepped Up in These Extraordinary Times

4
Grocery Outlet Business Overview - March 2021 - Investor Relations ...
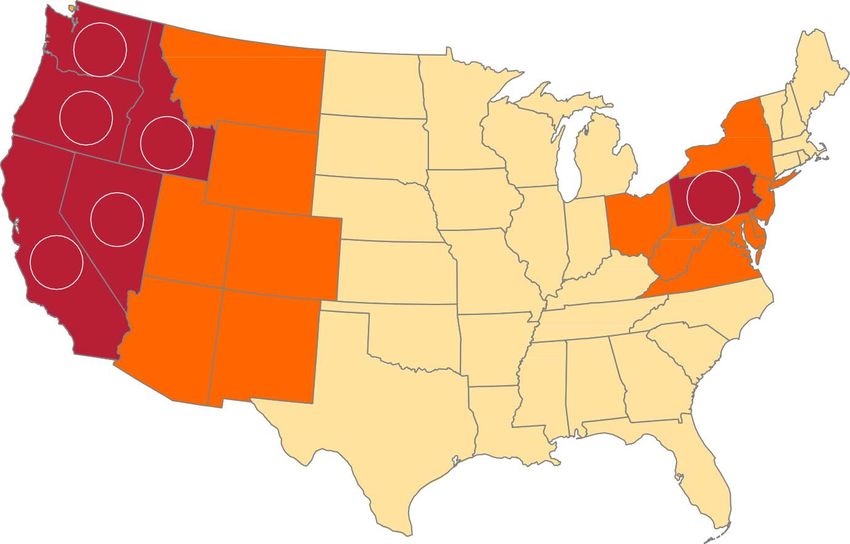
Grocery Outlet Is a Differentiated, High-Growth, Off-Price Retailer

                  Differentiated Model                  Attractive Store Base           Strong Financial Performance

                  40% - 70%                    56
                                                   67

                                                         8
                                                                                                $3.1bn
      Prices Below Conventional Retailers           9
                                                                                  19                FY 2020
               On Our BestDeals              221
                                                                                                    Net Sales

                              ~50%                                                            $223mm
                         Opportunistically                                                          FY 2020
                         Sourced Products     380 Stores Across 6          States (1)           Adjusted EBITDA

                              5,000                              10%                                  17
            Ever-Changing SKUs Per Store                     Store Count CAGR             Consecutive Years of Positive
          Promote Treasure HuntExperience                    FY 2015 to FY 2020         Comparable Store Sales Growth (3)

                               340+                            1,900                               5.6%
               Independent Operators               In-Market and Neighboring            Average Comparable Store Sales
          Create Local Shopping Experience           States Potential Stores (2)         Growth Over Past 17 Years (3)

                        ~14,000                                40%+                           $105mm
                          Square Foot          Year 4 Cash-on-Cash Returns
                                                                                          Cash Balance as of FY 2020 (1)
                        Average Store Size              Historically
    (1)    As of January 2, 2021.
    (2)    Source:eSite.
    (3)    Fiscal years 2004-2020.
5
Grocery Outlet Business Overview - March 2021 - Investor Relations ...
We Have Continued to Make Significant Progress Since Our IPO

                                                                    Q4 2020 Results                                            FY 2020 Results

     Delivered Solid                        Comparable stores sales growth of 7.9%                          Comparable stores sales growth of 12.7%
        Business                                                                                             Net Sales growth of 22.5%
      Performance
                                            Net Sales grew 23.1% to $806.8mm
                                            Adjusted EBITDA grew 24.7% to $51.2mm                           Adjusted EBITDA grew 32.4% to $222.9mm

                                            Compelling value and treasure hunt experience from strong opportunisticpurchasing
    Continued Solid                         Broad-based growth with Natural, Organic, Specialty, Healthy (NOSH), fresh categories, and beer and wine as standouts
      Product, IO                           Continued growth of newly introduced fresh seafood and grass-fed meat
     Performance,
    and Marketing                           Improvements in ordering and distribution systems that enhance IO localized assortment decisions
       Execution                            GO brand refresh supported by new Bargain Bliss marketing campaign
                                            Continued growth in email subscriber database to drive engagement

            Expanded                        Opened 35 new stores (2 closures) in FY 2020
          Footprint and                     New stores are performing well and in-line with expectations
             Growth                         Began developing the East infrastructure, with new store openings planned in 2021
            Initiatives
                                            Continued to invest in talent & systems to build the infrastructure that will support future growth

                                            Reduced net leverage (3) from 5.5x pre-IPO to 1.6x FY 2020
        Improved                            Flexible credit facility with no principal payments due until 2025 and ample capacity vs. 7x leverage covenant
      Balance Sheet
                                            Cash balance of $105mm as of FY 2020-end

    (1)     Defined as (Total Debt – Cash) / FY 2020 Adj. EBITDA.

6
Grocery Outlet Business Overview - March 2021 - Investor Relations ...
The WOW! Shopping Experience

                                PRICE                              QUALITY                         SERVICE
          • Extreme value                                • Name-brand products         •   Locally owned and operated
            • ~40% average basket                        • Fresh                       •   Friendly, high-touch service
              savings (1)                                • Natural Organic Specialty   •   Active in community
            • ~40% - 70% savings on                        Healthy (NOSH)              •   Family-run stores
              best deals (1)                             • Quality guarantee           •   Easy-to-shop stores
          • Distinct and proven buying                   • Clean, well-merchandised
            model                                          stores

                                              TREASURE HUNT DISCOVERY
                                                       = FUN!
                                              • Unexpected deals

                                              • Ever-changing assortment

                                              • Curated and localized merchandise

7   (1)   Compared to conventional grocers.
Grocery Outlet Business Overview - March 2021 - Investor Relations ...
Grocery Outlet’s Model Is Well-Positioned Against
    Other Off-Price / Discount Retailers

                                                        Opportunistic   Treasure Hunt   E-Commerce as
                                                          Sourcing       Experience       a % of Sales

                                                           ✓               ✓                0%

                                                           ✓               ✓                0%

                                                           ✓               ✓
Grocery Outlet Business Overview - March 2021 - Investor Relations ...
Consistent Track Record of Earnings Growth

                   2020 was our 17th Consecutive Year of Positive Comparable Store Sales Growth
    Strong Comp     8.4%                                         12.3%       14.7%
                                                                                                                                         Average: 5.6%                                                        12.7%

    Performance                4.9%
                                                                                          2.6%
                                                                                                     5.4%        5.0%                    5.2%       4.2%       3.6%
                                                                                                                                                                           5.3%        3.9%       5.2%
                                           0.8%        0.6%                                                                 0.2%

                    2004       2005        2006       2007        2008        2009       2010        2011        2012       2013         2014       2015       2016        2017        2018       2019        2020

                   Total Stores

     Disciplined                                                   265                             293                             316                             347                              380
                                   237
    Store Growth
                                  2015                            2016                            2017                             2018                            2019                            2020

                   Gross Margin %                         Strong and Consistent Annual Gross Margins Between 30.1% and 31.1% since 2010

     Consistent                   30.2%                           30.6%                           30.4%                           30.4%                           30.8%                           31.1%

      Margins
                                   2015                            2016                            2017                            2018                           2019                            2020

                   Adjusted EBITDA (1) ($mm)

    Track Record                                                                                                                                                                                      $223
                                                                                                                                                                      $168
     of Earnings                    $107                            $121                             $135                            $152

       Growth
                                    2015                            2016                             2017                            2018                             2019                            2020
                     (1) Beginning with the fourth quarter of fiscal 2020, we updated our definitions of non-GAAP financial measures to simplify our presentation and enhance comparability between periods

9
Grocery Outlet Business Overview - March 2021 - Investor Relations ...
While Each Recession is Unique, Grocery Outlet Had Strong Comparable
     Store Sales Growth Performance in 2008-2009

                                                                                    Recessionary Conditions (2008 – 2009)
     2-year stack Comparable Store Sales Growth of selected public retailers (1)

                                                                                                                                                                                                                                  27%

                                                   (15%)                        (9%)             (6%)         (5%)             (3%)            (2%)                   3%               4%                      7%          8%   19%

     Source: Company filings, company projections, publicly available information and FactSet. n = 184
     (1)     Reflects 2008 and 2009 comparable store sales growth stack for all U.S. retailers that were public during 2008 and 2009 and have reported comparable store sales growth figures for these years on FactSet.
10
Grocery Outlet Evolution: Over 70 Years of Delivering The WOW!

     Signs first IO                      Berkshire                 Expands to             Reaches $2                Publicly-listed
     Agreement in                        Partners invests          Southern               billion in sales          Company
     Redmond, OR
                                                                                          $2bn
                                                                   California market

 Jim Read opens              Eric Lindberg            Acquires
 “Cannery Sales”             and MacGregor            Amelia’s and
                             Read become              expands to East                                                 2019
                             Co-CEOs                  Coast
                                                                                                             2018

                                                                                                2017

                                                                                   2014

                                                                        2012

                                                            2011
                                             2009                               Hellman &               Opens 300th
                                 2006                                           Friedman                store in
        1946          1973                                                      invests                 Inglewood

11
Strong Commitment To Corporate Culture

                         Grocery Outlet is driven by family values that
                          are reflected throughout the organization

             Integrity       Collaboration          Entrepreneurship      Performance

                                        Our Mission:
                         Touching Lives For The Better
12
INVESTMENT HIGHLIGHTS AND
    GROWTH STRATEGIES
Investment Highlights & Growth Strategies

                  Investment Highlights                      Growth Strategies

              POWERFUL CUSTOMER VALUE            Be the First Choice for Bargain-Minded
        I     PROPOSITION SUPPORTED BY A             Customers Across the Country
              “WOW!” EXPERIENCE

              FLEXIBLE SOURCING AND
                                                          DRIVE COMPARABLE
        II    DISTRIBUTION MODEL THAT IS
                                                         STORE SALES GROWTH
              DIFFICULT TO REPLICATE

              INDEPENDENT OPERATORS: OUR
        III   “SMALL BUSINESS AT SCALE” MODEL
                                                  EXECUTE ON STORE EXPANSION PLANS
              STRONG CONSUMER ENGAGEMENT
        IV    AND ALIGNMENT WITH MACRO
              TRENDS

              ATTRACTIVE AND CONSISTENT NEW       IMPROVE PRODUCTIVITY AND REINVEST
        V     STORE ECONOMICS SUPPORT                 IN THE VALUE PROPOSITION
              WHITESPACE

14
Our Fundamentally Different Approach To Buying and Selling

                                         Small Business at Scale
                      How We Buy                                         How We Sell
        Opportunistic sourcing of quality, name-        Independently operated, local, small-box
         brand, fresh products                            stores

        Large, centralized purchasing team                    Personalized customer service

              Long-standing, actively managed                 High community involvement
               supplier relationships                    IOs control store operations and oversee:
        Proactive sourcing of on-trend products and           Product selection
         brands
                                                               Hiring, training and managing their
        Everyday core staples to complement our                store workers
         WOW! offerings
                                                               Local marketing

                                                           “Out Chain the Locals, Out Local the Chains”

15
Flexible Sourcing and Distribution Model
     Anchored by Purchasing Team and Relationships

                                                     …Who Make Us One of
                 Long-Standing Suppliers…
                                                       Their First Calls

                                                        RELATIONSHIP

                                                     BRAND PROTECTION

               …And New Emerging Suppliers

                                                         EXECUTION

                                                           SCALE

16
Substantial Opportunity to Further Grow Opportunistic Supply

           Significant Share Gain Opportunity               Ongoing Secondary Market Growth

                                                Secondary
                                                 Market

17
Grocery Outlet’s Differentiated Sourcing
     Model Delivers Great Value To Customers

                                                  Two Primary Methods

                           Opportunistic                                   Everyday Core Staples

      Opportunistic purchases                                                       When staples, such as milk
               CPG excess
       represent                                                                      or sugar, cannot be sourced
       inventory                                                                      opportunistically, GO buys from
                                                                                      suppliers
      GO is a preferred CPG
       partner for a                                                                 Provides customer convenience
       non‐disruptive, brand-                                                         via a more complete
       protected sales channel                                                        product assortment
                                       ~50% of Purchases      ~50% of Purchases
      Allows GO to pass along                                                       Products priced at or
       significant savings to                                                         below conventional
       customers while making a                                                       supermarkets’ and discount
       healthy margin                                                                 competitors’ everyday prices

18
Favorable Value Proposition vs. Other Retailers

                                                      Basket Savings                                                                                                         Further Differentiation
           % Savings Across Store Relative to Competitors(1)
                                                                                                                                                                                                           BUT WITH NO
                                                                                                                                                         CLUB STORES                                      MEMBERSHIP FEE
                                  ~40%                                                                                                                                                                     OR BULK SIZES!

                                                                                                                                                            DEEP                                      BUT OFFERS LEADING
                                                                                                ~20%                                                    DISCOUNTERS                                   NATIONAL BRANDS!
                          Conventional
                            Grocery
                                                                                             Discount
                                                                                             Grocery
                                                                                                                                                                                                               ACROSS A
                                                                                                                                                               DOLLAR
                                                                                                                                                                                                             FULL GROCERY
                                                                                                                                                               STORES                                        ASSORTMENT!

                       AND WE PROVIDE                                                AND IN AN EASY-
                       EXTREME VALUE!                                                TO-SHOP STORE!
                                                                                                                                                                                                      BUT WITH FRIENDLY,
                                                                                                                                                               ONLINE                                HIGH-TOUCH SERVICE!

     (1)     Savings vs. Conventional/Discount derived from Grocery Outlet’s pricing research as of June 2019 based on a blended basket of items from Safeway and Walmart for 5,000+ SKUs from multiple regions.
19
Unique Independent Operator Model Fuels Success

                                       “Out Chain the Locals, Out Local the Chains”

                                                                                              Independent Operators

     Operational                               GROCERY OUTLET BENEFITS                        Operational
        Sourcing                                                                                 Merchandising
                                              Aligned economic interests
        Initial Pricing                                                                          Managing inventory
        Recruiting and                       Reduced fixed costs                                Modify pricing
         trainingIOs                                                                              Hiring and trainingstore
        Real estate
                                              Locally driven loyalty                              employees
        Distribution and                                                                         Community and
         logistics
                                                      IO BENEFITS                                  customer service

     Financial
                                               Autonomy                                      Financial
        Own inventory                         Scale benefits                                    Wages
         (consigned to IOs)                                                                       Local marketing
        Regional marketing
                                               Significant income
                                                 opportunity                                      Store operating
        Rent                                                                                      expenses
        Capex                                                                                    Operating
        Corporate SG&A                                                                            working capital
                                                                                                  Operatingassets

                              Collaboration with and amongst IOs enables real-time feedback
                                   and best-practice sharing for continual improvement
20
Compelling Store Economics For Both Grocery Outlet
     and Our Independent Operators

                                                      GO        IO                IO Model Reduces GO’s Fixed Cost Burden
                                                                      Illustrative Expense Split
             Upfront Investment

              CapEx Buildout
                                                                                                                          Fixed Costs
              Inventory / Pre-Opening
                                                                                       Fixed Costs
                                                                                                                            IO
              IO Assets / Working Capital                                                                                Commission
                                                                                                            IO model
                                                                                                             reduces
                                    Illustrative Year-4 P&L                                                 fixed cost
                                                         $6.9                                                burden
             Sales
             Gross Profit                                $2.1
                                                                                      COGS ex. Rent                      COGS ex. Rent
             Share of Gross Profit                    50%       50%

             Wages, Taxes, Benefits

             Occupancy
                                                                                   "Traditional" Model                     IO Model

                                                                                                   VariableCosts          Fixed Costs

     Note:   Dollars in millions.

21
Selective Independent Operator Recruiting And Rigorous Training

                                    Annual Leads: 20,000+

                                   First Contact: Phone Screen
                                          & Initial Review

                                      Considered: On-Site
                                      Executive Interviews

                                            Selected:
                                              70+

                     Enter 6 – 9 Month Aspiring Operator In Training Program

22
Centralized Marketing Coupled With Local IO Marketing Efforts

      Enterprise Marketing Driven By Grocery Outlet                        Local Marketing Driven By IOs
                               Digital

      Social Media           Digital Ads          WOW! Alerts      In-Store
                                                                 Localization

                                                                  Targeted
      Radio / Connected TV                 Influencer            Promotions

                                                                 Active Social
                                                                    Media
                             Traditional
                                                                  Presence
         Print                 Radio                Television

                                                                  Community
                                                                 Involvement

23
Significant Whitespace Opportunity

                             Opportunity to establish additional ~1,500 “In-Market” and neighboring state locations
                                        Long term market potential to establish ~4,800 stores nationally

                       67                                                                                             ~1,900

                     56
                                      8

                                                                                  19
                            9
             221
                                                                                                    +5x
                                                                                                  Potential

                                                                                                     380

                                                                                                     As of       In-Market and
                                                                                                  1/2/2021      Neighboring State
                                                                                                                    Potential
     Source:eSite.
24   Note: Map figures as of January 2, 2021.
Market Expansion Strategy and Success

                           Strong Presence in Southern CA           Foundation For Growth in The Mid-Atlantic
      Market entry in 2012                                      Acquired Amelia's Grocery Outlet in 2011
      86 stores in Southern CA(1)                               Goal: to accommodate supplier partners more effectively

                                                  Bakersfield

                                                                                        Harrisburg
                                                                                                       Philadelphia

                                    Los Angeles

                                             San Diego

     (1)   As of January 2, 2021.
25
Attractive and Historically Consistent New Store Economics

                                                                  Overview
      We employ a blended underwriting model reflecting average
       economics across all urbanicities, geographies and store types

      New stores require average net cash investment of ~$2mm

      4 – 5 year store ramp until maturity

      Payback period of less than 4 years

      Recent cohorts have outperformed the new store model
                                                                                                                                  Year4

                                                        Sales                                                                    ~$6,875

                                                        GO Four Wall EBITDAContribution                                           ~$680
                Model
             Assumptions                                      % Four Wall EBITDA Margin                                            ~10%

                                                        Cash-on-CashReturn                                                         ~35%

     Note: Dollars in thousands. Cash-on-cash return defined as four-wall EBITDA divided by total initial net cash investment.

26
We Are Winning Through Constant Investments To Continually
     Strengthen Our Value Proposition

               Talent                                             Technology

27
FINANCIAL PERFORMANCE AND OUTLOOK
Historical Financial Performance

                                   Strong and Disciplined                                                       Track Record of
                                      Net Sales Growth                                                      Adjusted EBITDA Growth (1)

                                                                                                                                                                                      $223
                                                                                                                                                                                                      20.0%

                                                                        $3,135
                                                                                 $200

                                                                                                                                                                     $168                             16.0%
                                                              $2,560
                                                                                                                                                   $152
                                                    $2,288                       $150
                                           $2,075                                                                                 $135
                                                                                                                                                                                                      12.0%
                                                                                                                $121
                                  $1,832
                   $1,627                                                                     $107
                                                                                 $100
                                                                                                                                                                                      7.1%            8.0%
                                                                                              6.5%              6.6%              6.5%             6.6%
                                                                                                                                                  6.7%               6.6%

                                                                                  $50
                                                                                                                                                                                                      4.0%

                                                                                   $0                                                                                                                 0.0%
                     2015         2016     2017      2018     2019       2020                 2015              2016              2017             2018              2019             2020

 Stores                  237        265     293      316      347        380
 Unit Growth              9%        12%     11%      8%      10%        10%      (1) Beginning with the fourth quarter of fiscal 2020, we updated our definitions of non-GAAP financial measures to
                                                                                 simplify our presentation and enhance comparability between periods
 Comp                  4.2%        3.6%    5.3%     3.9%     5.2%      12.7%

     Note: Dollars in millions.

29
17 Consecutive Years of Positive Comparable Store Sales Growth

                                                        14.7%
       Recessionary Economic                                                     2004 – 2020 Average: 5.6%
       Conditions                                                                                                                                               12.7%
                                                12.3%

            8.4%

                                                                        5.4%     5.0%                 5.2%                              5.3%             5.2%
                      4.9%
                                                                                                                    4.2%      3.6%               3.9%

                                                                2.6%
                                 0.8%    0.6%                                              0.2%

            2004      2005       2006    2007   2008    2009    2010    2011     2012      2013       2014       2015         2016      2017     2018    2019   2020

                                        FY 2017 – FY 2020 Quarterly Comparable Store Sales Growth
                                                                                                                                         2017 – 2020 Average: 6.8%
                                                                                                                                     17.4%     16.7%

                                                                                                                                                        9.1%
                                                                                                                                                                7.9%
                   5.9%        5.3%                              4.2%              4.2%       5.8%           5.8%
        4.9%                            5.1%    4.5%                     4.1%                                              5.1%
                                                        2.7%

        Q1'17      Q2'17       Q3'17    Q4'17   Q1'18   Q2'18   Q3'18    Q4'18     Q1'19      Q2'19          Q3'19         Q4'19     Q1'20     Q2'20    Q3'20   Q4'20

30
Q4 2020 Recent Developments

                                      Fourteen WeeksEnded    Y-o-Y                         Q4 Highlights
                                          January 2, 2021   Growth
                                                                       Opened eight new stores ending the quarter with 380
                                                                        stores in six states
                Stores                        380            9.5%
                                                                       Comp store sales increased by 7.9% over a 5.1%
                                                                        increase in the same period last year. Comp store
      Comparable Store                                                  sales increases continued to be driven by increases in
        Sales Growth                         7.9%           280 bps     average basket that were partially offset by declines in
                                                                        traffic
                                                                       Adjusted EBITDA increased 24.7% to $51.2MM.
              Net Sales                     $806.8MM        23.1%

                                                                                           2021 Outlook
             Adj. EBITDA                    $51.2MM         24.7%      Currently expects to open between 36 and 38 stores
                                                                        this year with one closure.
                                                                       As of March 2, 2021, we expect Q1 comp store sales
                                            $24.2MM         46.1%
                                                                        will decline negative HSDs reflecting the impact of
       Adj. Net Income
                                                                        cycling initial demand surge related to COVID-19
                                                                        pandemic in March 2020.

     Note:     Dollars in millions.

     (1)     As of March 2, 2021.

31
Capital Structure

     ● Used IPO proceeds to repay in full its second lien                                         Capitalization
       term loan (~$150mm) and prepay ~$250mm of
       its outstanding first lien term loann                                                            FY 2019                       FY 2020
     ● In October 2019, the Company prepaid additional               Cash & Cash Equivalents               $28                         $105
       $15mm of its outstanding first lien term loan
     ● In January 2020, repriced its first lien term loan at
       L+275bps, down from L+375bps originally
                                                                     Total Gross Debt                     $460                         $460
     ● In March 2020, the Company drew down $90mm
       from its revolving credit facility as a precautionary         Net Debt                             $432                         $345
       measure in light of COVID-19
         ● The entirety of this draw down was repaid on              Adj. EBITDA                          $168                         $223
           May 26, 2020
     ● No required principal payments until2025                      Net Debt / Adj. EBITDA                2.6x                         1.6x

                                Interest Coverage (1)                                           Net Leverage (2)

                                                                                    5.5x
                                                             11.2x

                                                                                                 2.9x              2.6x
                             3.7x                                                                                            1.6x

                            2019                             2020                  Pre-IPO     Post-IPO           FY 2019   FY 2020
       Note: Dollars in millions.
       (1)   Defined as Adj, EBITDA / Net Interest Expense
32     (2)   Defined as (Total Debt – Cash) / Adj. EBITDA.
Long-Term Targets

                 Annual Unit Growth                 ~10%

            Comparable Store Sales Growth     1 – 3% annually

                   Adjusted EBITDA          Stable as a % of Sales

             Adjusted Net Income Growth         Mid-teens %

33
APPENDIX
FY 2020 Adjusted EBITDA Reconciliation

                                                                                             2015A             2016A              2017A              2018A              2019A              2020A             Location on P&L

 Net Income                                                                                       $5               $10                $21                $16                $15                  $106

     Interest expense, net                                                                        46                 47                 50                 55                 46                   20        Interest Expense

     Taxes                                                                                          3                  7                  5                  6                  1                 (20)           Income Tax
                                               (a )
     Depreciation and amortization                                                                31                 37                 43                 47                 50                   58            COGS/D&A

 EBITDA                                                                                         $85               $101               $119               $124               $113                  $165
                                         (b)
     Stock-based compensation                                                                       0                  3                  2                10                 31                   38                 SBC
                         (c)
     Non-cash rent                                                                                10                   8                  8                  8                11                   11                SG&A

     Asset impairment and gain or loss on disposition (d)                                           1                  1                  1                  1                  2                   2                SG&A
                                                             (e)
     Provision for accounts receivable reserves                                                     1                  4                  3                  1                  3                (0.5)               SG&A

     Other (f)                                                                                      6                  4                  2                  7                  9                   8                SG&A

 Adjusted EBITDA, revised definition                                                           $107               $121               $135               $152               $168                  $223

     Revised definition no longer adjusts for:                                                                                                                                                                       SG&A
                                                      (g)
       New store pre-opening expenses                                                               2                  3                  2                  2                  2                   2                SG&A

 Adjusted EBITDA, previous definition                                                          $108               $123               $136               $154               $170                  $224
          Note: Dollars in millions.
          (a)     Includes depreciation related to our distribution centers which is included within the cost of sales line item in our consolidated statements of operations and comprehensive income.
          (b)     Fiscal year ended amounts include non-cash share-based compensation expense and $0.4 million and $3.6 million of cash dividends paid in fiscal 2020 and fiscal 2019, respectively, in respect of vested
                  options as a result of dividends declared in connection with our 2018 Recapitalization and our 2016 Recapitalization.
          (c)     Consists of the non-cash portion of rent expense, which represents the difference between our straight-line rent expense recognized under GAAP and cash rent payments. The adjustment can vary
                  depending on the average age of our lease portfolio, which has been impacted by our significant growth in recent years.
          (d)     Represents impairment charges with respect to planned store closures and gains or losses on dispositions of assets in connection with store transitions to new IOs.
          (e)     Represents non-cash changes in reserves related to our IO notes and accounts receivable.
          (f)     Represents other non-recurring, non-cash or non-operational items, such as transaction related costs, including costs related to employer payroll taxes associated with equity awards, secondary equity
                  offerings, store closing costs, personnel-related costs, legal expenses, debt extinguishment and modification costs, strategic project costs, and miscellaneous costs.

35        (g)     Includes marketing, occupancy and other expenses incurred in connection with store grand openings, including costs that will be the IO’s responsibility after store opening.
FY 2020 Adjusted Net Income Reconciliation
                                                                                                                                           FY 2019                                    FY 2020

                Net Income                                                                                                                            $15.4                                      $106.7

                   Stock-based compensation expenses (a )                                                                                               31.4                                        38.1
                                      (b)
                   Non-cash rent                                                                                                                        10.6                                        10.7
                                                                               (c)
                   Asset impairment and gain or loss on disposition                                                                                       2.0                                         1.7

                   Provision for accounts receivable reserves (d)                                                                                         2.6                                        (0.5)
                           (e)
                   Other                                                                                                                                  8.9                                         7.7
                                                                                                             (f)
                   Amortization of purchase accounting assets and deferred financing costs                                                              11.9                                        11.8
                                                                                                      (g)
                   Tax impact of option exercises and vesting of restricted stock units                                                                  (3.6)                                     (44.1)
                                                          (h)
                   Tax effect of total adjustments                                                                                                     (18.9)                                      (19.5)

                Adjusted Net Income, revised definition                                                                                               $60.3                                      $112.7

                   Revised definition no longer adjusts for:

                      New store pre-opening expenses (i )                                                                                                 1.5                                         1.5
                   Revised definition now adjusts for:

                      Tax impact of option exercises and vesting of restricted stock units (g)                                                            3.6                                       44.1
                                                                         (h)
                      Change in tax effect of total adjustments                                                                                          (0.4)                                       (0.4)

                Adjusted Net Income, previous definition                                                                                              $65.0                                      $157.9

     Note: Dollars in millions.
     (a)     Fiscal year ended amounts include non-cash share-based compensation expense and $0.4 million and $3.6 million of cash dividends paid in fiscal 2020 and fiscal 2019, respectively, in respect of vested options as a
             result of dividends declared in connection with our 2018 Recapitalization and our 2016 Recapitalization.
     (b)     Consists of the non-cash portion of rent expense, which represents the difference between our straight-line rent expense recognized under GAAP and cash rent payments. The adjustment can vary depending on the
             average age of our lease portfolio, which has been impacted by our significant growth in recent years.
     (c)     Represents impairment charges with respect to planned store closures and gains or losses on dispositions of assets in connection with store transitions to new IOs.
     (d)     Represents non-cash changes in reserves related to our IO notes and accounts receivable.
     (e)     Represents other non-recurring, non-cash or non-operational items, such as transaction related costs, including costs related to employer payroll taxes associated with equity awards, secondary equity offerings,
             store closing costs, personnel-related costs, legal expenses, debt extinguishment and modification costs, strategic project costs, and miscellaneous costs.Represents other non-recurring, non-cash or non-operational
             items, such as transaction related costs, including costs related to employer payroll taxes associated with equity awards, secondary equity offerings, store closing costs, personnel-related costs, legal expenses, debt
             extinguishment and modification costs, strategic project costs, and miscellaneous costs.
     (f)     Represents the amortization of debt issuance costs and incremental amortization of an asset step-up resulting from purchase price accounting related to our acquisition in 2014 by an investment fund affiliated with
             Hellman & Friedman LLC, which included trademarks, customer lists, and below-market leases.
     (g)     Represents excess tax benefits related to stock option exercises and vesting of restricted stock units to be recorded in earnings as discrete items in the reporting period in which they occur.
     (h)     Represents the tax effect of the total adjustments. Because of the increased impact of discrete items on our effective tax rate including the excess tax benefits from the exercise of stock options and vesting of RSU
             share-based awards, beginning in the fourth quarter of fiscal 2019, we changed our methodology to calculate the tax effect of the total adjustments on a discrete basis excluding any non-recurring and unusual tax
             items. Prior to the fourth quarter of fiscal 2019, the methodology we used was to calculate the tax effect of the total adjustments using our quarterly effective tax rate.
36   (i)     Includes marketing, occupancy and other expenses incurred in connection with store grand openings, including costs that will be the IO’s responsibility after store opening.
You can also read