Elliott Investment Management Sends Letter to Board of Directors of Duke Energy Corporation
←
→
Page content transcription
If your browser does not render page correctly, please read the page content below
Media Contact:
Stephen Spruiell
Elliott Investment Management L.P.
(212) 478-2017
sspruiell@elliottmgmt.com
Elliott Investment Management Sends Letter to Board of Directors
of Duke Energy Corporation
Outlines Plan to Create At Least $12 to $15 Billion of Line-of-Sight Near-Term
Value for Shareholders
Calls for New Independent Directors and Strategic Review to Explore a Tax-Free
Separation into Three Regionally Focused Utility Companies
Believes Separation Drives Meaningfully Improved Operations and Execution That
Will Benefit Duke’s Customers and Shareholders
West Palm Beach, Florida (May 17, 2021) – Elliott Investment Management L.P. (“Elliott”),
which manages funds that have an investment in Duke Energy Corporation (“Duke” or the
“Company”) that make it a top 10 investor in the Company, today sent a letter to Duke’s Board
outlining a plan to create $12 to $15 billion of line-of-sight near-term value for shareholders.
Elliott explained that this value upside is based on observable publicly traded market valuation
metrics of Duke’s closest peers and does not incorporate meaningfully higher valuations realized
in recent transactions in Florida and Indiana, which would result in several billion dollars of
incremental value.
In the letter, Elliott argued that Duke’s long-term underperformance has not been reflective of its
high-quality assets and that the Company should explore a separation to increase operational focus
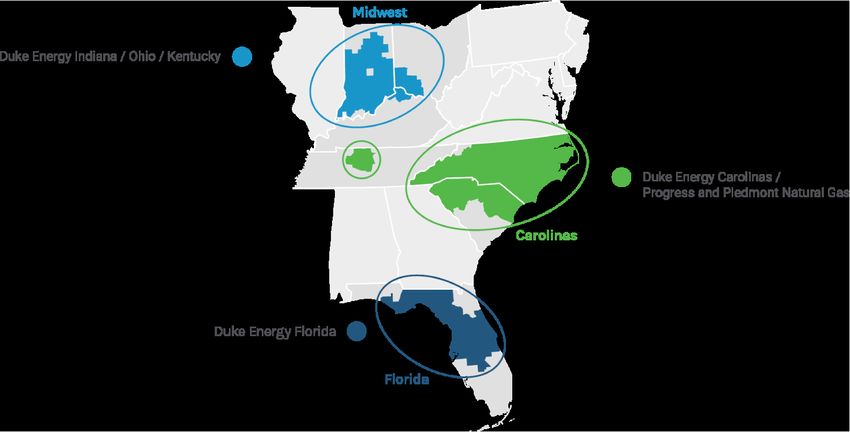
and improve performance. Elliott’s plan proposes that the Company commence a strategic review
to explore a separation into three regionally focused entities: (1) the Carolinas; (2) Florida; and (3)
the Midwest, each of which would be headquartered in the region it serves. Elliott asserted that
this separation will enable greater operational focus resulting in improved execution, better system
reliability, lower costs and increased investment in critical infrastructure, including renewables.
Elliott noted that it engaged with the Duke Board on a private basis over the past month. As a
result of incomplete information regarding its involvement after news reports last week, Elliott has
determined to make public its views and facilitate a broader discussion of the optimal path forward
for the Company.
The letter can be downloaded at DukeRefocused.com.The full text of the letter follows: May 17, 2021 The Board of Directors Duke Energy Corporation 550 South Tryon Street Charlotte, North Carolina 28202 Dear Members of the Board: We are writing on behalf of Elliott Associates, L.P. and Elliott International, L.P. (together “Elliott” or “we”) regarding our investment in Duke Energy Corporation (“Duke”, “you”, or the “Company”). Elliott’s investment in the Company makes us one of its top 10 investors. We have followed Duke, its predecessor entities and the broader U.S. utility industry for almost 20 years. Based on our deep understanding of and extensive research on Duke and the industry, we believe that Duke owns one of the highest-quality and most under-appreciated collections of utility franchises in the country. The Company’s jurisdictions benefit from strong population growth, constructive regulation and significant investment opportunities, including in hardening the grid, improving system reliability, enhancing safety and increasing renewables. Because of these advantages, it is reasonable to expect Duke’s management to deliver first-rate execution on par with the quality of the Company’s assets in order to drive value creation for shareholders and long-term benefits for stakeholders. Unfortunately, top-tier results have proven elusive for Duke, and the Company suffers from a discounted valuation and long-term share price underperformance. Our extensive diligence and conversations with stakeholders have made it clear that the Company’s sprawling, noncontiguous portfolio of utilities has burdened shareholders with a “conglomerate discount” relative to the value of Duke’s utility franchises. Duke’s current ownership of utility businesses across three separate geographies has delivered few benefits for stakeholders and has left its Florida and Midwest utilities undermanaged and undervalued. Elliott has worked with major utilities in similar circumstances, collaborating with directors and management teams to deliver dramatic improvements in operating performance, enhance portfolio configuration and unlock shareholder value. Given our many past engagements and our decades- long experience in the utility industry, we are confident that the underlying causes of Duke’s underperformance can be addressed and that value can be significantly enhanced. Based on our extensive analysis of Duke’s businesses, we believe that Duke should conduct a thorough, unbiased review of a tax-free separation into three regionally focused, publicly traded utility holding companies: the Carolinas, Florida, and the Midwest. 1 1 Carolinas includes Duke Energy Carolinas, Duke Energy Progress, Piedmont Natural Gas, Duke Energy Renewables, Commercial Transmission and International Energy. Florida includes Duke Energy Florida. Midwest includes Duke Energy Indiana and Duke Energy Ohio Kentucky.
This review should be led by an independent Board committee, including new highly qualified
independent directors, and assisted by independent outside advisors. This committee should
investigate a separation of Duke into three focused sets of regionally clustered utilities, each
benefitting from local management and board-level oversight. Crucially, following a separation,
each would have substantial operational scale, sizeable market capitalization and access to
abundant, low-cost equity and debt capital.

We look to the Company’s past to inform its present: Duke’s utilities in Florida and the Midwest
were once operated as separate, standalone public companies, each having more-than-sufficient
scale to operate successfully and thrive. The Duke Carolinas business would remain an
independent Charlotte-based company, likely run by Duke’s current management team, and would
still be a top-five U.S. utility company by market capitalization.

                          Three Regionally Oriented Utility Holding Companies

This proposed review would help address the underlying issues that have resulted in Duke’s
underperformance and should lead to significant value creation. We believe that a separation of
Duke into the Carolinas, Florida, and the Midwest should create $12 to $15 billion of line-of-
sight near-term value for shareholders. This value upside is based on observable publicly
traded market valuation metrics of Duke’s closest peers and does not incorporate
meaningfully higher valuations realized in recent transactions in Florida and Indiana, which
would result in several billion dollars of incremental value. We estimate that the Carolinas,
Florida, and the Midwest would command equity market valuations 2 of $54 to $55 billion, $22 to
$23 billion, and $14 to $15 billion, respectively. The combined value of $90 to $93 billion greatly

2
    See footnote 11 on page 12 for further details.
exceeds Duke’s unaffected equity market capitalization of $78 billion. 3 Importantly, Duke
shareholders would continue to own and be able to benefit from further value accretion over time
from the enhanced operations and growth of these three optimized standalone utilities.
Based on our conversations with current and former top industry executives, review of past utility
sector transactions, and evidence from Duke’s own operating performance, we do not believe there
would be meaningful or lasting dis-synergies from pursuing a separation. Each of the Carolinas,
Florida, and the Midwest would have a strong and unique investment profile, including substantial
scale, strong investment grade credit ratings, a better regionally focused strategy, a high-
performance operating plan and an enhanced capital spending program. At the same time, we
believe a separation would provide considerable benefits for customers and other key stakeholders
because these standalone local utility businesses would benefit from greater operational focus,
improved execution, lower cost of capital and increased capital investment in critical
infrastructure.
We have organized our thoughts as follows:
1) Duke’s Portfolio of High-Quality Utilities
2) Duke’s Existing Conglomerate Structure Has Driven Disappointing Results
3) A Separation Will Benefit Shareholders, Customers and Other Key Stakeholders
4) Next Steps
We began a constructive dialogue over the past month with the Board and senior management on
strategies to remedy Duke’s persistent undervaluation, including ways to (i) strengthen the
Company’s corporate governance, (ii) optimize Duke’s portfolio configuration and (iii) improve
operating and investment execution. We have appreciated the time that senior management and
certain Board directors have taken to hear our perspectives.
Today, we are sharing our thoughts and recommendations publicly, because recent news reports
have left current and prospective Duke shareholders and stakeholders with incomplete information
regarding our involvement. We therefore thought it best to share some of our research, our
perspectives and our proposals regarding Duke and begin a broader conversation about the steps
necessary for the Company to realize its full potential. We remain ready to discuss any aspect of
this letter with you as part of our private dialogue, which we hope to continue.
1. Duke’s Portfolio of High-Quality Utilities
Duke owns a portfolio of high-quality utilities concentrated in premium regulatory, demographic
and growth jurisdictions with attractive investment opportunities and organic growth profiles.
Duke’s regulated utility service territories span three separate and distinct regions — the Carolinas,
Florida, and the Midwest — across seven states. Duke benefits from some of the strongest
underlying organic growth in the regulated utility sector. The Company operates in three states
that from 2010 to 2021 exhibited top-quartile population growth. 4 Duke’s utilities are also
3
As of May 7, 2021, the last trading day before news reports of Elliott’s stake in Duke Energy.
4
Source: SNL.supported by constructive regulation. Weighted by rate base, Duke operates in the top 20% of
jurisdictions in the country, according to RRA rankings. 5
Top 15 States by Annualized Population Growth (2010 – 2021)
1.5% 1.6%
1.2% 1.3% 1.4% 1.4% 1.4% 1.4% 1.4%
1.1%
1.0% 1.0%
0.9% 0.9% 1.0%
DE SD GA NC OR SC ND WA AZ FL CO NV ID TX UT
Source: SNL.
These attractive demographics and constructive regulatory environments within Duke’s service
territories create meaningful opportunities to invest in critical infrastructure for the benefit of
customers while maintaining customer bill affordability. Duke’s own strategy calls for at least a
decade of visible 6.5%–7.0% rate base growth, which translates into an attractive 5.0%–7.0% long-
term earnings per share growth rate.
Despite these public growth metrics, we believe Duke’s current business plan can be further
improved with the right structure and individual leadership teams in place. In its current form,
Duke’s rate base growth in each of its three service areas lags that of its closest regional peers.
With a more focused region-specific strategy, each of Duke’s businesses can perform at a level
that exceeds management’s current ambition. Improved focus would result in increased investment
and stronger reliability and safety metrics, all while maintaining rate affordability. In turn, these
improvements would result in higher earnings per share growth. In particular, we believe Duke’s
Florida and Midwest utilities are highly attractive franchises that receive insufficient management
and Board attention. Consequently, they are underappreciated by investors and overshadowed by
the Company’s Carolinas-dominated portfolio.
Duke’s Florida and Midwest businesses are in growing jurisdictions where utilities command
premium valuations and where there has been robust transaction activity at significant premiums.
Recent market transactions — including Emera’s purchase of TECO Energy, NextEra’s purchase
of Gulf Power, CenterPoint’s purchase of Vectren and Duke’s recent minority-stake sale to GIC
— validate this dynamic. Yet within Duke’s larger portfolio, the Florida and Midwest utilities
simply do not get the attention that they deserve.
2. Duke’s Existing Conglomerate Structure Has Driven Disappointing Results
Despite a portfolio of top-tier utilities, Duke has suffered numerous operational setbacks and
investment and strategic missteps over the past decade, at significant cost to both shareholders
and customers.
5
Source: RRA. Rate base distribution by state is estimated based on company filings and presentations.Duke’s broad portfolio of high-quality utility franchises has not translated into appropriate value
for shareholders. As a result of persistent execution missteps and concerns about management’s
ability to deliver on commitments, Duke has generated total shareholder returns in the bottom third
of the Utilities Select Sector Index (“XLU”) and the regulated utility peer group 6 (“Regulated
Peers”) since the 2012 merger with Progress Energy (the “Merger”). These decisions have resulted
in repeated downward earnings revisions. Duke has reduced its long-term earnings per share
guidance four times in six years, with 2021 earnings per share now guided to be below
management’s expected 2017 earnings per share as of year-end 2014.
Guidance Revisions Since 2014
13% 7% 8% 7%
Below Below Below Below
Guide Guide Guide Guide
$5.53 $5.59 $5.51
$5.26 $5.12 $5.15 $5.15
$4.57
2017 EPS Guidance - As of YE 2020 EPS Guidance - As of YE 2021 EPS Guidance - As of YE 2021 EPS Guidance - As of YE
'14 '15 '16 / '17 '18 / '19
Initial Guidance Actual / 2021 Guidance Midpiont
Source: Company disclosures.
Total Shareholder Return Since the Merger
(83%) vs.
(27%) vs.
Regulated
XLU
Peers
Oct-12
Oct-13
Oct-14
Oct-15
Oct-16
Oct-17
Oct-18
Oct-19
Oct-20
Apr-13
Apr-14
Apr-15
Apr-16
Apr-17
Apr-18
Apr-19
Apr-20
Apr-21
Jul-12
Jan-13
Jul-13
Jan-14
Jul-14
Jan-15
Jul-15
Jan-16
Jul-16
Jan-17
Jul-17
Jan-18
Jul-18
Jan-19
Jul-19
Jan-20
Jul-20
Jan-21
Duke XLU Regulated Peer Average
Source: Bloomberg (as of 5/7/21).
6
Regulated Peers includes Alliant Energy (“LNT”), Ameren Corp. (“AEE”), American Electric Power (“AEP”),
CMS Energy (“CMS”), Dominion Energy (“D”), Evergy (“EVRG”), Eversource Energy (“ES”), The Southern
Company (“SO”), WEC Energy Group (“WEC”) and Xcel Energy (“XEL”).To put our near-term achievable valuation estimates of “$12 to $15 billion of line-of-sight near-
term value for shareholders” in context, if Duke would have only performed in line with the XLU
over this period, Duke’s market capitalization would be approximately $13 billion higher today.
Similarly, and as a more appropriate measure, if Duke would have only performed in line with
Regulated Peers over this period, Duke’s market capitalization would be approximately $40
billion, or 52%, higher today, translating into $52 higher value per share.
Duke’s realized annualized earnings per share growth has been only 2.0% since the Merger 7, as
compared to the Company’s long-term 4% to 6% annualized earnings per share growth guidance
during the period. As a result of this uneven record, the Company’s valuation has de-rated from a
P/E premium in 2013 to a discount today. As measured by dividend yield, this corresponds to a
cost of capital that is among the highest in the regulated utility peer group. Duke’s high cost of
capital adversely affects its ability to efficiently fund investments.
Regulated Peer 2023E P/E Multiples
25.6x
21.2x 21.4x
19.2x 19.3x 19.5x 19.5x 19.6x 19.6x
16.6x 17.1x 17.2x 17.5x 18.0x
AEP EVRG SO DUK D ES Reg. LNT Reg. CMS AEE XEL WEC NEE
Peer Peer +
Median NEE
Median
Source: Bloomberg (as of 5/7/21).
There is a clear explanation for Duke’s poor shareholder returns, its multiple discount and its
elevated cost of capital: The Company has focused more on increasing its footprint and portfolio
than on operational execution and prudent investment, leading to perceptions among those who
follow the Company that Duke is “empire-building” at the expense of shareholder value. As a
result, the Company’s multi-jurisdictional, noncontiguous conglomerate structure has proven
challenging to manage and has generated few, if any, tangible benefits. Under the current structure
and strategy, Duke has made operational, investment and strategic missteps that have impaired
shareholder value, including:
• The Atlantic Coast Pipeline Cancellation: In July 2020, Duke abandoned the Atlantic
Coast Pipeline project, resulting in a $2.1 billion write-off. Before cancellation, the Atlantic
Coast Pipeline project faced numerous delays and cost overruns.
• Coal Ash Remediation Costs: In 2014, coal ash from a Duke power plant spilled into the
Dan River, resulting in significant environmental damage and ultimately leading to certain
7
Represents earnings per share growth from 2012 through 2021 based on the midpoint of 2021 guidance.Duke subsidiaries pleading guilty to criminal violations. A recent settlement on coal ash
remediation costs in North Carolina resulted in a $1.0 billion write-off.
• The Overpriced Piedmont Acquisition: In 2016, Duke acquired Piedmont Natural Gas
at a 42% premium to the unaffected share price and 28x two-year forward P/E, representing
a 61% premium to the gas utility peer average P/E. 8 As a result of decarbonization trends,
gas utilities are currently valued at 17x two-year forward P/E in the public markets.
• Credit Pressures: A weakened balance sheet stemming directly from these execution
missteps has resulted in dilutive equity capital raises totaling $6 billion in 2018, 2019 and
2021. These transactions have diluted shareholders’ interest in Duke’s valuable utility
franchises by nearly 10%. Despite these equity capital raises, Duke has nonetheless been
downgraded by both S&P and Moody’s.
Importantly, this series of missteps has distracted management and created balance sheet pressures
that have crowded out valuable rate base investment opportunities at Duke’s regulated utilities.
Duke’s realized organic rate base growth from 2015 to 2020 was among the lowest in the regulated
electric utility sector.
During the past year, amid a rumored premium acquisition offer from another credible utility
holding company and facing shareholder pressure, the Board and management sought to improve
Duke’s investment proposition by hosting an ESG Analyst Day, pursuing a partial sale of one of
its businesses and implementing several changes to the composition of the Board. However, these
moves have not remedied Duke’s deep undervaluation, underscoring the magnitude of investor
skepticism and the urgent need for a clear and comprehensive plan to unlock the full value of
Duke’s utility franchises.
To be clear, Duke’s underlying utilities are strong. Yet despite their strength, and given the
Company’s numerous investment and operational missteps, investors have lost confidence in the
Company’s current multi-jurisdictional, noncontiguous utility model. To regain investors’ trust,
the Company’s current management and Board must simplify its footprint to a more manageable
and logical service territory, refocusing on its core Carolinas utilities and recommitting to
operational and investment excellence.
3. A Separation Will Benefit Shareholders, Customers and Other Key Stakeholders
A separation into three regionally oriented entities of scale would improve alignment and deliver
the optimal outcome for Duke.
Duke should appoint new highly qualified independent directors to lead an unbiased review
of the value potential from a tax-free separation into three regionally oriented utility holding
companies — the Carolinas, Florida, and the Midwest. In our view, each of these pro forma
entities would have meaningful scale, and we are highly confident that this structure would create
substantial value for shareholders and position Duke to best serve its stakeholders.
8
Source: Capital IQ. Gas utility peer average multiple based on Atmos Energy (“ATO”), ONE Gas (“OGS”),
NiSource (“NI”) and Spire (“SR”).Simplified Current and Post-Separation Structures
Current Structure
Public Shareholders
Duke Energy
$86bn Rate Base (’21E),
Growing 6.7% (’21-’25)
Duke Duke Piedmont Duke Duke Duke Duke
Commercial International
Energy Energy Natural Energy Energy Energy Ohio Energy
Transmission Energy
Carolinas Progress Gas Florida Indiana Kentucky Renewables
Post-Separation Structure
Public Shareholders
New Carolinas-Focused
New Florida Entity New Midwest Entity
Duke Energy
$17bn Rate Base (’21E), $16bn Rate Base (’21E),
$52bn Rate Base (’21E),
Growing 7.6%+ (’21-’25) Growing 4.4%+ (’21-’25)
Growing 7.1% (’21-’25)
Duke Duke Piedmont Duke Duke Duke
Duke Energy Commercial International
Energy Energy Natural Energy Energy Energy Ohio
Renewables Transmission Energy
Carolinas Progress Gas Florida Indiana Kentucky
Based on extensive work with advisors, we believe the separations can be executed efficiently and
on a tax-free basis with minimal financial friction costs, creating three entities with strong,
investment grade credit ratings and with abundant access to low-cost capital. Importantly, the new
structure would preserve the security of Duke’s dividend, with the three pro forma entities
supporting a combined dividend that is at least in line with Duke’s current dividend.
Similarly, we do not believe that a separation of Duke’s noncontiguous service territories would
create meaningful or lasting operational dis-synergies. This is supported by our extensive
discussions with former and current top industry executives. Additionally, data from numerous
precedent sale and separation transactions in the utility sector, including both regulated and non-
regulated subsidiaries, demonstrates that companies are able to largely or entirely mitigate the
impact of any purported dis-synergies.
Furthermore, the past consolidations of Florida and the Midwest from the Progress Energy and
Cinergy mergers, respectively, have produced limited evidence of lasting customer benefits or
synergies outside of the Carolinas. Since these transactions closed, Duke’s operating cost growth
in Florida and Indiana has tracked or exceeded the rate of inflation, and Duke’s utilities in these
states now have costs that are in line with, or worse than, well-run comparable utilities. These data
directly contradict the claim that Duke’s size and scale have created meaningful synergies that
have benefitted customers.
The benefits of a separation should far outweigh any potential friction costs of a separation. We
believe that as standalone utilities, Florida and the Midwest will be able to implement morefocused, high-performance strategies to benefit their respective home jurisdictions. A focused,
truly local utility company would also be better positioned to serve the needs of customers and
build more constructive regulatory relationships.
Duke Non-Generation O&M CAGR in Florida and Indiana Since Relevant Mergers
Well- In Line
Above with
Inflation Inflation
3.6%
3.1%
2.0% 1.9%
1.6% 1.7%
O&M O&M / MWh Inflation O&M O&M / MWh Inflation
Florida Since Progress Merger (2011-2019) Indiana Since Cinergy Merger (2005-2019)
Source: FERC Form 1 Filings (Through SNL).
Following a separation, the new Duke Carolinas business would continue to be an independent,
Charlotte-based company and command considerable scale, with significant runway for further
growth and investment. As a $54 to $55 billion market capitalization, regionally focused utility
company, the role of Duke Carolinas in the business community of North and South Carolina
would be undiminished. We support the de-risking and optimization efforts the Company has
undertaken in the Carolinas.
However, we have strong indication that operating performance at the non-Carolina utilities will
dramatically improve with the additional management focus following a separation. Consider
Duke Energy Florida, for example: Relative to the other two key Florida investor-owned
utilities, Duke Energy Florida has residential customer rates that are approximately 30%
higher, unit costs that are 40%–120% higher and the lowest rate base growth.
Duke Energy Florida 2019 Cost Performance
Non-Generation O&M / MWh
(Duke FL - 39 GWh)
$28.5
$19.9 $21.0
$14.3 $16.0
$9.1
FPL TECO Top Quartile Duke FL Median Bottom Quartile
Source: FERC Form 1 Filings (Through SNL).Duke Energy Florida Customer Rates Relative to Other Florida Utilities
Residential Customer Bill
($/1,000 kWh)
$149 $152
$123 $127 $133 $136 $136
$111 $112 $113 $121 $121
FPL TECO Beaches OUC City of JEA Clay Florida GRU City of Duke FL Gulf
Energy Talla- Electric Keys Ocala Power
hassee Electric
Source: JEA Electric Rate Comparison.
Despite these higher costs and customer rates, Duke Energy Florida is the least reliable of Florida’s
investor-owned utilities, and its customer satisfaction scores consistently rank in the bottom two
among large utilities in the Southeast. Our conversations with Florida stakeholders are consistent
with the perspective that Duke Energy Florida is effectively “run out of North Carolina” without
the same local utility strategy adopted by Florida Power & Light (“FPL”) and Tampa Electric. A
separation into a locally run Duke Energy Florida would correct this lack of focus and set the
Company on a path toward robust growth and greater shareholder returns.
2019 Index of Total Customer Outage Time
Highest
Outage
Time
Better Reliability
98
86
72
51
FPL Gulf Power TECO Duke FL
Source: EIA. Excludes “Major Event Days” as determined by EIA.
J.D. Power 2020 Residential Customer Satisfaction Rankings: South Large Utilities
J.D. Power Customer Satisfaction Index
(out ot 1,000)
801
791
779 774 773 770 769 765 764 763 757 753
FPL GA Power CPS Entergy AL Power Duke TECO Entergy Duke OG&E Duke FL Dominion
Energy LA Progress AR Carolinas Energy
Source: J.D. Power. 9
9
Peer set as determined by J.D. Power.Results from other utilities demonstrate that local management focus can meaningfully improve
execution. In Florida, rate base growth at the two other investor-owned utilities (in which Florida
operations comprise the majority of each company’s regulated business) is top-tier within the
regulated utility industry. Additionally, FPL has been able to maintain flat unit costs over the past
ten years. Following the acquisition of Gulf Power from Georgia-based Southern Company by
FPL’s parent, Gulf Power has implemented a Florida-centric business model, which has led to
reduced costs, improved reliability and higher rate base growth. In Indiana, investor-owned
utilities guided by Indiana-focused strategies have similarly planned aggressive investment
programs, resulting in best-in-class rate base growth.
Florida Utilities Rate Base Growth Indiana Utilities Rate Base Growth
9.2% ~9% 20.0%
7.6%
14.6%
8.0%
4.2% 4.0%
CenterPoint NIPSCO AES I&M (AEP) Duke
Indiana Est. Electric Indiana (2021-2025) Energy
FPL (NextEra) Tampa Electric Duke Energy (2021-2024) Est. (2021-2025) Indiana
(2018-2022) (Emera) (2021- Florida (2021-2025) (NiSource) (2021-2025)
2023) (2021-2024)
Source: Company disclosures. Source: Company disclosures, research analyst estimates. 10
As a standalone entity, Duke Energy Florida would have a management team solely dedicated to
that business. With that level of focus, Duke Energy Florida could accelerate critical infrastructure
investment and rate base growth to increase system reliability and accelerate renewables build-
out, while also managing the impact on customer bills through cost reductions. More focused peers
such as FPL have successfully operated under such a structure within the state, as have others
across the nation, creating clear lines-of-sight to value creation. With improved operational focus,
a path to industry-leading rate base growth and single-state exposure to perhaps the strongest
regulatory jurisdiction in the country, we are confident that a standalone Duke Energy Florida
could achieve the highest valuation of any regulated utility.
Duke Energy Indiana could see similarly improved execution from increased management
attention. Duke Energy Indiana has suffered from historical operational missteps, including
significant cost overruns at the Edwardsport integrated gasification combined cycle facility, which
were to a significant extent ultimately borne by customers. Duke’s growth rate in Indiana
significantly lags peers, who have embarked on aggressive investment programs to provide a better
electricity product to customers and that drive significant earnings growth. As in Florida, we
believe the additional focus achieved through a standalone Midwest operation provides a clear
path to accelerating investment while better managing customer bills.
These examples illustrate the tremendous value-creation opportunity of a separation, including
these key benefits:
10
CenterPoint Indiana and NIPSCO Electric rate base growth based on research analyst estimates.• Near-Term Valuation Upside: As discussed, a separation into three locally run utilities
unlocks Duke’s sum-of-the-parts discount and highlights the premium value of the high-
quality Florida and Midwest jurisdictions that are currently unaccounted for in the
consolidated structure. We believe that a separation of Duke into the Carolinas, Florida,
and the Midwest should create $12 to $15 billion of line-of-sight near-term value for
shareholders. This value upside is based on observable publicly traded market valuation
metrics of Duke’s closest peers and does not incorporate meaningfully higher valuations
realized in recent transactions in Florida and Indiana, which would result in several billion
dollars of incremental value. We estimate that the Carolinas, Florida, and the Midwest
would command equity market valuations 11 of $54 to $55 billion, $22 to $23 billion, and
$14 to $15 billion, respectively. The combined value of $90 to $93 billion greatly exceeds
Duke’s unaffected equity market capitalization of $78 billion.
• Longer-Term Valuation Upside: Importantly, Duke shareholders would continue to own
and be able to benefit from further value accretion over time from the enhanced operations
and growth of these three optimized, regionally focused utilities.
• Increased Investor Flexibility: Three separate and standalone Duke entities (the
Carolinas, Florida, and the Midwest) would allow investors to choose the jurisdictions in
which they want exposure, with the option to continue to own all three. The combined
dividend from these three pro forma companies should be in line with or greater than
Duke’s current dividend. Lastly, overall cost of capital should be lower, and access to this
lower-cost capital should be abundant.
• Additional Portfolio Levers: As with Duke’s recent sale of a minority interest in Duke
Energy Indiana, the pro forma Duke entities would continue to benefit from portfolio levers
to fund investments and create value for shareholders. For example, CenterPoint’s recent
gas utility sale for 2.5x rate base and 38x trailing P/E highlights the substantial spread
between private and public market valuations for gas utilities. This points to a potential
monetization of all or part of Piedmont Natural Gas as an attractive means of unlocking
additional value in the Carolinas while transitioning toward a higher electric business mix.
We believe this could add an incremental $1 to $2 billion of value beyond what we have
already identified, with minimal cash tax leakage.
• Improved Management Focus: Each of the management teams of the three entities would
be solely focused on improving execution, enhancing regulatory relationships, controlling
costs and pursuing all available rate-affordable growth opportunities for the utilities in their
respective regions.
11
Estimates of near-term achievable fair values for the Carolinas, Florida and the Midwest, are calculated based on
observable relevant valuation metrics from Duke’s Regulated Peers. Duke’s Regulated Peers currently trade at a
median 2021E dividend yield of 2.9%, 2021E P/E of 21.9x, 2022E P/E of 20.6x, 2023E P/E of 19.3x and 2021E
TEV/Rate Base of 1.73x. Note that (i) certain of these Regulated Peers are given stronger weightings for certain of
Duke’s regulated utilities; (ii) a disaggregation of NextEra Energy’s observable valuation metrics is taken into
account for Florida; and (iii) a discount to observable realized valuation metrics from the recent non-control
minority stake sale of Duke Energy Indiana are taken into account for the Midwest.• Better Alignment of Incentives: Management incentives would be fully aligned with
shareholder and stakeholder interests in their limited set of jurisdictions.
A separation also has direct benefits for customers and other stakeholders:
• Local Management and Oversight: Each new entity would be headquartered in the region
it serves, with local management that is focused on the needs and goals of local
constituents.
• Increased Management Attention: A more focused footprint would drive better
operational attention and improved reliability. It would minimize customer rate increases
while also creating more bandwidth for project management and execution, reducing cost
overruns and maximizing the benefit of capital investment for customers.
• Cleaner, More Reliable Energy: Long-term strategic planning tailored to each specific
jurisdiction, without competition for capital, would create an opportunity to improve
reliability and increase investment in renewables and related critical infrastructure.
In contrast to Duke’s current conglomerate structure that has proven unwieldy for management
and the Board, we are proposing that the Company explore a viable alternative with well-
articulated, common-sense benefits for shareholders and stakeholders. After the Company engages
in its independent review, the optimal choice should become clear.
4. Next Steps
We welcome an open dialogue with all stakeholders on the merits of our proposed strategy and
the optimal path forward for Duke.
Duke has many of the components of a premium utility story with the potential to create significant
additional value for shareholders, including constructive regulation, organic growth within its
service territories and a long pipeline of investment opportunities in critical infrastructure.
However, under the current structure, Duke has been unable to execute effectively and maximize
the potential of its premium utility franchises.
During the current period of transformational change in our nation’s energy infrastructure, strong
execution, combined with operational and investment focus, is essential for Duke. The Company’s
ability to enhance the safety, reliability, affordability and sustainability of the energy it provides
to customers rests on its ability to operate effectively, invest appropriately and meet its
commitments. It is now necessary for the Board to fully engage in the review we are suggesting
by appointing new, highly qualified independent directors, hiring independent external advisors,
forming an unbiased committee with new and independent insights, and fully evaluating the
potential for separating into better-focused and more successful regional entities.
As we have discussed at length with Duke’s Board over the past several weeks, we call on Duke’s
Board to work with us to achieve the following two objectives in the immediate term:(1) Appoint new, highly qualified independent Board members, including from among
candidates that we have identified, to bring fresh perspectives to Duke’s Board. These new
directors should bring specific experience and qualifications that the current Board lacks,
including expertise in high-performance electric utility operations and investment, electric
utilities transaction experience, and political, legislative, regulatory and/or community
leadership ties to each of Florida and Indiana.
(2) Create a new, finite-lived Board-level strategic review committee — including both new
and existing directors — with a mandate to engage independent external advisors and fully
evaluate a tax-free separation of Duke into three regional utility holding companies focused
on the Carolinas, Florida, and the Midwest.
We are one of Duke’s largest investors and, based on our record of working with utility boards to
create sustainable shareholder value, we are confident that this independent structure and review
process provides the clearest path for the Company to enhance credibility with investors and
maximize value. In our experience, at every company where we have been a part of a similar
process, doing additional work with fresh perspectives to explore ways to create shareholder value
has always been worthwhile. These exercises test key assumptions, generate a wealth of new data
and perspectives, and nearly always result in one or more action items that create value for
shareholders and leave the businesses stronger for having put in the time and effort.
We look forward to engaging with key stakeholders regarding our ideas, and we are committed to
a transparent process to keep all interested parties fully informed. We thank the Board for
considering our thoughts and look forward to continuing our discussions to unlock Duke’s full
potential.
Sincerely,
Jeff Rosenbaum Jesse Cohn
Jeff Rosenbaum Jesse Cohn
Senior Portfolio Manager Managing Partner
About Elliott Investment Management L.P.
Elliott Investment Management L.P. manages approximately $44 billion of assets. Its flagship
fund, Elliott Associates, L.P., was founded in 1977, making it one of the oldest funds under
continuous management. The Elliott funds’ investors include pension plans, sovereign wealth
funds, endowments, foundations, funds-of-funds, high net worth individuals and families, and
employees of the firm.
###You can also read


