Bernoulli Vacation Scheduling (BVS) Model for Energy efficient intrusion detection in WSN - IOPscience
←
→
Page content transcription
If your browser does not render page correctly, please read the page content below
IOP Conference Series: Materials Science and Engineering

PAPER • OPEN ACCESS

Bernoulli Vacation Scheduling (BVS) Model for Energy efficient intrusion
detection in WSN
To cite this article: Gauri Kalnoor and S GowriShankar 2021 IOP Conf. Ser.: Mater. Sci. Eng. 1049 012007

View the article online for updates and enhancements.

                              This content was downloaded from IP address 46.4.80.155 on 01/05/2021 at 15:08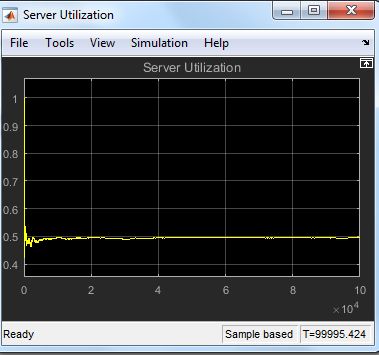
ICAIML 2020                                                                                                              IOP Publishing
IOP Conf. Series: Materials Science and Engineering              1049 (2021) 012007           doi:10.1088/1757-899X/1049/1/012007

       Bernoulli Vacation Scheduling (BVS) Model
       for Energy efficient intrusion detection in
       WSN
                          Gauri Kalnoor 1 and GowriShankar S 2
                          1,2Department of Computer Science & Engineering, BMS College of Engineering,
                          Bangalore, India.
                          E-mail: kalnoor.gauri@ieee.org (GauriKalnoor)

                          Abstract. Cutting-edge wireless sensor networks, security is the most important
                          challenge that has to be considered. Most of the applications of WSN are
                          vulnerable to attacks, as they are deployed in any kind of environment. So, the
                          intrusion detection system is the second line of defense for WSN. The intruder
                          should be detected in WSN more efficiently. We introduce the Bernoulli scheduling
                          rule such that several trials are performed to get the detection of an intruder to be
                          successful once. Since the sensor nodes are always active for detecting an
                          intruder, the energy consumption becomes high. To reduce the consumption of
                          energy, sleep/wakeup, also called small interval vacations are used for the sensors
                          which are almost considered to be like the mechanism of fluid queues. In our
                          proposed work, the vacations are introduced so that the energy used is minimized
                          whenever the sensor is not required to be active. Thus, in our proposed work,
                          since WSN is vulnerable to many harmful attacks, the Bernoulli scheduling rule is
                          applied and the sensor nodes have a vacation state whenever the sensor need not
                          be active, to save the energy consumed. The probability of detecting an intruder is
                          calculated and performance is compared. We have applied a fluid queuing model
                          for the vacations of small intervals in the sensor nodes to minimize the energy
                          consumption and the obtained result is compared with the energy consumed when
                          the vacations are not applied. Thus, the results are simulated for both energy
                          consumed and the number of success rates of detection of an intruder, most
                          importantly the comparison is analyzed with the past work of wsn.

       Keywords: Vacation Policy, Bernoulli Scheduling, Energy consumption, WSN, queuing model,
       Intrusion Detection

       1. Introduction
       The sensor nodes are scattered in Wireless Sensor Network (WSN), which is an ‘application-
       specific’ network. It consists of tiny sensor nodes with energy limited and smart nodes of
       sensors. Every node in the network is capable of detecting a certain situation, processing
       some limited data, and communicating with each other [1]. WSN is mostly used in physical
       environments, which is collected by the small device called nodes; these nodes send
       information periodically to sink and retrieve information from the region in information-
       gathering apps and send it to the sink [2]. WSNs are often defined by resource-limited dense
       implementation in environments. However, the constraints are due to processing capacity,
       storage, and energy in particular because they are generally driven by batteries [3].
       Recharging the batteries in the network of wireless sensors is sometimes impossible due
       primarily to the place of the nodes.

              Content from this work may be used under the terms of the Creative Commons Attribution 3.0 licence. Any further distribution
              of this work must maintain attribution to the author(s) and the title of the work, journal citation and DOI.
Published under licence by IOP Publishing Ltd                          1
ICAIML 2020 IOP Publishing
IOP Conf. Series: Materials Science and Engineering 1049 (2021) 012007 doi:10.1088/1757-899X/1049/1/012007
Many sensor nodes are merged to create a wireless network of sensors that differ tightly within
the critical areas [4]. This sensor position cannot be reconfigured and this particular sensor’s
battery cannot be charged in critical are such as battlefields, thick forests, disaster-prone
fields, and much more [5, 6]. These kinds of network s are used in many apps today, which vary
in their goals and particular limitations. A sensor normally persists in these situations: an
awake state and a sleeping state. A sensor in the waking state makes the size, some
computations are performed and then the information is communicated to the center. The
centers behave as a controller as well as a decision-maker. As sensors are energy-constrained
(limited),a stringent requirement of the algorithm must be imposed encountering energy
efficiency as the major factor. These imposed algorithms can be employed in the controller, i.e.
fusion center.
The model of Intrusion detection [7] in WSN introduces some of the essential parameters
like the range of sensing, node density, energy efficiency, accuracy, and so on. In the field of
interest, the sensors are placed, where WSN can adapt to change in the topology of the
network and the environmental conditions. The model can be designed for Intrusion
detection based on a single node or multiple nodes of sensors and its sensing detection range,
in WSN. One of the issues in WSN is the sensing coverage area and how accurately the
monitored area is tracked or detected. Since, the analytical method is used to quantify the
sensing range and other QoS parameters like buffer capacity, a period of sleep/wake of
sensors, and also energy consumed during the process, other queuing models are used to
limit the capacity of the buffer and schedule the vacation time of the sensor nodes.
Bernoulli’s Rule
Bernoulli’s law stems basically from the theory of energy conservation. This states that at
all stages in a streamline, the sum of all forms of energy in steady flow is the same at all. It
means that there is a constant sum of kinetic energy, potential energy, and internal energy.
The proposed scheduling algorithm determines the nodes of the sensors based on their
active, idle, and sleep modes. In order to assign time slots to all cluster participant nodes, the
time ON and time OFF variables are computed for nodes that are either in sleep or active
mode. The waiting time for sensor nodes in the cluster member is computed on their
listening, sleeping, and activation level status. Additionally, it is presumed that sensor nodes
regarded are of mobile nature and that the clusters are reorganized as a function of time.
2. RELATED WORK
In [8], the authors modified LEACH (MODLEACH) one of the most efficient wireless sensor
networking protocols. In [9], the authors proposed a technique in which the hop’s highest
energy node becomes a cluster-head. The size of each cluster is, therefore, less than and/or
equivalent to hops. The head of the cluster sends information to the other cluster head or sink
with a tree-based minimum energy transmission algorithm owing to the transmission range
restriction of nodes. The authors conducted simulations to compare its efficiency with
standard routing protocol performance, such as direct and minimal transmission energy, and
different energy levels.
In [10], the authors considered network cardinality estimation schemes that use the
calculation of bit-wise maxima over strings as their basic aggregation mechanism. Therefore,
under frequent assumptions, they evaluate how to effectively and efficiently select the
parameters of the data generation process on the estimate, obtain the resulting Maximum
Likelihood (ML) estimator and characterize its statistical performance as a function of
communication and memory requirements. The authors have then compared the bitwise-max
based estimator numerically with the lexico graphic-max based estimators and obtain
insights into their comparative performance according to the real cardinality. The authors
proposed a new, effective algorithm to calculate
2ICAIML 2020 IOP Publishing
IOP Conf. Series: Materials Science and Engineering 1049 (2021) 012007 doi:10.1088/1757-899X/1049/1/012007
The area covered by sensors in a region with transparent and opaque barriers and explores
the issue of identifying and eliminating redundant sensors to enhance energy efficiency while
maintaining network coverage. The suggested algorithm [11] utilizes methods of
computational geometry and applies to both homogeneous and heterogeneous WSNs.
The authors [12] considered the redundancy of sensors in WSN and they performed an
experimental study to better emphasize the importance of its use. They also introduce d OER’
Redundancy-based Energy Optimization,’ a protocol that takes advantage of redundancy to
save energy. Besides, they also stretch OER through a mechanism of fault tolerance. They
demonstrate how OER coupled with the FTMO route performs traditional routing protocols
that do not exploit redundancy through comprehensive simulations. The first break down in
the power usage of the typical sensor node parts is discussed as the primary power
preservation guidelines in WSN’s. Then they presented a systematic and thorough taxonomy
of energy conservation systems. Special attention has been given to promising alternatives,
such as methods for energy-efficient data acquisition.
In [13], the authors, have proposed for WSNs an A-star algorithm, a fresh energy-efficient
routing protocol (EERP). By forwarding data packets via the ideal shortest path, the
suggested routing system increases the network lifetime. In terms of the next-hop sensor
node's highest remaining energy, elevated connection quality, buffer occupancy, and
minimum hop counts, the ideal route can be found. Simulation findings showed that the
system suggested by the authors increase the lifetime of the network compared to the
protocol A-star and Fuzzy Logic (A&F). In [14], the creators, proposed a vitality productive
rest arranging component with a closeness measure for remote sensor systems (ESSM) to
design sensors in either dynamic or rest mode so as to proficiently diminish vitality
utilization. Initially, to adjust vitality utilization, the ideal span of rivalry is assessed to
arrange all sensor hubs into a few groups. Second, a fluffy grid can be accomplished to assess
the level of similarity as per the data accumulated by part hubs, and the relationship work
dependent on the fluffy hypothesis can be set up to part the sensor hubs into different
classifications.
3. MOTIVATIONS AND PROBLEM STATEMENT
The issues of the past work have been analyzed and such issues have been motivated for
various reasons that include the random deployment in any region, with randomly
distributed sensor nodes. The efficient deployment can be obtained in the compulsory
sensing attention. However, specifically, given the region for monitoring in WSN, what makes
us assure that each contact of the specified region is provided security by the number of
sensors needed and covered at that point in the region? Thus, to be specific, the areas where
the required sensors need to be deployed have to be identified such that the probability of
detecting an intruder can be increased, and also the intruder will not be able to exceed the
threshold set for the distance. Additionally, the issue of conserving energy is the challenging
factor in WSNs, mainly due to the regulated energy supply by the sensor nodes,
computational Capacity, and the availability of storage space. Therefore, it implies that the
sensor network should have the capability of self-organization. Importantly, the required
number of sensor nodes must be selected and placed effectively in the region of network
coverage. The sensor’s power is put in a state of ON/OFF so that the sensors will be in sleep
or wake state to enhance the lifetime of WSN.
The proposed work considers the fluid queuing model for efficient utilization of the server
in the network and also vacation scheduling using Bernoulli rule to improve the energy
consumption of the sensor nodes. This model is termed as Bernoulli Vacation Scheduling
(BVS) Model.
4. INTRUSION DETECTION MODEL
Intrusion detection designed in WSN is defined as the technique to detect the abnormal
activity in the network in a certain range of sensing and also to detect the unauthorized
anomalous attackers in motion or intrusions. The deployment of deterministic nodes is
determined by analyzing sufficiently, before the deployment of the network. However,
3ICAIML 2020 IOP Publishing
IOP Conf. Series: Materials Science and Engineering 1049 (2021) 012007 doi:10.1088/1757-899X/1049/1/012007
whenever a deployment is required is random, the deployment quality should be determined
and is the challenging issue in WSN. Thus, the qualities of the deployment of sensor nodes
can be assessed by applying appropriate measures and determine the weakness in the sensing
coverage area of WSNs. This can be determined by calculating the probability of intrusion
detection and the success ratio. One of the fundamental issues in WSN and its characteristics
requires considering the parameters like sensing range and node density w.r.t high
probability of detection. In this section, the model of probabilistic detection of intrusion is
discussed which provides a high accuracy rate and thus obtains high energy saving.
4.1. Probability and its Sensing Model
A network topology deployed randomly is considered, with all the nodes deployed
randomly in the area of interest. The quality of deployment increases as there is an increase
in the probability of detection. The sensing model is designed and the probability is carefully
coupled and the particular application of sensors. The type of the device used for sensing, and
adopt a sensing model to compute the probability whereas the sensor node detects the
occasions situated in the region of the sensing region. All the sensor nodes are unspecified
that they have a similar sensing range. The node density λ with the number of sensor nodes
‘N’ are deployed in the sensor network distributed uniformly over the surface area S. For
every sensor node, the probability of sensors within the sensing range RSENS is determined
at a distance of point by using the Bernoulli experimental rule, where the likelihood of
detecting success rate is given by,
p=
(1)
Thus, a binomial distribution is formed within the distance RSENS for the number of
sensor nodes.
The probability calculated earlier is further represented by the succeeding equation:
P(n = k) = e (2)
!
The single sensor is used for detection and the probability = , when no sensor can
detect an event in the area within the sensing range is considered in the scenario. The
complement of the probability is that, at least one node that is a sensor detects an event.
Thus, the probability of sensing model is represented by,
P(n ≥ 1) = 1 −
P = 1 − e (3)
Agreeing to the scenario of intrusion, the starting point of an intruder is taken randomly in
the area of sensing. Thus, the moves are made arbitrarily as demonstrated in figure 1. To
calculate the probability of an intruder that cannot surpass the value set as the threshold
distance l
is as below
"#
P(n ≥ 1, 0 ≤ l < l
) = 1 − e (4)
Let us assume that a distance threshold $%&' = 0 The probability of detecting an intruder
in WSN with N number of random nodes distributed in a region A with a length of edge L
considering uniform distribution is represented with the equation below. We also consider
that all the sensors those are deployed are static, thus immediately detection of an intruder
can be obtained by the equation below:
*+-*.-/ (234* ≥ 1, 5 %&' = 0) ≥ 674+*789:_*+-*.-/ (5)
Thus,P;>?@A>BC_A@DAEDF is depicted as the threshold probability. All the sensor nodes with its
sensing range are set as follows:
D JKLM NMOQS_N TNUTV
R GH ≥ I (6)
In the applications of WSN, the required numeral of sensors depends on the coverage
4ICAIML 2020 IOP Publishing
IOP Conf. Series: Materials Science and Engineering 1049 (2021) 012007 doi:10.1088/1757-899X/1049/1/012007
quality of the sensors. By the deployment of nodes, the degree k for specified coverage,
fork>0, the probability that an intrusion detection P within the threshold of Intrusion
distance l
can be represented by the multi-sensing model as below:
()U
P(n ≥ k, 0 ≤ l < l
) = 1 − ∑J
EXY E!
e (7)
Here, the surface through which the intruder has swept is denoted by S, with a trajectory l
as:
a
S = 2R GH l
+ πRGH = 2R GH ∫b I f ` (x) + g ` (x) dx + πRGH (8)
The sum of partial densities λ is:
h DU
λ = ∑hEXJ λE = ∑EXJ U
(9)
As the sensing scale and the no. of nodes per elements are increased, the probability of
detecting an intruder in both single sensing model and many -sensing model also increases.
Thus, the formulae discussed above depict the optimal sensing range values and the node
density to cover the total sensing area.
The distance of an intruder l can be calculated by the parametric curve length using,
a
L = ∫b I f ` (x) + g `(x) dx (10)
The intrusion detection probability where the threshold distance l
exceeding in WSNs
with the density of node λ, range of sensing R GH and node availability p in the single
sensing is determined by
"# j
P(n ≥ 1, 0 ≤ l < l
) = 1 − e (11)
The probability P for detecting an intruder within its distance of intruder with
thresholdl
in the multi-sensing i.e. k-sensing in WSNs of compactness of nodeλ, range of
sensingR GH with the availability of node, p is controlled by
(j)U (j)
P(n ≥ 1, 0 ≤ l < l
) = 1 − ∑J
EXY e (12)
E!
S = 2R GH l
+ πRGH (13)
4.2. Working Vacation Scheduling of Sensor nodes
Thus, the problem is to find the quickest change in the detection of an intruder by finding
the minimal observations and builds the Bayesian framework using Markov Decision Process
(MDP). This formulation takes the parameters as, cost caused due to delay in detection, false
alarms, and cost estimated per unit of the network of sensor nodes. At the time slot k, the
(q ) (J) () q
node at the fusion center finds the observation vector mo r ≔ mo , mo , … mo r ∈ uqr and
then computes the probability of change in detection, v o . Thus, the fusion center chooses
control among the set of available controls, w = yz{|}, ∪∈{Y,J,…-} (|2{2 , ). once the
control is chosen when control o = (|2{2 , ), which means that the process of detection
is sustained at the next time slot say k+1 consisting of m number of sensors in the wake state.
Grounded on the theory of Bayesian and MDP model, the optimal policy is obtained which
determines the following rules:
a) Stop rule: In this rule, the sensor node at time slot k, chooses the state, stops, and
sleeps for a small interval of time, termed as vacation period of the sensor node. It
stops at time slot ∗ = inf{ ≥ 0 ∶ vo ≥ Ґ}, where Ґ = [0,1] is the maximum, and
b) Wake rule: For oJ , there endures a map represented by ∗ ∶ [0,1] → and the
optimal policy is obtained by changing the state of the sensor from small working
vacation to the wake state for an optimal number of required sensors in the time slot
k+1, given as: oJ = ∗ v o .
5ICAIML 2020 IOP Publishing
IOP Conf. Series: Materials Science and Engineering 1049 (2021) 012007 doi:10.1088/1757-899X/1049/1/012007
Thus, the sleep/wake state of the sensor node is best suitable when a threshold is applied,
and many small working vacations can be performed between the time intervals, based on the
probability of detection of an intruder.
4.3. The Bernoulli working vacation Process
The sink node selects any of the sensor nodes to begin the working vacation when there is
no activity required within its range of sensing and thus the vacation time follows the
distribution exponentially with the parameter ‘h’. During the vacation period, if any data is
being transmitted, then the node works at a very low speed. If any node finds that the service
completion is needed or if it detects an abnormal behavior at a low-speed rate, in its vacation
period, it switches its state from to the busy state, which means that the vacation is
interrupted. If none of the nodes are in the completion of the vacation period, then the sink
node either makes the sensor as idle or initiates a new transmission of data, with probability
p, a single working vacation changing itself to the regular mode. Otherwise, it may also leave
for the next working vacation with probability = 1 − }, i.e. multiple working vacations. Once
the vacation period is nearly to the end, and if there is more service needed by the nodes,
then the sensor node switches to the normal working mode. During the period of working
vacation, the service time determines the most general random variable as , with its
distribution function, ({).
The primary objective of the proposed methodology as follows:
x Quality in sensor data collection.
x Improve the network's lifetime.
Our scheme uses a multi-sensing adaptive approach to use the positive points of both
cluster and chain-based routing patterns. Redundant data traffic is reduced by correlation, so
efficiency increased. PSN (Primary sensing node) uses a probabilistic method while sensing
in which nodes with greater residual energy has a higher probability to sense and transmit
data so that the energy utilization is equalized on each node. The redundancy or similarity
between the sensed data can be found or related by GCA (Gray correlation analysis. Bernoulli
identical sampling method is used to find the estimated average value of data characteristics.
In the proposed methodology, all nodes are classified into the following types:
x Primary Sensor Node (PSN)
x Secondary collection node (SCN) / Cluster Head
Primary Sensor Nodes senses the environment and initiates transmission of data to
sink.SCN or CH is the second level in the transmission methodology and which collects all
data & optimizes the data by detecting duplicate data & tries to increase the accuracy and
forwards it to the next intermediate nodes to connect the sink.
4.4. Algorithms Designed
Algorithm 1: Cluster head selection and association model
Phase 1: Formation of clusters
Sensor networks strongly alter topology without centralized control to embrace the shift in
topology; Adaptable hierarchical cluster at the K-level is used. A k-level clustering chain of
authority is primarily helpful in reducing the network's power utilization compared to Low -
energy Localized Clustering (LLC). This clustering is especially feasible in reducing the
system's contrasting vitality usage (LLC) because it requires short-run transmission into
account. It also ensures flexibility in the selection of routing for modifications that affect both
the system and the environment. Thus, the X-LLC cluster is used as X-LLC enables the size of
the cluster to be reduced by considering the radius by using separate energy concentrations.
This delivers a significant benefit in terms of minimizing broadcast power consumption
concerning standard cluster-forming hierarchical algorithms [10].
6ICAIML 2020 IOP Publishing
IOP Conf. Series: Materials Science and Engineering 1049 (2021) 012007 doi:10.1088/1757-899X/1049/1/012007
Figure 1: Example of a hierarchical structure (X-LLC, k = 2) [10]
Phase II: Establishment stage
The foundation stage starts after the summit of the political decision technique and
ensnares k-explicit affiliation sub organizes that are practiced in the best down manner
beginning from the Base Station to straight centers. At this stage, 1stkth-level group heads
describe themselves to the BS, which comes back to TDMA table. At that reality, the (k− 1) th
level bunch scrambles toward the closest kth - level group head, that answers by giving the
TDMA table; the cycle rehashes down to the typical specially appointed hub level
In adding up, the accompanying similarly remains constant.
I. Each cluster head reins over scarce hubs.
II. Simple center points find the nearest bunch head with the withdrawing of a single
hop.
III. The program extent of direct center points can be decreased with respect to the one
required by LLC. Accordingly, broadcast needs a little measure of intensity and the
bury group block diminishes.
Algorithm 2: Energy consumption model:
Every sensor node will have two stages active and sleep. Whereas working status is
classified into three stages: working, the transition from active to sleep, and vice versa. The
details can be shown as follows
*+- = ∑XJ 64 3 + * ( ) + (14)
Where 64 represents the number of sensor Bj revolved on or turned off, and
( ) are the power and operational time the sensor Bjis in active status, correspondingly.
* ( )and * ( )are the energy utilization of node state alteration from energetic to sleep
and sleep to active of sensor Bj, correspondingly. An energy utilization model of the
transmission module is presumed as the same as that in sources.% (, ) and ' ( )are the
energy utilization of communicating and obtaining j bits data done a distance d.
% (, ) = %+9+ + ∗ ᾀ ∗ (15)
' ( ) = '+9+ ∗ (16)
where %+9+ and '+9+ *j represents the electronic circuit expenses of the transmitter
and receiver, and they are independent with the communicating distance. [Joule/ (bit/
ma)] denotes the energy costs to send a bit over a distance d with a satisfactory signal to noise
ratio and it's constant. ᾀ represents path loss interpreter which relays on the properties of the
broadcasting channel. Generally, it is assumed that
7ICAIML 2020 IOP Publishing
IOP Conf. Series: Materials Science and Engineering 1049 (2021) 012007 doi:10.1088/1757-899X/1049/1/012007
%+9+ = '+9+ ∗ = +9+ (17)
5. DISCUSSION RESULTS AND NUMERICAL EXPERIMENTS
In the proposed work, we have evaluated the model for the probability of intrusion
detection in WSN by using the simulation Software NS2. According to the model probability,
the model is evaluated based on the node density, distance of an intrusion, and also the
sensing range. We consider N number of static sensor nodes in the field of interest in WSN,
which are uniformly distributed and are independent. The results show the probability of
intrusion detection P having at smallest one sensor node that discovers in the detecting range
RSENS and N number of sensor nodes. As the detecting range and the number of nodes
increases, the probability of discovery of intruder also increases. The two possible cases are
discussed to show the performance of WSN when intrusion is detected.
Figure 2: Waiting Time of nodes (Theoretical)
Figure 3: Server Utilization
The proposed approach is compared with EELEACH protocol and EDCSWS and the
results are shown as:
8ICAIML 2020 IOP Publishing
IOP Conf. Series: Materials Science and Engineering 1049 (2021) 012007 doi:10.1088/1757-899X/1049/1/012007
1. Dead Nodes:
Figure 4: Analysis of dead Nodes
2. Throughput
Figure 5: Number of Nodes Versus throughput
This is the number of information bundles conveyed on from a sourcing hub to a target
hub for a discrete unit of time. The fig shows the throughput accomplished by both directing
conventions. The throughput is recouped as related to other winning strategies. The outcome
clearly shows that throughput achieved in our prescribed convention is improved when
contrasted with others. With the developing number of hubs, the estimation of throughput is
additionally increasing.
9ICAIML 2020 IOP Publishing
IOP Conf. Series: Materials Science and Engineering 1049 (2021) 012007 doi:10.1088/1757-899X/1049/1/012007
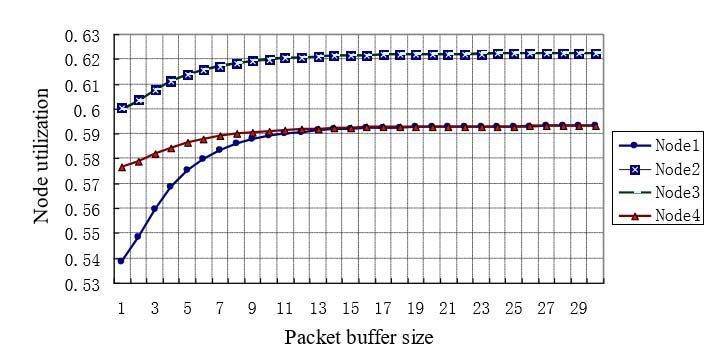
Figure 6: Node utilization v/s packet buffer size
Figure 7: Probability of Detection of Intruder
Figure 7 depicts the curves obtained by the experimental results of the probability of
intrusion detection-based model which is considered as a function with intrusion separate for
distinct values of rate of availability of nodes, p. If the distance of intruder l increases, the
probability of detection P also increases. When the network activity is in normal cycle mode,
then the rate of node obtains probability p should be typically less than the value 1.0. It is
required that it must be satisfied that the monitored area is to be considered effective without
the overall area coverage to be diminished. If the detection of an intruder is successful by a
node, a message with an alarm is broadcasted to the entire sensor network. Thus, the
detection efficiency can be improved by assuring the effective connectivity of the network.
This is illustrated by the rate of node availability p =1.0.
The comparison is performed and tabulated in table 1. The QoS parameters are considered
for measuring the performance of the proposed algorithm based on Bernoulli scheduling
vacation methodology. Our proposed work is compared with EEEACH and EDCSWS based
on throughput, transmission delay, energy variance, sensing probability, probability of
detection of an intruder. By the simulation and experimental results performed the proposed
methodology BVS has obtained better performance results with minimum energy
consumption and high throughput.
10ICAIML 2020 IOP Publishing
IOP Conf. Series: Materials Science and Engineering 1049 (2021) 012007 doi:10.1088/1757-899X/1049/1/012007
Table 1: Comparison of performance of the proposed algorithm with other protocols
Energy Sensing Throughput Transmission Probability
Variance Probability Delay (ms) Detection
(joules) of
Intruder
EELEACH 0.0022 200 0.27
2-8 0.4
EDCSWS 0.025 230 0.31
2-18 0.6
Proposed 0-5 0.15 250 0.25
Algorithm 0.8
(using
Bernoulli
scheduling)
6. CONCLUSION
The energy-saving is an important factor for the efficient working any wireless sensor
networks. Since the sensor nodes are always active for detecting an intruder, the energy
consumption becomes high. To reduce the consumption of energy, sleep/wakeup, also called
small interval vacations are used for the sensors which are almost considered to be like the
mechanism of fluid queues. Here in the proposed work, we are introducing the Bernoulli
scheduling rule and the sensor nodes have a vacation state whenever the sensor need not be
active, to save the energy consumed. Based on the sensing coverage area, the intruder
distance l is computed considering the probability of intrusion detection. The probability
obtained shows the better performance of the network with high availability of node and also
the working vacations set for every sensor node to save energy and lifetime of the network.
The waiting time of the nodes is simulated and shown in the results. Also, server utilization is
calculated as discussed. Results are being compared with EELEACH (energy-efficient and
EDCSWS and found that our proposed algorithm is more efficient in comparison to the
EELEACH and EDCSWS. Thus, our results of the proposed work enable us to propose and
analyze the sensor network and help us for considering the diagnostic parameters of a
network such that the network requirements are met.
References
[1]. Lasassmeh, S., M., Conrad, J., M.: Time synchronization in wireless sensor networks: A
survey. Conference Proceedings-IEEE SoutheastCon 2010: Energizing Our Future, 242-
245, Concord. (2010).
[2]. Son, J., H., Lee, J., S., Seo, S., W.: Topological key hierarchy for energy-efficient group key
management in wireless sensor networks. Wireless Personal Communications, Vol. 52, No.
2, 359-382. (2010)
[3]. Tan, L.; Tang, S. Energy harvesting wireless sensor node with temporal death: Novel
models and analyses. IEEE/ACM Trans. Netw. 2017, 25, 896–909. [CrossRef]
[4]. Tang, S.; Tan, L. Reward rate maximization and optimal transmission policy of EH device
with temporal death in EH-WSNs. IEEE Trans. Wirel. Commun. 2017, 16, 1157–1167.
[CrossRef].
[5]. Hosen, A.S.M.S.; Cho, G.H. An energy-centric cluster-based routing protocol for wireless
sensor networks. Sensors 2018, 18, 1520. [CrossRef] [PubMed].
[6]. Mostafaei, H. Energy-efficient algorithm for reliable routing of wireless sensor networks.
IEEE Trans. Ind. Electron. 2019, 66, 5567–5575. [CrossRef].
[7]. Srbinovska, M.; Cundeva-Blajer, M. Optimization methods for energy consumption
estimation in wireless sensor networks. J. Sustain. Dev. Energy Water Environ. Syst. 2019,
11ICAIML 2020 IOP Publishing
IOP Conf. Series: Materials Science and Engineering 1049 (2021) 012007 doi:10.1088/1757-899X/1049/1/012007
7, 261–274. [CrossRef].
[8]. Kempa, W.M. Buffer overflow duration in a model of WSN node with power-saving
mechanism based on SV policy. In Proceedings of the 23rd International Conference on
Information and Software Technologies (ICIST), Druskininkai, Lithuania, 12–14 October
2017; pp. 385–394.
[9]. Kempa, W.M. Transient queue-size distribution in a finite-capacity queueing system with
server breakdowns and Bernoulli feedback. In Proceedings of the 43rd International
Conference on Applications of Mathematics in Engineering and Economics (AMEE),
Sozopol, Bulgaria, 7 December 2017.
[10]. J. Jia, X. Wu, J. Chen, and X. Wang, “Exploiting sensor redistribution for eliminating
the energy hole problem in mobile sensor networks,” EURASIP Journal on Wireless
Communications and Networking, vol.2012, article 68, 2012.
[11]. L. Tao, Z. Wang, and Z. Liu, “The GI/M/1 queue with Bernoulli- schedule- controlled
vacation and vacation interruption,” Applied Mathematical Modeling, vol.37, no.6,
pp.3724– 3735, 2013.
[12]. Smith, J. M. G. (2015). Queue decomposition & finite closed queueing network
models, Computers & Operations Research, 53, 176-193.
[13]. Diabat, A., Dehghani, E. and Jabbarzadeh, A. (2017). Incorporating location and
inventory decisions into a supply chain design problem with uncertain demands and lead
times, Journal of Manufacturing Systems, 43, 139–149.
[14]. Zhou, B.; Ahn, D.; Lee, J.; Sun, C., Ahmed, S., Kim, Y. A passive tracking system based
on geometric constraints in adaptive wireless sensor networks. Sensors 2018, 18, 3276.
[CrossRef] [PubMed].
[15]. Ghosh, S.; Unnikrishnan, S. Reduced power consumption in wireless sensor networks
using queue-based approach. In Proceedings of the 5th IEEE International Conference on
Advances in Computing, CommunicationandControl (ICAC3), Mumbai, India,1–
2December2017; doi:10.1109/ICAC3.2017.8318794. [CrossRef].
12You can also read