Sustainable Asset Valuation (SAVi) of Paterson Park's Building Infrastructure
←
→
Page content transcription
If your browser does not render page correctly, please read the page content below
Copernicus Climate Change Service

             Sustainable Asset Valuation (SAVi) of
             Paterson Park’s Building Infrastructure:

             City of Johannesburg (South Africa)

             Issued by: IISD-EU / David Uzsoki

             Date: April 2021

             Ref: D428h.2.5.1

             Official reference number service contract: 2019/C3S_428h_IISD-EU/SC1
Copernicus Climate Change Service

  This document has been produced in the context of the Copernicus Climate Change Service (C3S). The activities leading to
  these results have been contracted by the European Centre for Medium-Range Weather Forecasts, operator of C3S on behalf
  of the European Union (Delegation Agreement signed on 11/11/2014). All information in this document is provided "as is"
  and no guarantee or warranty is given that the information is fit for any particular purpose. The user thereof uses the
  information at its sole risk and liability. For the avoidance of all doubts, the European Commission and the European Centre
  for Medium-Range Weather Forecasts has no liability in respect of this document, which is merely representing the authors
  view.

Sustainable Asset Valuation (SAVi) of Paterson Park’s Building Infrastructure l Page 2 of 36
Copernicus Climate Change Service

               The International Institute for Sustainable Development (IISD) and KnowlEdge Srl have
               worked on integrating climate data from the Copernicus Climate Data Store (CDS) to
               improve the analysis of infrastructure projects performed with SAVi. The project serves
               to demonstrate the importance and usability of climate data generated through the CDS
               products in deploying sustainable infrastructure projects to contribute to a climate-
               resilient, low-carbon economy.

               The assessment of the Paterson Park’s Building Infrastructure is one of the use cases for
               demonstrating the value of integrating climate data of the Copernicus database into
               SAVi.

               Acknowledgements

               We are grateful for the support of the City of Johannesburg and would like to thank, in
               particular, Liana Strydom for engaging with us. Special thanks also to Chilufya Lombe
               and Justin Mellis for their input.

               About the Sustainable Asset Valuation (SAVi)
               SAVi is a simulation service that helps governments and investors value the many risks
               and externalities that affect the performance of infrastructure projects.

               The distinctive features of SAVi are:

                  •    Valuation: SAVi values, in financial terms, the material environmental, social, and
                       economic risks and externalities of infrastructure projects. These variables are
                       ignored in traditional financial analyses.
                  •    Simulation: SAVi combines the results of systems thinking and system dynamics
                       simulation with project finance modelling. We engage with asset owners to
                       identify the risks material to their infrastructure projects and then design
                       appropriate simulation scenarios.
                  •    Customization: SAVi is customized to individual infrastructure projects.
               For more information on SAVi: www.iisd.org/savi

Sustainable Asset Valuation (SAVi) of Paterson Park’s Building Infrastructure l Page 3 of 36
Copernicus Climate Change Service
About Copernicus Climate Data Store
The European Commission has charged the European Centre for Medium-Range
Weather Forecasts (ECMWF) to implement the Copernicus Climate Change Service
(C3S). The main goal of C3S is to deliver high-quality data to support climate change
adaptation and mitigation policies (ECMWF, 2017). One of the main features of C3S is
the Climate Data Store (CDS), which delivers current, past, and future climate indicators.
The CDS contains historical climate observations, Earth observation datasets, global and
local climate projections, seasonal forecasts, and global and local climate analyses
(ECMWF, 2017).
Data obtained from the CDS Toolbox include location-specific, historical, and future
weather indicators, such as precipitation and temperature. Historical data (ECMWF
Reanalysis 5th generation [ERA5]) and projections (Coupled Model Intercomparison
Project Phase 5 [CMIP5]) are available for consultation and download in the CDS.
Selected indicators are also accessible through a dedicated online app created to
facilitate the exchange of information between the CDS and several SAVi models. The
SAVi tool uses climate information to estimate damage resulting from extreme weather
events and climate trends, establish the value addition resulting from improved
adaptive capacity, and calculate the supply and demand of ecosystem services (Bassi et
al., 2020). For example, through the integration of data on precipitation, evaporation,
and crop water requirements into the SAVi model, it is possible to evaluate current and
future water supply in a specific landscape and inform planning for irrigation
infrastructure (Bassi et al., 2020).
The Integration of Climate Data into the SAVi Model (Bassi et al., 2020) outlines the
integration of authoritative Copernicus climate data from the CDS into the SAVi tool. It
describes how several climate indicators obtained from the CDS were integrated into
SAVi and how its analysis has improved as a result. In light of this integration, the
International Institute for Sustainable Development can generate sophisticated SAVi-
derived analyses on the costs of climate-related risks and climate-related externalities.
Authors
Andrea M. Bassi
Liesbeth Casier
Georg Pallaske
David Uzsoki
Sustainable Asset Valuation (SAVi) of Paterson Park’s Building Infrastructure l Page 4 of 36Copernicus Climate Change Service
Executive Summary
The Paterson Park Precinct project is part of Johannesburg’s Corridors of Freedom Initiative, which
seeks to improve social cohesion within the urban environment. Buildings (social housing, sports
facilities, and a recreational centre) are a core component of this project.
The project is also part of the Global Environment Facility (GEF) Sustainable Cities Impact Program,
which promotes holistic urban planning to maximize environmental and social benefits and to avoid
negative trade-offs.
The City of Johannesburg’s Development Planning Department requested a comparison of the
buildings of the Paterson Park project with greener and climate-resilient building designs.
The Sustainable Asset Valuation (SAVi) application includes an economic and financial valuation of
the Paterson Park Project – Buildings, a comparative economic and financial valuation of a building
with higher energy and water efficiency requirements, and a simulation of these values under
different climate scenarios.
The Copernicus Climate Change Service (C3S) data that was used for this assessment includes
precipitation patterns, temperature changes, and heating and cooling degree days.
Three messages arise from the results of the SAVi assessment:
• Over the life cycle of buildings, there are significant cost savings in energy and maintenance
expenditures for green buildings.
• Climate change has the largest impact on the cost of energy expenditures, both under
Representative Concentration Pathway (RCP) 4.5 and RCP 8.5 scenarios. It also increases the
cost of greenhouse gas emissions further under both climate scenarios, and this is the case
in both the business-as-usual and green building scenarios.
• Solar power generates a positive return on investment and is a worthwhile investment for
buildings in South Africa, especially taking into account the rising electricity prices.
Sustainable Asset Valuation (SAVi) of Paterson Park’s Building Infrastructure l Page 5 of 36Copernicus Climate Change Service
Table ES1. How decision-makers can use this analysis
Stakeholder Role in the project How will the stakeholder use the results of the
assessment with C3S data?
City of Design and oversight of the • To make better decisions on urban
Johannesburg precinct project. planning and climate adaptation.
• To inform the design of the next-
generation (green) building standards.
• To ensure future buildings are green, low
carbon, and resilient to changing
climates.
United Coordinator and supervisor • To showcase the value of green buildings
Nations of several project for reducing costs for the city and
Environmental components of a GEF- enhancing overall environmental
Programme funded project, including regeneration and resilience.
(UNEP) the eco-district pilot in • To use the SAVi outputs as evidence to
Paterson Park Precinct. inform and design other urban projects.
• To raise awareness on how climate data
can be integrated into urban planning
and the design of green and resilient
buildings.
Global Main donor for the design, • As quantitative evidence for the GEF that
Environment assessments, and funding of green buildings is aligned with
Facility (GEF) implementation of several their objectives to promote
eco-districts in environmental sustainability and climate
Johannesburg, including the change adaptation. The latter is
Paterson Park Precinct. implemented through the GEF’s Least
Developed Countries Fund (LDCF) and
the Special Climate Change Fund (SCCF).
• To appreciate the valuations on low-
carbon and resilient buildings.
• To make a market for and build expertise
on low-carbon and resilient cities by
implementing eco-districts.
• To define funding priorities for resilient
cities.
Sustainable Asset Valuation (SAVi) of Paterson Park’s Building Infrastructure l Page 6 of 36Copernicus Climate Change Service Table of Contents 1 Introduction ............................................................................................................................................. 12 2 Methodology: SAVi Paterson Park – Buildings ........................................................................................ 13 2.1 Systems Thinking and System Dynamics .......................................................................................... 13 2.2 CLD .................................................................................................................................................... 13 2.3 Climate Data ..................................................................................................................................... 17 2.4 Assumptions and Data Inputs for the SAVi Assessment................................................................... 20 3 Results: SAVi Paterson Park – Buildings .................................................................................................. 22 3.1 Integrated Cost–Benefit Analysis ..................................................................................................... 22 3.3 Project Finance Indicators (Solar Panels) ......................................................................................... 28 4 Conclusion ............................................................................................................................................... 29 References .................................................................................................................................................. 30 Annex 1 ....................................................................................................................................................... 32 Sustainable Asset Valuation (SAVi) of Paterson Park’s Building Infrastructure l Page 7 of 36
Copernicus Climate Change Service

List of Figures
Figure 1. CLD of the Paterson Park buildings .................................................................................................. 15

Figure 2. Change in air temperature under RCP 8.5........................................................................................ 17

Figure 3. Change in air temperature under RCP 4.5........................................................................................ 18

Figure 4. Change in precipitation under RCP 8.5 ............................................................................................. 19

Figure 5. Change in precipitation under RCP 4.5 ............................................................................................. 19

Figure 6. Energy expenditure (life cycle) ......................................................................................................... 26

Figure 7. Water expenditure (life cycle) .......................................................................................................... 27

List of Tables
Table 1. Causal relations and polarity ............................................................................................................. 13

Table 2. A comparison of building expenditures for the BAU and green scenarios........................................ 20

Table 3. Integrated life-cycle cost (40 years)................................................................................................... 22

Table 4. Integrated CBA under the RCP 2.6 scenario ...................................................................................... 23

Table 5. Integrated CBA under the RCP 4.5 scenario ...................................................................................... 24

Table 6. Integrated CBA under the RCP 8.5 scenario ...................................................................................... 25

Table 7. Energy expenditure (life cycle) .......................................................................................................... 26

Table 8. Water expenditure (life cycle) ........................................................................................................... 27

Table 9. IRR and NPV for solar panels on buildings ......................................................................................... 28

Table 10. The assumptions used for the project finance model ..................................................................... 28

Sustainable Asset Valuation (SAVi) of Paterson Park’s Building Infrastructure l Page 8 of 36
Copernicus Climate Change Service

Glossary
Causal loop diagram: A schematic representation of key indicators and variables of the system
under evaluation that shows the causal connections between them and contributes to the
identification of feedback loops and policy entry points.

Discounting: A finance process to determine the present value of a future cash value.

Feedback loop: “A process whereby an initial cause ripples through a chain of causation ultimately
to re-affect itself” (Roberts et al., 1983).

Indicator: Parameters of interest to one or several stakeholders that provide information about the
development of key variables in the system over time and trends that unfold under specific
conditions (United Nations Environment Programme [UNEP], 2014).

Internal Rate of Return (IRR): An indicator of the profitability prospects of a potential investment.
The IRR is the discount rate that makes the net present value of all cash flows from a particular
project equal to zero. Cash flows net of financing give us the equity IRR.

Methodology: The theoretical approach(es) used for the development of different types of analysis
tools and simulation models. This body of knowledge describes both the underlying assumptions
used as well as qualitative and quantitative instruments for data collection and parameter
estimation (UNEP, 2014).

Model transparency: The degree to which model structure and equations are accessible and make
it possible to directly relate model behaviour (i.e., numerical results) to specific structural
components of the model (UNEP, 2014).

Model validation: The process of assessing the degree to which model behaviour (i.e., numerical
results) is consistent with behaviour observed in reality (i.e., national statistics, established
databases) and the evaluation of whether the developed model structure (i.e., equations) is
acceptable for capturing the mechanisms underlying the system under study (UNEP, 2014).

Net benefits: The cumulative amount of monetary benefits accrued across all sectors and actors
over the lifetime of investments compared to the baseline, reported by the intervention scenario.

Net present value (NPV): The difference between the present value of cash inflows net of financing
costs and the present value of cash outflows. It is used to analyze the profitability of a projected
investment or project.

Optimization: A stream of modelling that aims to identify the policy or set of policies that deliver
the best possible outcome from a set of alternatives, given a set of criteria (i.e., parameters to
optimize) and/or constraints (i.e., available budget) (UNEP, 2014).

Sustainable Asset Valuation (SAVi) of Paterson Park’s Building Infrastructure l Page 9 of 36
Copernicus Climate Change Service

Representative Concentration Pathways (RCPs): “The Representative Concentration Pathways
(RCPs) describe four different 21st century pathways of greenhouse gas (GHG) emissions and
atmospheric concentrations, air pollutant emissions and land use. The RCPs have been developed
using Integrated Assessment Models (IAMs) as input to a wide range of climate model simulations
to project their consequences for the climate system” (IPCC, 2020).

Scenarios: Expectations about possible future events used to analyze potential responses to these
new and upcoming developments. Consequently, scenario analysis is a speculative exercise in which
several future development alternatives are identified, explained, and analyzed for discussion on
what may cause them and the consequences these future paths may have on our system (e.g., a
country or a business).

Simulation model: Models can be regarded as systemic maps in that they are simplifications of
reality that help to reduce complexity and describe, at their core, how the system works. Simulation
models are quantitative by nature and can be built using one or several methodologies (UNEP,
2014).

Social cost of carbon: The economic cost caused by an additional tonne of carbon dioxide emissions
or its equivalent through the carbon cycle (Nordhaus, 2017).

Stock and flow variables: “A stock variable represents accumulation and is measured at one specific
time. A flow variable is the rate of change of the stock and is measured over an interval of time”
(UNEP, 2014, p. 51).

System dynamics: A methodology developed by J. Forrester in the late 1950s (Forrester, 1961) to
create descriptive models that represent the causal interconnections between key indicators and
indicate their contribution to the dynamics exhibited by the system as well as to the issues being
investigated. The core pillars of the system dynamics method are feedback loops, delays, and non-
linearity emerging from the explicit capturing of stocks and flows (UNEP, 2014).

Vertical/horizontal disaggregation of models: Vertically disaggregated models contain a high level
of detail on the sectoral level (i.e., energy), while horizontally disaggregated models focus on
capturing the interconnections between several sectors and contain less detail on the sectoral level
(UNEP, 2014).

Sustainable Asset Valuation (SAVi) of Paterson Park’s Building Infrastructure l Page 10 of 36
Copernicus Climate Change Service

List of Abbreviations
 BAU                    business as usual
 C3S                    Copernicus Climate Change Service
 CBA                    cost–benefit analysis
 CDS                    Climate Data Store
 CLD                    causal loop diagram
 CMIP5                  Coupled Model Intercomparison Project Phase 5
 CO2e                   carbon dioxide equivalent
 ECMWF                  European Centre for Medium-Range Weather Forecasts
 ERA5                   ECMWF Reanalysis 5th generation
 GEF                    Global Environment Facility
 GHG                    greenhouse gas
 IRR                    internal rate of return
 NPV                    net present value
 O&M                    operation and management
 PV                     photovoltaic
 RCP                    Representative Concentration Pathways
 SAVi                   Sustainable Asset Valuation tool
 UNEP                   United Nations Environment Programme

Sustainable Asset Valuation (SAVi) of Paterson Park’s Building Infrastructure l Page 11 of 36
Copernicus Climate Change Service

1 Introduction
Paterson Park Precinct is a master project that is part of the Johannesburg Corridors of Freedom.
The upgrade of the area aims to create an urban environment that promotes social cohesion. The
project consists of retrofitting old buildings, as well as building new facilities. The Paterson Park
project is also part of the Global Environment Facility (GEF) Sustainable Cities program, 1 which
promotes holistic urban planning to maximize environmental and social benefits, aiming to avoid
negative trade-offs. The Paterson Park project includes two components:

      •    A stormwater facility and open space (link to other SAVi assessments).
      •    A buildings component consisting of a new library, swimming pool, sports facilities, and the
           retrofitting of a multi-purpose recreation centre.
This SAVi assessment focuses on the second component. The International Institute for Sustainable
Development worked with the City of Johannesburg to evaluate and compare the current upgraded
and new buildings with greener and more climate-resilient building designs.

The Copernicus climate data helps us understand how climate change impacts the City of
Johannesburg and the building project. The data that were used for this assessment include
precipitation, temperature change, and heating and cooling days.

The data and climate scenarios have been integrated into the customized SAVi model for the
buildings of the Paterson Park project. The buildings assessed include an administrative building, a
pool, a gym, and a library. The SAVi assessment evaluates the economic performance of the current
buildings and compares it to a greener, more climate-resilient project under different climate
scenarios.

1
    See more about the Sustainable Cities program here: https://www.thegef.org/topics/sustainable-cities

Sustainable Asset Valuation (SAVi) of Paterson Park’s Building Infrastructure l Page 12 of 36
Copernicus Climate Change Service
2 Methodology: SAVi Paterson Park – Buildings
2.1 Systems Thinking and System Dynamics
The underlying dynamics of the Paterson Park building project, including driving forces and key
indicators, are summarized in the causal loop diagram (CLD) displayed in Figure 1. The CLD includes
the main indicators analyzed during this SAVi assessment, their interconnections with other relevant
variables, and the feedback loops they form.
The CLD illustrates the interconnections of the economy and environment while highlighting key
dynamics and potential trade-offs emerging from different scenarios envisaged for the Paterson
Park project. The CLD is the starting point for the development of the mathematical stock and flow
model.
2.2 CLD
The SAVi Buildings model provides a blueprint for discussions on risks, benefits, and climate impacts
of building projects (Bassi et al., 2017). For this assessment, we have adjusted and customized the
CLD for the Paterson Park buildings. Figure 1 presents the CLD of the basic dynamics that underlie
the analysis of the building project.
To design solution-oriented and effective interventions, CLDs need to capture the causal relations
of a system correctly. Therefore, CLDs establish causal links between variables by linking them with
arrows and attributing a sign to the arrow (either + or −) that indicates whether a change in one
variable generates a positive or negative change in the other.
• “A causal link from variable A to variable B is positive if a change in A produces a change
in B in the same direction.
• A causal link from variable A to variable B is negative if a change in A produces a change
in B in the opposite direction” (Bassi et al., 2016).
Table 1. Causal relations and polarity
Variable A Variable B Sign
+
+
-
-
Sustainable Asset Valuation (SAVi) of Paterson Park’s Building Infrastructure l Page 13 of 36Copernicus Climate Change Service Moreover, these causal interactions can form what is known as a positive or negative “feedback loop” (Forrester, 1961). In other words, an intervention made in that system can support the tendency toward an equilibrium within the overarching system, in which case this negative feedback loop is called a balancing loop. Alternatively, an intervention can reinforce the intervention’s impact and hence create a positive feedback loop, which is called a reinforcing loop (Bassi, 2009; Forrester, 1961). What makes CLDs useful for decision-makers and other stakeholders is this feedback component, showing how the different elements within a system interact with each other and either exacerbate or ameliorate a given situation (The Economics of Ecosystems and Biodiversity, 2018). These mapped relationships may not necessarily indicate linear behaviour, and potential impacts may be delayed, which is why a CLD that captures the extent and complexity of this system is important. The interaction of feedback loops may also be where the source of a given policy problem lies, and therefore where decision-makers will need to direct their efforts for finding a solution—along with being aware of how this solution will affect the rest of the system (World Wildlife Fund, 2014). We have applied the SAVi Buildings model to inform stakeholders of the risks, benefits, externalities, and climate impacts of the Paterson Park project. The assessment monetizes risks and externalities and provides information about social and environmental impacts on top of the conventional economic assessment. Figure 1 presents the CLD of the basic dynamics that underlie the analysis. Sustainable Asset Valuation (SAVi) of Paterson Park’s Building Infrastructure l Page 14 of 36
Copernicus Climate Change Service
Figure 1. CLD of the Paterson Park buildings
precipitation
water recycling +
and reuse water collection
from buildings
+ +
+ rainwater
+ waste water
reuse of waste harvesting
water water +
efficiency -
- -
solar generation water
water +
potential expenditure
consumption
distributed power + +electricity generation
+
generation (e.g. solar pv) from buildings -
electricity
energy consumption + expenditure +
-
(appliances) +
+ electricity operations costs
+ +
+ consumption
co2 emissions from +
energy consumption - +
electricity generation
(lighting)
+ energy
+ effiiciency fossil fuels
hours of expenditure
lighting +
- demand for fossil fuels +
energy consumption (air
heating, cooling + circulation, heating and air + for ventilation, heating co2 emissions
and ventilation conditioning) and air conditioning from heating
systems +
+
+ heating degree
population days (hdds)
density cooling degree
- + + indoor labor
population temperature - days (cdds)
+ - - productivity
demand for demolition of
+ construction - climate +
living space + buildings + buildings heat stress effect on
hazards
labor productivity
maintenance
costs
sustainable + + albedo impact on
materials + surface temperatures
construction + + total building
+ employment
+ materials in building + expenditure
+ + +
recyling +
demand for +
construction capital costs
- recycled +
materials - construction +
materials +
labor
- solid waste for income
energy efficiency and energy consumption landfills
process improvement + for the production of
construction materials
-
co2 emissions from production
+ of construction materials
Variables in black represent those that are conventionally considered when undertaking a building.
The way they are interconnected in the CLD represents the basic dynamics of the system in which a
building project is embedded. Building projects have a construction phase, an operation and
maintenance (O&M) phase, and a demolition phase. The variables and dynamics of the system that
are related to the building’s construction phase are on the bottom left side of the diagram. The
variables and dynamics related to the system’s O&M phase are on the right-hand side of the
diagram.
From the building’s construction phase, we see that its construction depends positively on changes
in population. Population growth generates demand for building construction, which leads to more
buildings. This, in turn, generates demand for construction inputs such as construction materials
and labour. The cost of these inputs is responsible for the building project’s capital costs.
Sustainable Asset Valuation (SAVi) of Paterson Park’s Building Infrastructure l Page 15 of 36Copernicus Climate Change Service Continuing with the building system’s basic dynamics, represented by black variables, the building’s operational costs are attributable to water, electricity, and fossil fuel expenditure. These operational costs depend largely on water and energy consumption. Further, a building project’s O&M phase generates costs in terms of maintenance and employment. These O&M costs, together with the capital costs incurred during the construction phase, determine total building expenditure. The basic dynamics of the system and the outcomes of the project can be altered if additional investments or efforts are made in sustainability and efficiency. Thus, the orange variables are included to represent variables related to a green building scenario. During the construction phase, the project’s outcomes can be altered with the use of sustainable materials, recycling, and changes in energy efficiency. During the building’s O&M phase, outcomes can be altered with energy and water efficiency changes, the use of sustainable materials, and water reuse. Green variables represent externalities, which are side effects of the project. Externalities are impacts of the building project that affect a third party in the system. Specifically, we see that construction practices lead to carbon dioxide (CO2) emissions and generate waste, which ends up in landfills. Operation practices also lead to CO2 emissions, produce wastewater, and can have an impact on labour productivity. These are negative side effects caused by the building project. A third party will have to incur the cost of these externalities during the project’s lifetime. For example, CO2 emissions are related to health risks. A third party will likely incur emissions-related health costs as a result. On the other hand, building projects are also linked to positive externalities. Both the construction and O&M phases of the project generate employment. This employment leads to a positive externality in terms of labour income being generated. Finally, pink variables represent climate effects that are incorporated into the model using the climate data from the Copernicus CDS. Climate change can have a notable effect on the project outcomes. These impacts will materialize as additional costs and thus must be considered as a part of the project’s assessment. From the CLD, we see that an increase in wind pressure will lead to an increase in demand for construction materials. This is because increased wind intensity is likely to cause damage to buildings, which will require repair. Climatic changes can also affect the amount of solar energy that is generated, the amount of energy for lighting that is demanded, and the amount of rainwater that is harvested. In addition, changes in temperature will affect energy consumption and labour productivity. Changes in the number of heating and cooling degree days a building requires will change as a result of temperature changes. This will impact the project’s O&M costs. Increased temperature levels and albedo can also lead to heat stress, which has been shown to have a negative effect on labour productivity. All of these impacts can change the underlying dynamics of the system and the predicted outcomes of the project. The CLD presented in Figure 1 shows the interconnectedness of socio-economic and environmental key indicators. It allows for a greater understanding of the potential impacts of sustainable investments and climate change and how these impacts would unfold through the system. Sustainable Asset Valuation (SAVi) of Paterson Park’s Building Infrastructure l Page 16 of 36
Copernicus Climate Change Service
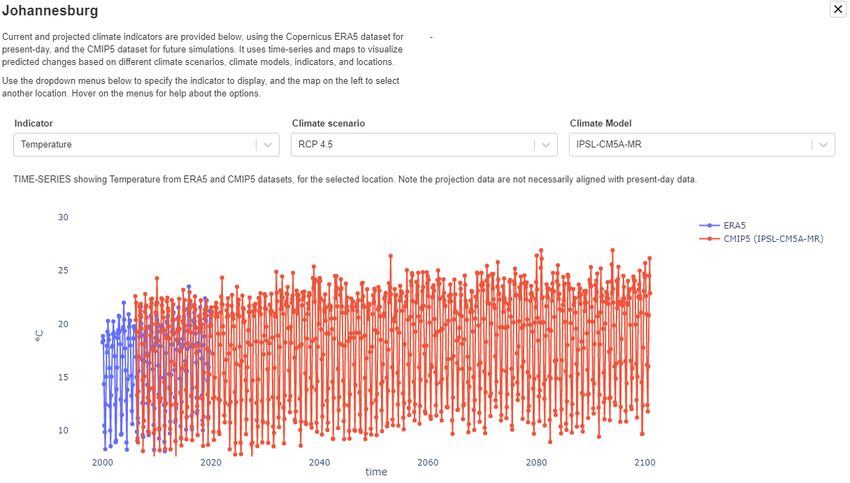
2.3 Climate Data
The Copernicus CDS provides data to forecast how different climate variables will change in
Johannesburg over time. Figures 2 to 5 below show how air temperature and precipitation are
changing in Johannesburg. Two climate scenarios are included:
• The Representative Concentration Pathways (RCP) 4.5 climate scenario assumes that
emissions peak in 2040 and begin to decline thereafter.
• The RCP 8.5 scenario assumes that fossil fuel-intensive forms of energy generation
continue to be used heavily through the remainder of the century.
The blue line represents the historical data (ECMWF Reanalysis 5th generation [ERA5] database),
and the red line represents the climate projection (Coupled Model Intercomparison Project Phase 5
[CMIP5]) based on different datasets, with results from different global circulation models.
Figure 2. Change in air temperature under RCP 8.5
Sustainable Asset Valuation (SAVi) of Paterson Park’s Building Infrastructure l Page 17 of 36Copernicus Climate Change Service Figure 3. Change in air temperature under RCP 4.5 Figure 2 and Figure 3 show the predicted temperature changes in Johannesburg using the Copernicus CDS under the RCP 8.5 scenario and the RCP 4.5 scenario, respectively. Both figures show an increasing trend in air temperature; however, this increase is larger under the RCP 8.5 scenario. Sustainable Asset Valuation (SAVi) of Paterson Park’s Building Infrastructure l Page 18 of 36
Copernicus Climate Change Service

Figure 4. Change in precipitation under RCP 8.5

Figure 5. Change in precipitation under RCP 4.5

Sustainable Asset Valuation (SAVi) of Paterson Park’s Building Infrastructure l Page 19 of 36
Copernicus Climate Change Service

Figure 4 and Figure 5 show the predicted precipitation in Johannesburg under RCP 8.5 and RCP 4.5,
respectively, using the data found in the Copernicus CDS. High precipitation events will be more
frequent under both climate scenarios, but this is more evident under the emission-intensive RCP
8.5 climate scenario. The spikes in both figures represent events with high levels of precipitation.
These spikes tend to become greater over time under the RCP 8.5 scenario.

2.4 Assumptions and Data Inputs for the SAVi Assessment
For this SAVi assessment, we compare a business-as-usual (BAU) scenario, which represents the
Paterson Park buildings as they were upgraded and constructed today, with a green scenario, which
includes greener features in relation to energy use (e.g., more efficient appliances and insulation).
Further, we compare the performance of the green buildings to the conventional buildings under
various climate scenarios.

Table 2. A comparison of building expenditures for the BAU and green scenarios

                        BAU                                                      Green
 Capital and            In the BAU scenario, capital and operational             For the green building scenario, it is
 operational            expenditures are based on project-specific               assumed that capital expenditure is 2%
 expenditures           data.                                                    less for conventional buildings when
                                                                                 compared to green buildings (World
                                                                                 Green Building Council, 2013).
                                                                                 Additionally, in terms of operation costs,
                                                                                 it is assumed that sustainable buildings
                                                                                 are 40% more cost efficient than
                                                                                 conventional buildings (Ping & Chen,
                                                                                 2016). These O&M costs cover wear and
                                                                                 tear of wall painting, light, roofing and
                                                                                 ceiling maintenance, as well as
                                                                                 replacement and mechanical
                                                                                 maintenance of energy and water
                                                                                 systems. It does not include
                                                                                 expenditures for energy or water usage.
 Energy                 Energy expenditure is calculated based on the            Changes in energy expenditures are
 expenditure            energy requirements of the building and the              based on project-specific assumptions
                        cost of electricity. The building’s energy               about the differences in the energy
                        requirements are based on project-specific               usage of green buildings when
                        data. The cost of electricity in the City of             compared to conventional buildings.
                        Johannesburg is set at ZAR 1.786/kWh (City               The total annual expenditure for
                        Power Johannesburg (SOC) LTD., 2020). The                electricity use is estimated at ZAR
                        total annual expenditure for electricity use is          106,505 per year.
                        estimated at ZAR 257,200 per year.                       The same cost savings for solar PV
                        Additionally, cost savings from solar                    energy generation as in the BAU are
                        photovoltaic (PV) energy generation are based            assumed.
                        on project-specific data. This calculation
                        assumes that the load factor of the installed
                        capacity is 19% and that solar PV is responsible
                        for energy substitution for 6 hours per day. The
                        total amount of installed capacity is 180 kW. In

Sustainable Asset Valuation (SAVi) of Paterson Park’s Building Infrastructure l Page 20 of 36
Copernicus Climate Change Service
addition, it is assumed that only 60% of the
generation is available for own consumption
(i.e., for reducing grid electricity use).
Water The cost of water use in buildings is based on Water expenditure is assumed to be the
expenditure the predicted water usage of the building and same for the green building scenario and
water price. Provided project-specific data on the BAU scenario.
the hot water consumption of the building and
total water usage is calculated assuming that
hot water accounts for 30% of the share of
water use in the building. The cost of water use
is then calculated using the assumption that
the water costs ZAR 0.02696/litre (Randburg
Sun, 2017).
The cost of water used for irrigation is based on
an assumption from Peace Corps (1976) that
each m2 of irrigated surface requires 50 litres of
water every month. Cost is then calculated
using the assumption that water costs ZAR
0.0269/litre (Randburg Sun, 2017).
Externalities – The cost of greenhouse gas (GHG) emissions is There are no additional assumptions for
GHG emissions calculated based on the social cost of carbon, the externalities in the green building
which is assumed to be USD 31 per tonne of scenario. Differences in the value of
CO2 equivalent (CO2e) emissions (Nordhaus, externalities between the BAU scenario
2017). Additionally, this calculation assumes a and the climate scenario are based on
grid emissions factor of 0.00094 tonnes of CO2e the changes in energy consumption
emissions per kWh of electricity generated and between the two scenarios.
distributed by the electricity grid (National
Business Initiative, 2016).
Externalities – The cost of discretionary spending is based on There are no additional assumptions for
Discretionary project-specific estimates of the employment the externalities in the green building
spending required by the project. We assume 20 full- scenario. Differences in the value of
time equivalent positions involved in the externalities between the BAU scenario
construction phase of the Paterson Park and the climate scenario are based on
buildings. Employment during the O&M phase the changes in energy consumption
is significantly lower. Over 2 years, the between the two scenarios.
simulation model uses an average of six full-
time equivalent positions. Additionally, this
calculation assumes that the average annual
salary of those employed for the project’s
construction, operation, and maintenance is
ZAR 500,000 (Business Insider SA, 2019).
It also assumes that the percentage of income
that is used for discretionary spending is 24%
(Numbeo, 2019).
Sustainable Asset Valuation (SAVi) of Paterson Park’s Building Infrastructure l Page 21 of 36Copernicus Climate Change Service
3 Results: SAVi Paterson Park – Buildings
3.1 Integrated Cost–Benefit Analysis
Table 3 provides the summary results of the integrated cost–benefit analysis (CBA) that is provided
in more detail in the section below. Under different climate scenarios and for the BAU versus green
building design, the integrated life-cycle cost of buildings changes.
The BAU building scenario results in a cost between ZAR 461,367,293 and ZAR 462,000,596,
depending on the climate scenario. This cost includes externalities such as the cost of GHG emissions
and discretionary spending due to additional employment related to the project. The green building
scenario results in a significantly lower cost over the life cycle of the project, ranging between ZAR
311,859,445 and ZAR 312,132,753.
Climate change increases the life-cycle cost of buildings for both the BAU and the greener design.
Under the RCP 4.5 scenario, the cost of the BAU and green designs both increase 0.2%. Under the
RCP 8.5 scenario, the cost of the green design increases by 2.1%. The cost of BAU under RCP 8.5
decreases by 1.2%, mainly because precipitation under that scenario increases to an extent that the
cost for irrigation decreases.
It must be noted that we did not include a potential cost of flood damage should precipitation
increase so much that the stormwater infrastructure of Paterson Park would not be able to absorb
this. A separate SAVi assessment on the stormwater infrastructure of Paterson Park was conducted
to assess flood damages. Nature-based stormwater infrastructure and green spaces contribute
significantly to reduced flood risk and potential damages in the surrounding area. The results of the
SAVi stormwater infrastructure assessment can be found here.
Table 3. Integrated life-cycle cost (40 years)
BAU Green Difference relative to RCP 2.6
RCP 2.6 ZAR 461,367,293 ZAR 311,859,445 BAU Green
RCP 4.5 ZAR 462,083,129 ZAR 312,348,784 0.2 % 0.2 %
RCP 8.5 ZAR 462,000,596 ZAR 312,132,753 -1.2 % 2.1 %
Table 4 shows the detailed integrated CBA under the RCP 2.6 scenario. The net life-cycle cost,
including the positive and negative externalities of the BAU scenario, amounts to ZAR 461,367,293,
whereas the green scenario amounts to ZAR 311,859,445. There are significant cost savings because
of energy expenditure, maintenance costs, and a significantly lower cost of GHG emissions over the
40-year life cycle of the buildings.
Sustainable Asset Valuation (SAVi) of Paterson Park’s Building Infrastructure l Page 22 of 36Copernicus Climate Change Service
Table 4. Integrated CBA under the RCP 2.6 scenario
RCP 2.6
Integrated CBA (ZAR) BAU Green
Project-related investment and costs
Capital investment 120,225,960 122,679,944
O&M cost 270,695,456 162,417,472
Energy expenditure 53,265,432 18,793,268
Baseline energy expenditure 65,679,268 31,207,104
Climate impacts on energy expenditure
Cost savings from solar PV -12,413,836 -12,413,836
Climate impacts on solar PV performance
Water expenditure 6,056,209 6,056,209
Water expenditure from use in building 2,632,364 2,632,364
Irrigation water expenditure (outdoor) 3,423,845 3,423,845
Climate impacts on irrigation water
expenditure
Subtotal (1): Project-related investment
450,243,057 309,946,893
and costs
Externalities
Costs of GHG emissions 15,693,504 6,481,820
Baseline cost of GHG emissions 15,693,504 6,481,820
Climate impacts on cost of GHG emissions
Discretionary spending -4,569,268 -4,569,268
Costs of indoor air quality 0 0
Baseline costs of indoor air quality
Cost of labour productivity lost due to
heat stress
Subtotal (2): Externalities 11,124,237 1,912,552
TOTAL net cost 461,367,293 311,859,445
Table 5 shows the detailed integrated CBA under the RCP 2.6 scenario. The impact of climate change
is visible on energy and water expenditure, as well as on the cost of GHG emissions. The latter
Sustainable Asset Valuation (SAVi) of Paterson Park’s Building Infrastructure l Page 23 of 36Copernicus Climate Change Service
increases with ZAR 94,333 in the BAU and ZAR 59,025 in the green scenario because energy
expenditure increases under the RCP 4.5 scenario.
The impact of climate change increases energy expenditure by ZAR 314,740 and reduces the cost
savings from solar PV by ZAR 68,470 in the BAU. In the green scenario, the impact of climate change
on energy expenditure is lower, up to ZAR 182,576.
Table 5. Integrated CBA under the RCP 4.5 scenario
RCP 4.5
Integrated CBA (ZAR) BAU Green
Project-related investment and costs
Capital investment 120,225,960 122,679,944
O&M cost 270,695,456 162,417,472
Energy expenditure 65,994,008 31,389,680
Baseline energy expenditure 65,679,268 31,207,104
Climate impacts on energy expenditure 314,740 182,576
Cost savings from solar PV -12,413,836 -12,413,836
Climate impacts on solar PV performance 68,470 68,470
Water expenditure 6,294,502 6,294,502
Water expenditure from use in building 2,632,364 2,632,364
Irrigation water expenditure (outdoor) 3,423,845 3,423,845
Climate impacts on irrigation water
238,293 238,293
expenditure
Subtotal (1): Project-related investment and
450,864,560 310,436,232
costs
Externalities
Costs of GHG emissions 15,787,837 6,540,845
Baseline cost of GHG emissions 15,693,504 6,481,820
Climate impacts on cost of GHG emissions 94,333 59,025
Discretionary spending -4,569,268 -4,569,268
Costs of indoor air quality 0 0
Baseline costs of indoor air quality
Cost of labour productivity lost due to heat
stress
Subtotal (2): Externalities 11,218,570 1,912,552
TOTAL net cost 462,083,129 312,348,784
Sustainable Asset Valuation (SAVi) of Paterson Park’s Building Infrastructure l Page 24 of 36Copernicus Climate Change Service
Table 6 shows the integrated CBA under the RCP 8.5 scenario. Similarly, as with the results of the
RCP 4.5 scenario, the climate impact is primarily visible on energy and water expenditure, as well as
the cost of GHG emissions. We also note a small impact on the cost of labour productivity due to
heat stress.
Table 6. Integrated CBA under the RCP 8.5 scenario
RCP 8.5
Integrated CBA (ZAR) BAU Green
Project-related investment and costs
Capital investment 120,225,960 122,679,944
O&M cost 270,695,456 162,417,472
Energy expenditure 66,142,196 31,455,110
Baseline energy expenditure 65,679,268 31,207,104
Climate impacts on energy expenditure 462,928.00 248,006.00
Cost savings from solar PV -12,302,214.00 -12,302,214.00
Climate impacts on solar PV performance -12,413,836 -12,413,836
Water expenditure 111,622.00 111,622.00
Water expenditure from use in building 5,969,889 5,969,889
Irrigation water expenditure (outdoor) 2,632,364 2,632,364
Climate impacts on irrigation water
3,423,845 3,423,845
expenditure
Subtotal (1): Project-related investment and
450,731,287 310,220,201
costs
Externalities
Costs of GHG emissions 15,833,897 6,564,789
Baseline cost of GHG emissions 15,693,504 6,481,820
Climate impacts on cost of GHG emissions 140,393.00 82,969.00
Discretionary spending -4,569,268 -4,569,268
Costs of indoor air quality 4,679 0
Baseline costs of indoor air quality 0 0
Cost of labour productivity lost due to heat
4,678.85 0.00
stress
Subtotal (2): Externalities 11,269,308 1,912,552
TOTAL net cost 462,000,596 312,132,753
Sustainable Asset Valuation (SAVi) of Paterson Park’s Building Infrastructure l Page 25 of 36Copernicus Climate Change Service
Under the high-emission scenario (RCP 8.5), the cost of building infrastructure increases further.
Green building design remains the cheaper option over the life cycle.
Table 7 and Figure 6 zoom in on the energy expenditure and how it changes due to climate impacts
under RCP 4.5 and 8.5.
Figure 6. Energy expenditure (life cycle)
70,000,000
60,000,000
50,000,000
40,000,000
30,000,000
20,000,000
10,000,000
0
RCP 2.6 RCP 4.5 RCP 8.5
BAU Green
Table 7. Energy expenditure (life cycle)
Energy expenditure
over the life cycle BAU Green
RCP 2.6 ZAR 53,265,432 ZAR 18,793,268
RCP 4.5 ZAR 65,994,008 ZAR 31,389,680
RCP 8.5 ZAR 66,142,196 ZAR 31,455,110
Figure 7 and Table 8 zoom in on the water expenditures across the different climate scenarios.
Sustainable Asset Valuation (SAVi) of Paterson Park’s Building Infrastructure l Page 26 of 36Copernicus Climate Change Service
Figure 7. Water expenditure (life cycle)
6,400,000
6,300,000
6,200,000
6,100,000
6,000,000
5,900,000
5,800,000
RCP 2.6 RCP 4.5 RCP 8.5
BAU Green
Table 8. Water expenditure (life cycle)
Water expenditure over
the life cycle BAU Green
RCP 2.6 ZAR 6,056,209 ZAR 6,056,209
RCP 4.5 ZAR 6,294,502 ZAR 6,294,502
RCP 8.5 ZAR 5,969,889 ZAR 5,969,889
Water expenditure changes based on the amount of water required for irrigation when both (4.5
and 8.5) are compared to RCP 2.6. In-house water use is assumed to be the same across all scenarios,
hence the same cost of water use. The RCP 8.5 scenario indicates a lower cost for irrigation and a
higher cost for RCP 4.5, which is due to the differences in precipitation relative to the RCP 2.6
scenario. In the case of RCP 8.5, precipitation is on average higher, meaning less need for irrigation
and therefore a cost saving. Precipitation is lower in the RCP 4.5 scenario compared to the RCP 2.6
scenario, leading to higher irrigation needs and thus costs.
A comparative table of all results per climate scenario for the integrated CBA as well as in cost per
m2 for the buildings can be found in the annex to this report.
Sustainable Asset Valuation (SAVi) of Paterson Park’s Building Infrastructure l Page 27 of 36Copernicus Climate Change Service
3.3 Project Finance Indicators (Solar Panels)
The project finance model for the Paterson Park project focused on the performance of investment
in solar panels. We simulated different scenarios with and without inflation on the cost of electricity
(8% per year) and with the impact of the different climate scenarios. The results are in Table 9.
Both the internal rate of return (IRR) and net present value (NPV) indicate that under all scenarios,
solar panel installations are a worthwhile investment because they generate a sufficiently avoided
cost of electricity that would otherwise need to be purchased. This avoided cost becomes larger in
the scenarios that take into account inflation and make solar panels an even more profitable
investment. Finally, we note that there is a minor impact of climate change on the performance of
solar panels, resulting in a lower IRR and NPV in the RCP 4.5 and RCP 8.5 scenarios compared to the
BAU.
Table 9. IRR and NPV for solar panels on buildings
IRR NPV
BAU 21.30% 3.97
BAU (no inflation) 13.26% 1.17
RCP 4.5 21.22% 3.93
RCP 4.5 (no inflation) 13.19% 1.16
RCP 8.5 21.19% 3.91
RCP 8.5 (no inflation) 13.16% 1.15
Table 10. The assumptions used for the project finance model
Capital expenditure: cost of solar panels, ZAR 11/Wp; for a 150 kWp system as in
including installation Paterson Park, ZAR 1,650,000
Lifetime of solar panels 20 years
Energy generation 174 MWh
Cost of electricity ZAR 1.786/kWh, with 8% inflation per year.
We included a scenario with and without this
inflation.
Sustainable Asset Valuation (SAVi) of Paterson Park’s Building Infrastructure l Page 28 of 36Copernicus Climate Change Service 4 Conclusion The SAVi analysis on the Paterson Park Precinct – Buildings project demonstrates the economic and financial attractiveness of retrofitting and constructing new buildings in accordance with high green building standards. Over the life cycle of these projects, significant cost savings materialize in comparison to buildings with lower environmental building standards. Further, the SAVi analysis also demonstrates that the integration of climate data and running climate scenarios on infrastructure projects helps to better plan expenditures, in particular in relation to water and energy in this case. The assessment provides insight for the City of Johannesburg’s Development Planning Department for future urban planning, as well as for advocating for next generation of green building standards. The assessment also showcases for stakeholders in the GEF Sustainable Cities program that quantitative evidence on cost reductions and externalities in relation to building projects can indeed be generated and used as input to inform and design other urban projects. Sustainable Asset Valuation (SAVi) of Paterson Park’s Building Infrastructure l Page 29 of 36
Copernicus Climate Change Service

References
Bassi, A. (2009). An integrated approach to support energy policy formulation and evaluation.
[Ph.D. dissertation, University of Bergen]. https://core.ac.uk/download/pdf/30896832.pdf
Bassi, A., Bechauf, R., Casier, L., Lago, S., Pallaske, G., Perera, O., Perrette, M., Uzsoki, D., &
Wuennenberg, L. (2020). The integration of climate data into the SAVi model
[2019/C3S_428h_IISD-EU/SC1]. Copernicus Climate Change.
https://www.iisd.org/publications/integration-climate-data-savi-model

Bassi, A., Gallagher, L., & Helsingen, H. (2016). Green economy modelling of ecosystem services
along the “Road to Dawei.” https://www.mdpi.com/2076-3298/3/3/19/htm
Bassi, A, McDougal, K., & Uzsoki, D. (2017, September). Sustainable Asset Valuation Tool:
Buildings. International Institute for Sustainable Development.
https://www.iisd.org/publications/sustainable-asset-valuation-tool-
buildings?q=library/sustainable-asset-valuation-tool-buildings
Business Insider SA. (2016). This is the average monthly salary in SA- which can double if you work
in the electricity sector. https://www.businessinsider.co.za/average-salary-in-south-africa-2019-9
City Power Johannesburg (SOC) LTD. (2020). Amendment of Tariff of Charges for Electricity
Services FY 2020/2021. https://www.joburg.org.za/documents_/Documents/TARIFFS/2020-
21%20Tariffs/ITEM%2007%20-%20Electricity%20Tariffs.pdf
Copernicus Climate Data Store. (n.d.). https://cds.climate.copernicus.eu/#!/home
European Centre for Medium-Range Weather (ECMWF). (2017). ECMWF Newsletter No. 151 –
Spring 2017. https://www.ecmwf.int/en/elibrary/17181-newsletter-no-151-spring-2017
Forrester, J. W. (1961). Industrial dynamics. MIT Press.
Intergovernmental Panel on Climate Change (IPCC). (2020). Future climate changes, risks and
impacts. https://ar5-syr.ipcc.ch/topic_futurechanges.php
International Energy Agency. (2015). Projected cost of generating electricity – 2015 edition.
https://www.oecd-nea.org/ndd/pubs/2015/7057-proj-costs-electricity-2015.pdf
National Business Initiative. (2016). South Africa’s Grid Emission Factor.
https://www.nbi.org.za/wp-content/uploads/2016/08/South-Africas-Grid-Emission-Factor-Mar-
13.pdf
Nordhaus, W. D. (2017). Revisiting the social cost of carbon. PNAS 11(7), 1518–1523.
https://www.pnas.org/content/114/7/1518
Numbeo. (2019). Cost of living in South Africa. https://www.numbeo.com/cost-of-
living/country_result.jsp?country=South+Africa

Sustainable Asset Valuation (SAVi) of Paterson Park’s Building Infrastructure l Page 30 of 36
Copernicus Climate Change Service

Peace Corps. (1976). Watering vegetables: When? How often? How much? In Soils, crops, and
fertilizer use. Peace Corps Information Collection & Exchange.
Ping, L. Z., & Chen, C. H. (2016). A study to compare the cost of operation and maintenance in
Green Building Index (GBI) and Non-Green Building Index (Non-GBI) rated building in Malaysia.
Presented at the 4th International Building Control Conference 2016 (IBCC 2016). MATEC Web
Conf, 66. https://doi.org/10.1051/matecconf/20166600028
Randburg Sun. (2017). How much water do you really use?
https://randburgsun.co.za/328517/how-much-water-do-you-really-
use/#:text=Since%20Johannesburg%20Water%20charges
Roberts, N., Andersen, D., Deal, R., Garet, M., & Shaffer, W. (1983). Introduction to computer
simulation. The system dynamics approach. Addison-Wesley.
The Economics of Ecosystems and Biodiversity. (2018). TEEB for agriculture & food: Scientific and
economic foundations. UN Environment. http://teebweb.org/wp-
content/uploads/2018/11/Foundations_Report_Final_October.pdf
United Nations Environment Programme (UNEP). (2014). Using models for green economy
policymaking. http://www.un-page.org/files/public/content-page/unep_models_ge_for_web.pdf
World Green Building Council. (2013). The business case for green building: A review of the costs
and benefits for developers, investors and occupants.
https://www.worldgbc.org/sites/default/files/Business_Case_For_Green_Building_Report_WEB_2
013-04-11-2.pdf
World Wildlife Fund. (2014). Green economy modelling of ecosystem services in the Dawna
Tenasserim Landscape (DTL) along the ‘Road to Dawei.’
http://d2ouvy59p0dg6k.cloudfront.net/downloads/final_greeneconomy_tnl_lr.pdf

Sustainable Asset Valuation (SAVi) of Paterson Park’s Building Infrastructure l Page 31 of 36
You can also read