Assessment of Concentration levels of contaminants in groundwater of Soutpansberg Region, Limpopo Province, South Africa
←
→
Page content transcription
If your browser does not render page correctly, please read the page content below
Assessment of Concentration levels of
contaminants in groundwater of Soutpansberg
Region, Limpopo Province, South Africa
Lindelani Lalumbe ( lindelanilalumbe@ymail.com )
Department of Water Affairs and Forestry: South Africa Department of Water and Sanitation
https://orcid.org/0000-0001-7842-205X
Thokozani Kanyerere
University of the Western Cape
Research Article
Keywords: Contaminants, Groundwater quality, Parachute research, Sustainable Development Goals.
Posted Date: June 7th, 2021
DOI: https://doi.org/10.21203/rs.3.rs-476038/v1
License: This work is licensed under a Creative Commons Attribution 4.0 International License.
Read Full License
Page 1/23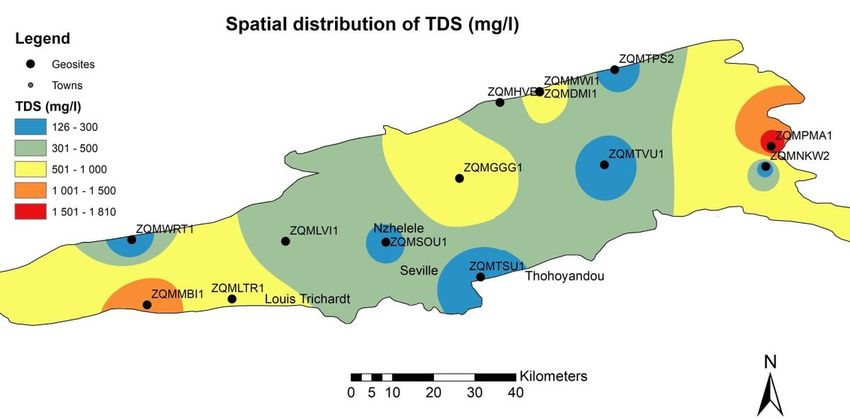
Abstract
Groundwater contribution towards improved food security and human health depend on the level of
contaminants in groundwater. In rural areas, many people use groundwater for drinking and irrigation
purposes without treatment and have no knowledge of contaminants levels in such waters. The reason
for such lack of treatment and knowledge is due to the parachute type of research which emphasizes on
scientific knowledge and records only and not sharing research outputs with communities for improved
human health and food security. This study argued that parachute research type exposes groundwater
users to health hazards and threaten food security. Concentration levels of contaminants were measured
to ascertain suitability of groundwater for drinking and irrigation use. 124 groundwater quality samples
from 12 boreholes and 2 springs with physiochemical data from 1995 to 2017 were assessed. This study
found high concentration levels of contaminants such F−, NO3−, Cl− and TDS in certain parts of the
studied area when compared to water quality standards. In general, groundwater was deemed suitable for
drinking purposes in most part of the studied area. Combined calculated values of SAR, Na%, MH, PI, RSC
and TDS determined that groundwater is suitable for irrigation purposes. The discussion in this paper
showed that scientific knowledge generated on groundwater quality should be shared with water users as
it will improved human health and food security and also enhance the achievement of Sustainable
Development Goals. This study recommended that skills and research outputs should be shared with
groundwater users through various initiatives.

1. Introduction
Availability of water in general is declining owing to climatic variation such as drought in arid and semi-
arid regions and increasing demand owing to socio-economic activities. Groundwater has become the
main or only source of freshwater for various activities such as irrigation and domestic uses across the
world (38, 27, 53, 20), and this is especially common in rural areas where there is lack or no alternative
water supply. Increasing reliance on groundwater can lead to other ecological factors such as decreasing
groundwater level, pollution and deterioration of water quality (24). Globally it is being reported that
groundwater that was considered fresh is increasingly being contaminated or polluted and this can have
a negative impact on the livelihood of vulnerable people relying on groundwater for various uses (43, 2).
There are various components that influence groundwater quality and determine the concentration levels
of contaminants in rural areas. These components include anthropogenic activities (irrigation and pit-
latrines), leaching, regional geology as well as climatic conditions (32, 26, 22, 52). For groundwater to
contribute towards food security and improved rural livelihood through irrigation and domestic use,
concentration levels of contaminants should be determine to ensure groundwater is suitable for various
uses. The challenge is that majority of groundwater users in many rural areas uses groundwater without
treatment or knowledge of the concentration level of contaminants; a situation which poses a huge threat
to food security, human health and their livelihoods. Understanding and communicating the
concentration levels of contaminants and groundwater quality in general is important as it ensure that
people use groundwater that is safe for consumption (36). Various researchers (29, 46, 28, 9, 31)

                                                  Page 2/23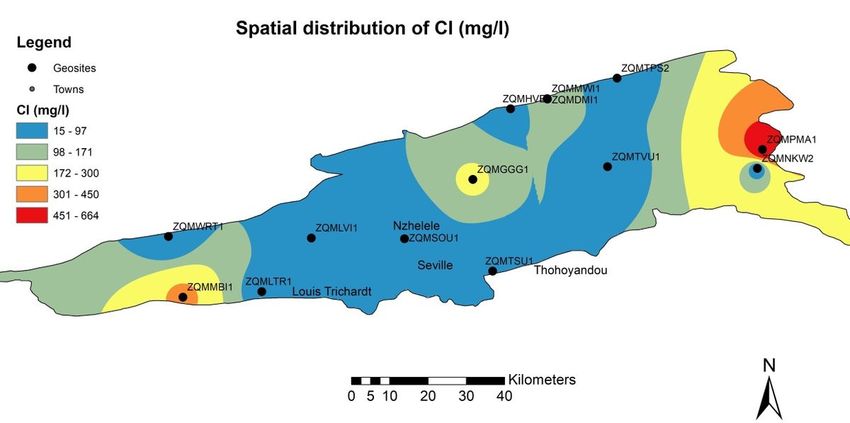
assessed groundwater quality data across the world to determine the suitability of groundwater for
human consumption. They evaluated major cations (Ca2+, Mg2+, Na+, K+) and anions (Cl−, HCO3−, F−).
These studies compared groundwater quality data with drinking water standards such as (51) and
various local standards such as (40) in South Africa. Suitability of groundwater for irrigation contributes
towards food security (17). Groundwater that is not suitable for irrigation may reduce crop yield and
damage soil structure (3). Studies conducted by (40, 28, 10, 35, 1, 16) assessed the suitability of
groundwater for irrigation purposes using methods such as SAR, PI, RSC, Na% and MH and found
contrasting results from methods applied. Contaminants are input of foreign and possibly toxic materials
into the environment and pollutants are described as substances that are anthropogenically introduced
that may be harmful to the environment (44). It is not simple to distinguish between contaminants and
pollutants as it is not always possible to define the concentration level where contaminants become
pollutants (44). However, it has become a norm with various authors to compare concentration levels of
contaminants in groundwater to various standards that are largely for surface water or drinking water in
order to determine if contaminants in groundwater are pollutants. This practice may be misleading as
some aquifers are highly concentrated in some contaminants in nature and not polluted; this study
tapped in the subject of comparing contaminants in groundwater to various international and local
standards. The purpose of this study was to determine the concentration levels of contaminants, spatial
distribution of contaminants and evaluate suitability of groundwater for domestic and irrigation purposes
using long-term data. This study also discussed the parachute type of research that does not share the
outputs and skills on groundwater quality with affected communities.

2. Description Of Study Location
The Soutpansberg region is located in the far Northern part of the Limpopo Province in South Africa
(Fig. 1). The total area of region is about 3099.6 km2 and lies between 250 to 1719 meters above mean
seal level. There are 12 boreholes and 2 springs that are part of the groundwater quality monitoring
programme in the area. In terms of groundwater level, 19 groundwater monitoring boreholes indicated
that groundwater level ranged from 1.5 to 36 meters below groundwater level. There are 994 registered
groundwater users with an allocation of 148.3 Mm3/a for various uses in the area. Although the study
focuses on groundwater, other main waterbodies includes rivers such as Sandsloot and Mutamba which
are located in the western side of the Soutpansberg region. In the central part there are rivers such as
Mutshedzi, Nzhelele and Nwanedi. Mutshindudi, Luvuvhu, Mutale, Mbodi and Shisha rivers are located in
the eastern side of the Soutpansberg region. There are also several dams in the Soutpansberg region
such as Nzhelele, Nwanedi, Mutshedzi and Vondo. Soutpansberg region covers Towns such as Louis
Trichardt, Makhado and Thohoyandou (Fig. 1). In terms of land cover in the Soutpansberg region, 27.5%
of the area is covered by woodlands, cultivated land covers about 25.5%, 25.3% is covered by bushland,
13% is covered with forest plantation, 7.4% is covered by residential/ built up area, water bodies covers
0.9% and 0.4% is covered by natural rocks and soils.

                                                  Page 3/23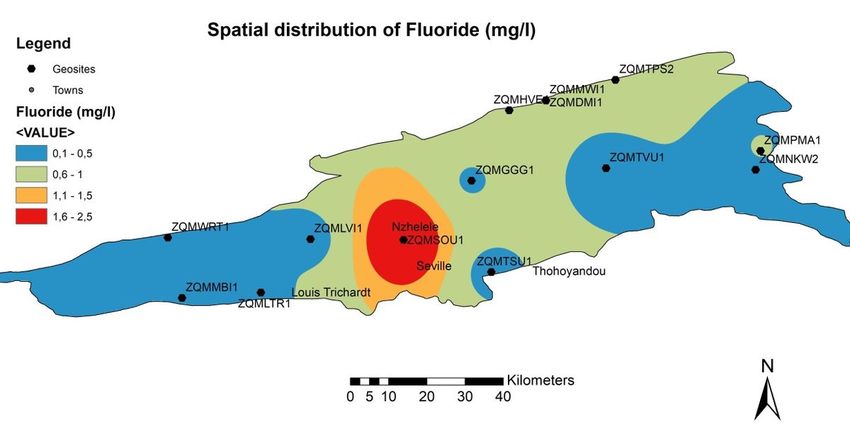
In terms of climatic condition, the area is located in an arid region with average minimum temperature of
11◦C and average maximum temperature of 32◦C based of the 7 South African Weather Services (SAWS)
station with data from 1980 to 2020. Soutpansberg region experience dry winter season (May- August)
and wet summer season (December- February) with the average precipitation of 497.7 mm/a. The
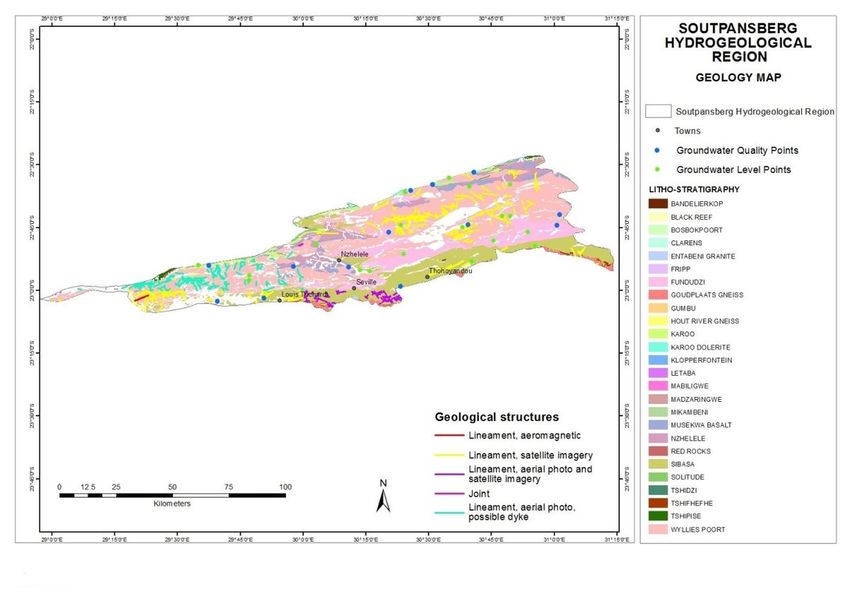
dominant geology that support groundwater is the volcanic-sedimentary unit of Soutpansberg Group
deposited as an east-west gravitating asymmetrical rift beside the palala shear belt about 1800 million
years ago (7, 8). The Soutpansberg basin was formed between the Limpopo belt in the north and the
Kaapvaal craton in the south. This volcanic-sedimentary Soutpansberg Group mainly outcrops in the
Soutpansberg Mountains stretching from Punda Maria at the eastern side to Vivo at the western side (11,
5). The Soutpansberg Group is subdivided into five Formations (Fig. 2) which are Tshifhefhe, Sibasa,
Fundudzi, Wyllie’s Poort and Nzhelele Formations (4).The dominant aquifer type in the Soutpansberg
region is the fractured aquifer with an average borehole yield ranging between 0 and 0.5 l/s. Some small
part of this fractured aquifer average borehole yield can reach 2 l/s. The southern part of the
Soutpansberg is underlain by the intergranular and fractured aquifer with average borehole yield between
0 and 0.2 l/s.
3. Material And Methods
3.1. Sampling
There is an active groundwater quality monitoring network in the study area. The network is comprised of
12 boreholes and 2 geothermal springs where sampling has been taking place since 1995 twice a year
(wet and dry seasons). The monitoring network was designed to monitor any influence on groundwater
resources in the Soutpansberg region. The monitoring points are spatially distributed in the Soutpansberg
region. To evaluate the concentration level of contaminants in groundwater, 124 samples of physio-
chemical parameters were analysed. These parameters include Magnesium (Mg2+), Calcium (Ca2+),
Sodium (Na+), Potassium (K+), Bicarbonate (HCO3−), Chloride (Cl−), Nitrate (NO3−) and Fluoride (F−).Total
dissolved solids (TDS) was calculated based on in-situ measurement of electrical conductivity (EC) using
Eq. 1 (48). In-situ measurements of pH and temperature were taken at each sampling point using a
handheld multi-parameter probe. Groundwater samples were collected using (48) methods where
samples were collected after purging the borehole until electrical conductivity (EC), pH, and Temperature
stabilized. Purging of the borehole is important as it allows a representation sample of the aquifer to be
collected. Groundwater from the spring was collected directly from the eye of the spring. 500 ml
polyethylene sampling bottles were used to collect groundwater. The samples between 1995 and 2017
(124 samples) were analysed at Department of Water and Sanitation laboratory using Inductively
Coupled Plasma Mass Spectrometry (ICP-MS) and the results were available as record review from the
Department of Water and Sanitation’s Water Management System database. To ensure that there are no
uncertainties with the data, ion balance error was determined to be between 0.0 and 9% which is lower
than allowable range of 10% (49).
Page 4/23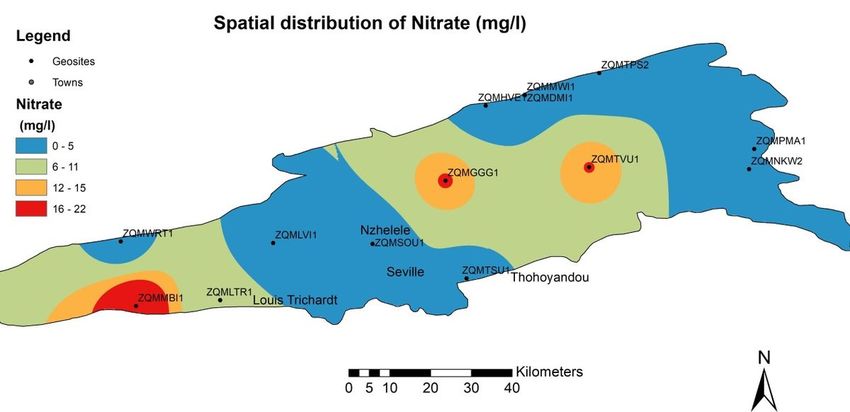
3.2. Determination of concentration levels of contaminants
The analysed 124 samples of major ions and physical parameters were statistically assessed using
Microsoft Excel in order to determine the concentration levels of contaminants in the Soutpansberg
region. The statistical analyses tool was used to determine the mean, minimum, maximum and standard
deviation of various contaminants. ArcGis tool was used to map the spatial distribution of the
concentration levels of contaminants. The determined concentration levels of contaminants in
groundwater were used to discuss the subject of comparing ambient groundwater quality to various
standards and sharing of outputs with concerned communities.

3.3. Evaluation of groundwater quality for domestic and
irrigation purposes
To evaluate suitability of groundwater for domestic use in the Soutpansberg region, 124 samples of
major ions and physical parameters were compared to (51, 40) drinking water standards. Suitability of
groundwater for irrigation purpose was evaluated by using equations 2–6 below. Sodium adsorption ratio
(SAR), sodium percentage (Na%), permeability index (PI), residual sodium carbonate (RSC) and
magnesium hazard (MH) were calculated in meq/l from the 124 samples. The subject of parachute
research and sharing of knowledge with groundwater users was discussed based on the outcome of
these methods.

SAR = (Na+)/ [√ (Ca2+ + Mg2+)/2]            (2)

Na% = [(Na+ + K+) / (Ca2+ + Mg2+ + Na+ + K+)]*100              (3)

PI = [(Na+ + HCO3−) / (Ca2+ + Mg2+ + Na+)] *100               (4)

MH= (Mg2+ x 100) / (Ca2+ + Mg2+)            (6)

4. Results And Discussion
4.1. Chemical composition of groundwater
The descriptive statistical analysis of chemical constituents of the 124 samples of the Soutpansberg
region is presented in Table 1. It is commonly accepted that pH is the primary parameter that is used to
measure water quality if it is acidic (pH < 7), Neutral (pH = 7) or alkaline (pH > 7) in nature (25).
Groundwater in the Soutpansberg region is slightly acidic to alkaline as pH ranges from 6.7 to 9.6. The
mean pH in groundwater of the area is 8.4 which indicate that groundwater is more alkaline (Table 1).
High alkalinity in the Soutpansberg area is linked with high concentrations of sodium, magnesium,
                                                  Page 5/23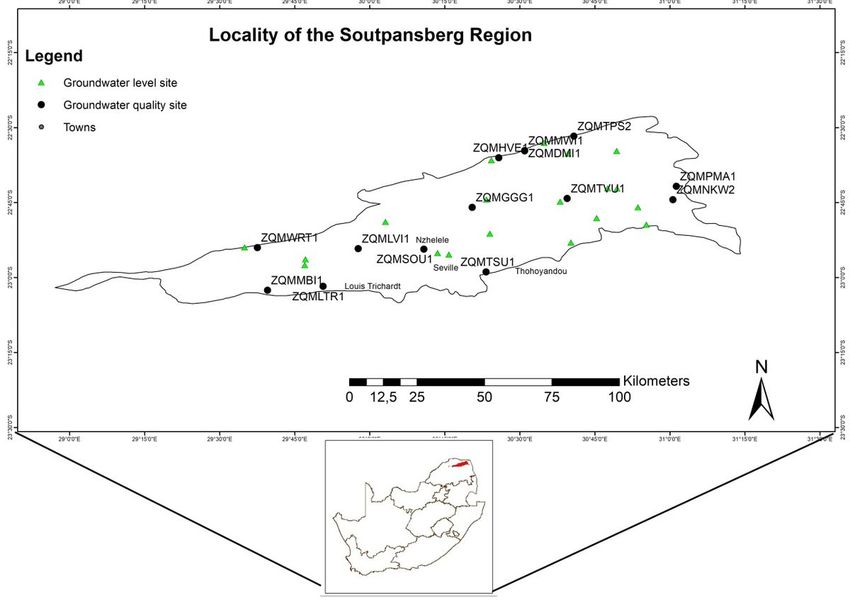
calcium and bicarbonates ions owing to the mafic-ultramafic igneous rocks dominant in the area. These
ions are commonly known to increase the value of pH (13). In terms of seasonal variation, there is no
much difference in pH between dry and wet season in the Soutpansberg region.

                                                    Table 1
                       Descriptive statistical analysis of physiochemical parameters
                       pH          TDS      Ca2+    Mg2+       Na+   K+    Cl−     HCO3−−     NO3−     F−

 Wet Season N = 29

 Min                   6,7         32       1       1          3     0,2   5       6          0,01     0,03

 Max                   9,4         1723     83      137        460   10    755     455        18,8     2,8

 Mean                  8,4         378      19      20         76    2     99      141        2,5      0,8

 SD                    1,4         969      43      74         246   5     408     231        10,2     1,4

 Dry Season N = 95

 Min                   7,1         82       1       1          3     1     7       5          0,01     0,03

 Max                   9,6         1808     99      154        415   10    646     612        37       2.9

 Mean                  8,4         372      23      24         61    2     68      178        4        0.7

 SD                    1,3         941      51      83         223   5     352     313        20       1.5

 All Season N = 124

 Mean                  8.4         372      22      23         65    2     75      170        4        0.7

 WHO (2011)            6,5–8,5     1000     200     100        200   12    250     500        10

 SANS 241 (2015)       5–9,7       1200     150     70         200   50    300                11       1,5

 *All units expressed in mg/l except pH; SD: standard deviation
Salinity as TDS in the region ranged from 32 to 1808 mg/l with mean of 327 mg/l. Spatial distribution of
TDS is presented in Fig. 3 where mean concentrations of 1418 and 1784 mg/l at Maebane and Punda
Maria villages were recorded respectively. Groundwater in these areas is considered to be brackish
according to TDS classification in Table 2 (18). There is a strong correlation between the spatial
distributions of Cl− and TDS (Fig. 3–4) in the Soutpansberg region and this suggest that salinity in
groundwater is high in the Maebane and Punda Maria villages as groundwater is classified as brackish.
There is a correlation between salinity and human settlements (including irrigated area) in the
Soutpansberg region and this observation is common as activities in such areas are associated various
types of anthropogenic factors such as fertilizers and pit-latrines. (34) Found that spatial variation of
groundwater quality correlate with agricultural activities. Seasonal variation does not affect salinity in the
area as there is no difference between wet (378 mg/l) and dry (372 mg/l) season mean TDS. In general,
91.1% of groundwater is the Soutpansberg region is classified as fresh and 8.9% is classified as brackish
                                                   Page 6/23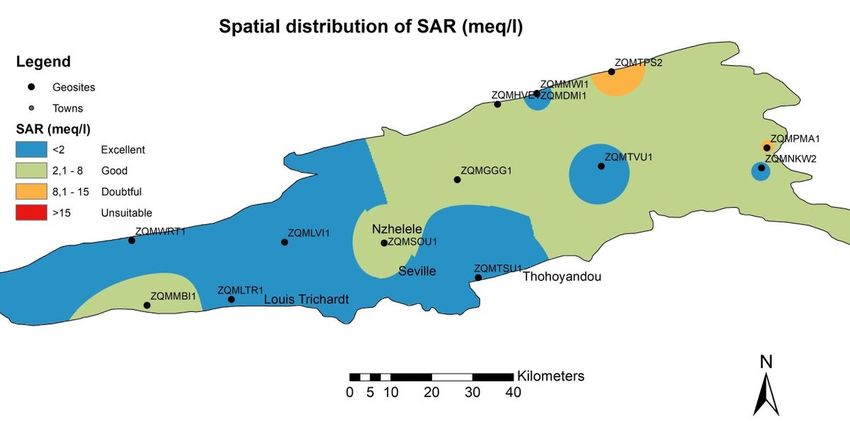
(Table 2). Classification of groundwater for TDS in this study is similar to (28) who determined that
groundwater in the Soutpansberg region is fresh to brackish.

                                                    Table 2
                              Classification of groundwater based on TDS (18)
                         Classification     TDS (mg/l) range      No. of samples (%)

                         Fresh              < 1000                113 (91.1%)

                         Brackish           1000-10,000           11 (8.9%)

                         Saline             10,000-100,000        0

                         Brine              > 100,000             0
The concentration levels of various contaminants are presented in Table 1, where cation dominance order
was Na+ > Mg2+ > Ca2+ > K+ and anions was HCO3− > Cl− > NO3− > F−. HCO3− concentration in
groundwater ranged from 5 to 612 mg/l with mean of 170 mg/l. in terms of seasonal variation, mean
HCO3− concentration of 141 and 178 mg/l were recorded in wet and dry seasons respectively indicating
that seasonal variation impact is minimal. Majority of samples and mean concentration of HCO3− is
within the (51, 40) standards (in the absence of groundwater quality standards). Concentration levels of
Cl− ranged from 5 to 755 mg/l with mean of 75 mg/l. Spatial distribution of mean Cl− concentration in
groundwater of the Soutpansberg region indicate that it is highly concentrated where TDS concentrations
are high (Fig. 4). Mean concentration of Cl− in groundwater is slightly higher in the wet season (99 mg/l)
compared to dry season (68 mg/l). NO3− concentration levels in groundwater of the area ranged between
0.01 and 37 mg/l with mean of 4 mg/l. NO3− is highly concentrated in villages such as Maebane (22.3
mg/l), Gogogo (15 mg/l) and Tshitavha Sambandou (15 mg/l) as presented in Fig. 5. A study by (1)
found that NO3− was 8.8 times than the recommended limit and stated NO3− occurrence and distribution
in groundwater is mostly associated with application of fertilizers, leakage from septic tanks/ sewage
and leachate from landfill sites. In the Soutpansberg area, high NO3− can be associated with leaching
from pit-latrines and application of fertilizers in this fractured aquifer. There is no major difference in
mean NO3− concentration in groundwater between wet (2.5 mg/l) and dry (4 mg/l) seasons. NO3−
concentration is slightly higher in dry season as compared to wet season. Spatial distribution of F− is
presented in Fig. 6 where it is highly concentrated around Nzhelele area with a mean of 2.5 mg/l. The
mean concentration level of F− in Nzhelele area is over the prescribed limit of 1.5 mg/l (51, 40).
Groundwater from the geothermal spring in Nzhelele is highly concentrated with F−. The range of F−
concentration levels in groundwater of the Soutpansberg region was determined to be from 0.03 to 2.9
mg/l and overall mean of 0.7 mg/l. Seasonal variation doesn’t have any impact on F− concentration of
groundwater as geothermal springs are associated with deep ancient groundwater. The determined
concentration of F− correlates with the findings of (33) that F− in Nzhelele (Siloam) area ranges between
1.7 to 5.6 mg/l in dry and wet seasons. The source of F− in groundwater in this area result from fluorite
mineral associated with sedimentary and igneous rocks that are found in the Soutpansberg area (33).
                                                     Page 7/23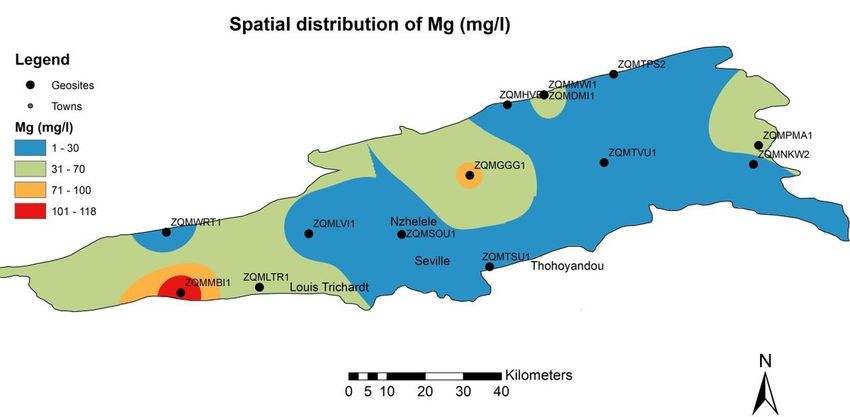
In the absence of defined groundwater quality guidelines, majority of samples contains cations
concentration levels that are within the (51, 40) prescribed limits for drinking water. High concentration
levels of various parameters does not necessary mean the aquifer is polluted as it could be the natural
ambient groundwater. Mean wet and dry season’s concentration levels of cations are below the
prescribed limit (Table 1). Cations concentrations level in groundwater of the Soutpansberg region are not
influenced or affected by seasonal variations as there is no major difference in concentration levels
between wet and dry season samples. Concentration level of Na+ being the dominant cation ranged from
3 to 440 mg/l with mean concentration of 65 mg/l. Na+ concentration is slightly higher in wet season (76
mg/l) than dry season (61 mg/l). Na+ is highly concentrated in Maebane and Punda Maria where
concentrations of TDS and Cl− are high. Salinity in groundwater seems to be a problem in these areas
due to high concentration of TDS, Cl− and Na+. Salinity in Maebane and Punda Maria settlements is high
in all seasons. Mg2+ concentration levels in groundwater ranged from 1 to 154 mg/l with mean of 23
mg/l. The spatial distribution of Mg2+ concentration in groundwater is presented on Fig. 7 where it is
highly concentrated in the Maebane and Gogogo villages. Mean Mg2+ concentration levels of 77 and 118
mg/l were determined in Gogogo and Maebane villages respectively and these concentration levels are
above the prescribed limit of 70 mg/l (51, 40). Concentration levels of Ca2+ in groundwater of the
Soutpansberg region ranged from 1 to 99 mg/l with mean of 22 mg/l. in terms of seasonal variation,
mean Ca2+ concentration level of 19 and 23 mg/l were recorded in wet and dry seasons respectively.
Concentration levels of K+ as the least dominance cation ranged from 0.2 to 10 mg/l with mean of 2
mg/l, which is within the prescribed limit (51, 40). Comparing ambient groundwater with standards
designed largely for surface and treated water such as (40) can be misleading as it may be perceived as
groundwater resource is polluted. For instance, TDS in Maebane area has been over 1500 mg/l since
1994 and steady at that concentration level for over 22 years. Some contaminants in groundwater are
naturally high owing to the geochemistry and geological setting of the host aquifer so there is need to
develop groundwater quality standards guided by historical data and geochemistry of aquifers. In cases
where anthropogenic activities are determined to be contaminating groundwater resource, sharing of
concentration levels of contaminants and research outcomes can assist the community to manage and
protect the resource. Enhanced management and protection of groundwater resource between
communities and custodian of the resource will help countries to achieve United Nation’s Sustainable
Development Goal (SDG) 6 and this will improve water quality and provide clean water and sanitation for
all.

4.2. Suitability of groundwater for drinking purposes
Groundwater should be free from pathogens and toxic chemicals in order to be deemed suitable for
domestic use such as cooking and drinking (28). Concentrations of various parameters from the 124
samples were compared with (51, 40) in Table 1. These samples were also compared to TDS
classifications by (18) in Table 2 and (12) in Table 3. In terms of seasonal variations, 62.1% of wet
season samples were suitable for drinking purposes. 74.7% of samples taken in dry season were suitable
for drinking purposes in the Soutpansberg area. Even though there is no major difference in concentration

                                                 Page 8/23
levels, groundwater seems to be more suitable for drinking purposes in dry season. This could be
associated with lack of mechanism to enhance leaching/ transport contaminants in dry season. Overall,
groundwater in 73.4% of the samples was deemed suitable for drinking purposed as all parameters were
within the prescribed limit (51, 40). This outcome is in contrast with (28) study that determined that
groundwater in the Soutpansberg is not suitable for drinking and domestic purposes. However, the
contrast can be associated with the spatial distribution of monitored samples, number of samples and
time frame as (28) analysed 15 samples in 2011 from a small portion of the Soutpansberg, and 124
spatial distributed samples were used in this study with data of 22 years. According to Department of
Water and Sanitation Water Authorization and Registration Management System (WARMS), 3.7 Mm3/a
of groundwater has been allocated for drinking purposes in the Soutpansberg region. This can become a
challenge as groundwater in 26.6% (37.9% and 25.3% in wet and dry seasons respectively) of the
samples were deemed not suitable for drinking purposes due to high concentrations of F−, NO3−, Mg2+
and salinity (TDS and Cl−) in areas such as Maebane, Punda Maria, Tshitavha Sambandou, Gogogo,
Nzhelele and surrounding villages as presented in Fig. 3–7. These contaminants are high in
boreholes/springs in residential settlements and irrigated areas. Majority of groundwater users in the
Soutpansberg region are most likely not aware of the type of groundwater they are drinking on a daily
basis. It is basic human rights and need to drink safe water to ensure good health (23). (50) Estimated
that almost 80% of diseases are resulting from polluted water and poor sanitation and this could be the
case in the rural villages of the Soutpansberg region due to continuous consumption of polluted
groundwater. For instance, concentration of TDS in Punda Maria (ZQMPMA1) and Maebane (ZQMMBI1)
areas were recorded at 1784 mg/l and 1418 mg/l respectively and water with elevated dissolved solids
may affect individual suffering from heart and kidney diseases as well as causing constipation and
laxative effects (41). NO3- as one of the common disease causing contaminants can expose infants to
baby blue syndrome (51, 30). F− which is highly concentrated in Nzhelele area (Siloam) can cause dental
fluorosis according to (51). A study by (33) found that of the 87% households that use groundwater for
drinking purposes, 85% of the members already have mottled teeth/ dental fluorosis. Based on TDS
classification by (18), 91.1% of the samples were classified as fresh water type and 8.9% of the samples
were classified as brackish (Table 2). Classification of TDS by (12) indicated that 72.6% of groundwater
samples were desirable for drinking purpose. 18.5% of groundwater samples in the Soutpansberg region
were permissible for drinking purposes. Only 8.9% of the samples were not suitable for drinking purposes
(Table 3). The main challenge is how the status of groundwater with respect to suitability for drinking
purposes can be shared with groundwater users. Communicating with users that groundwater is not
suitable for drinking purposes without treatment will protect them from possible water borne diseases,
improving their health and livelihood. For instance, rainfall and temperature are forecasted by weather
services globally as an early warning system and shared on various digital and print media. Perhaps
groundwater custodians should start sharing groundwater quality status with groundwater users through
various digital and print platforms and also with traditional authorities in rural areas. Sharing of
groundwater quality status with communities relying on groundwater for drinking purposes will improve
their health and livelihood as proper actions can be taken before consumption. Sharing the reasons why
groundwater is not suitable for drinking purposes with water users will decrease water-borne diseases
Page 9/23around the world as users will be aware. The situation discussed by (33) where 85% of groundwater users
had dental fluorosis in Siloam can be avoided by sharing research outcome with users while also
accelerating the achievement of SDG 3 dealing with good health and well-being.
Table 3
Groundwater classification based on TDS (12)
TDS (mg/l) Classification No. of samples (%)
< 500 Desirable for drinking 90 (72.6%)
500–1000 Permissible for drinking 23 (18.5%)
1000–3000 Useful for irrigation 11 (8.9%)
> 3000 Unfit for drinking and irrigation 0
4.3. Suitability of groundwater for irrigation purposes
High concentration of salt in irrigation water can increase solution osmotic pressure and can also
negatively affect the structure of soils, aeration and permeability rate (47, 21). Suitability of groundwater
of the Soutpansberg region for irrigation was assessed by estimating a number of parameters such as
Na%, SAR, MH, PI, RSC (Table 4) and TDS (Table 3). The major ions used were expressed in
milliequivalents per litre (meq/l).
Page 10/23Table 4
Classification of groundwater samples for suitability for irrigation
Parameter Range Water class No. of samples (%)
Na% < 20 Excellent 4 3,2
20–40 Good 42 33,9
40–60 Permissible 43 34,7
60–80 Doubtful 6 4,8
> 80 Unsuitable 29 23,4
SAR (meq/l) 15 Unsuitable 1 0,8
MH (%) < 50 Suitable 30 24,2
> 50 Unsuitable 94 75,8
PI (%) Class I (> 75) Good 3 2.4
Class II (75 − 50) Permissible 106 85.5
Class III (< 25) Unsuitable 15 12.1
RSC (meq/l) < 2,5 Suitable 124 100
> 2,5 Unsuitable 0 0
4.3.1. Alkali and salinity hazard (SAR)
Sodium adsorption ration (SAR) is useful in determining suitability of groundwater for irrigation purpose
as it measures both sodium and alkali hazards for plants (3). High concentration of sodium in irrigation
water may have harmful effects in most soils such as increased hardness and reduced permeability (6).
High concentration of bicarbonate and relatively low calcium is also hazardous for irrigation water (39).
High content of sodium relative to calcium and magnesium may cause sodicity in irrigation water. SAR
calculations (Eq. 2) in the Soutpansberg region indicated that 75% of the samples were classified as
excellent -good for irrigation purposes (Table 4). 24.2% of the samples were doubtful and 0.8% of the
samples were unsuitable for irrigation purposes. Groundwater from Tshipise (geothermal spring) and
Punda Maria were doubtful for irrigation purposes as presented in Fig. 8. Samples that are unsuitable for
irrigation purposes (0.8%) are from Tshipise geothermal spring (ZQMTPS2) where the low mean
concentrations of Ca2+ (2 mg/l) and Mg2+ in relation to Na+ (66 mg/l) are responsible for the unsuitability
of groundwater for irrigation purpose as low calcium is hazardous for irrigation (39). Similar to suitability
of drinking status, the communities and farmers that are using groundwater for irrigation purposes are
Page 11/23deprived of this information as most researchers and custodians of water are publishing research
outputs and not share with communities affected and this can have a negative impact of livelihood and
food security in general.
4.3.2. Sodium percentage (Na%)
Concentration of sodium in groundwater is important in the classification of irrigation water. Na% was
calculated using Eq. 3 and results are presented in Table 4. Majority of the groundwater samples in the
study area were classified as excellent (3.2%), good (33.9%) and permissible (34.7%) for irrigation
purposes. Na% over 60 can cause destruction of the structures of the soil and negatively affects the
growth of plants (6). In the Soutpansberg region, 4.8% of the samples were doubtful (Na%= 60–80) and
23.4% (Na% >80) were unsuitable for irrigation purposes. Samples with Na% > 80 contains very low
concentration of Ca2+ (< 3 mg/l) and this is hazardous for irrigation water according to (39). Groundwater
from the Tshipise geothermal spring is not suitable for irrigation purposes due to low Ca2+ concentration.
4.3.3. Magnesium hazard (MH)
Magnesium in groundwater influence the quality of soil by converting it into alkaline and reduces crop
yield (19). Magnesium hazard was calculated using Eq. 6 as proposed by (45). MH above 50 is deemed
to be unsuitable for irrigation purposes. Groundwater in 75.8% of the samples was unsuitable for
irrigation as MH was calculated to be over 50 (Table 4). The unsuitability of groundwater based on MH is
a concerning issues as 125.4 Mm3/a has been allocated for irrigation use in the Soutpansberg region.
MH in groundwater was below 50 in 24.2% the samples of which most of them are from Tshipise
(geothermal spring: ZQMTPS2). Samples that are not suitable for irrigation purposes based on MH is
resulting from Ca2+ > Mg2+ ratio. Therefore, groundwater in most part of the Soutpansberg region is not
suitable for irrigation purpose based on magnesium hazard. To ensure food security, this information
should be shared with the farming community and everyone using groundwater for irrigation purposes.
Various digital and media platforms can be used to share the status of groundwater for irrigation uses so
precautions can be taken before irrigating.
4.3.4. Permeability Index (PI)
Permeability index is based on Eq. 4 and is used to classify irrigation water as proposed by (14). Water
from class I (PI > 75) and class II (PI 75 − 25) is considered to be suitable for irrigation while class III is
considered to be unsuitable for irrigation. The PI results from the study area are tabulated in Table 4
where 2.4% of the samples are good (Class I) and 85.5% of the samples are permissible (Class II) for
irrigation purpose. Only 12.1% of the samples were not suitable (Class III, PI < 25) resulting from high
concentration of HCO3− and relatively low Ca2+ concentration in groundwater is this is hazardous for
irrigation water (39).
4.3.5. Residual sodium carbonate (RSC)
High concentration of carbonate and bicarbonate ions relative to calcium and magnesium (alkaline
earth) can result in the complete precipitation of calcium and magnesium (37). Residual sodium
Page 12/23carbonate (RSC) calculated using Eq. 5 has been measured in the Soutpansberg region in order to
understand the effect of bicarbonate and carbonate of groundwater. High RSC value in water results in an
increase of adsorption of sodium in soil (15). Water with RSC less than 2.5 is considered as suitable for
irrigation purposes. All 124 groundwater samples were suitable for irrigation purpose as RSC was less
than 2.5 (Table 4).
4.3.6. Total dissolved solids (TDS)
Suitability of groundwater for irrigation can be determined by using (12) TDS classification (Table 3).
Irrigation water with TDS less than 3000 mg/l is considered suitable/useful for irrigation purposes. TDS
concentration levels in groundwater ranged from 32 to 1808 mg/l which is within the useful for irrigation
limit. Therefore, groundwater in the Soutpansberg region is suitable for irrigation based on TDS.
5. Conclusions
Groundwater in the Soutpansberg region is slightly acidic to alkaline and classified as fresh to brackish in
nature. Concentration levels of parameters such as F−, NO3−, Cl− and TDS were high and above the
prescribed limit in various areas and villages in the study area. Seasonal variation does not influence the
concentration levels of parameters identified as there is no significant difference in both wet and dry
season samples. There is correlation between high concentration levels of contaminants such as NO3−
and TDS and human settlements areas. Concentration levels of these contaminants are high in
settlements such as Gogogo, Maebane, Nzhelele, Punda Maria and Tshitavha Sambandou where
groundwater is not suitable for drinking purposes. Overall groundwater is suitable for drinking purposes
in most part of the Soutpansberg region based on physiochemical analysis. Various methods used to
determine suitability of groundwater for irrigation purposes gave contrasting results. TDS, Na%, SAR, PI
and RSC determined that groundwater is suitable for irrigation purposes. MH determined that
groundwater is not suitable for irrigation purposes due to low Ca2+ in groundwater. Considering all
methods combined, groundwater seems suitable for irrigation purposes in the Soutpansberg region.
Presence of contaminants such as F−, NO3− and salinity in groundwater poses a health risk to the
communities using groundwater for drinking purposes without any form of treatment. To ensure food
security, improved health and livelihood, this study recommends that the status of groundwater quality in
relation to suitability for drinking and irrigation purposes should be shared on digital, print media and if
possible to community leaders by researchers and custodians of groundwater. Sharing of information
with affected community is important as it will stop the parachute type of research where researchers
collect data, analyse and publish without informing affected communities of the hazards associated with
groundwater in specific areas. Various Sustainable Development Goals can be accelerated and achieved
by sharing research outcomes with water users. There is also a need to develop groundwater quality
guidelines for various aquifers to avoid comparing groundwater quality with treated water standards
when measuring concentration level between contaminants and pollutants. This study further
recommends that there is a need to determine hydro-geochemical influencing groundwater quality in the
Soutpansberg region. There is also a need to monitor groundwater for biological parameters in the area
Page 13/23due to excessive usage of pit-latrines and livestock farming. Consequently, proper management of
groundwater and remediation should be considered before utilizing groundwater for drinking purposes.
Declarations
Acknowledgments: This paper is a part of the Ph.D project of the corresponding author. The authors
gratefully acknowledge the Department of Water and Sanitation (DWS) and South Africa Weather
Services (SAWS) for assistance with historical data.
Funding: N/A
Conflicts of Interest: The authors declare no conflict of interest.
Author Contributions: LL was responsible for data collection, data analysis and drafting the manuscript.
TK was responsible for conceptualisation of the research problem, interpretation of the results and
reviewing of the manuscripts. TK is the academic supervisor of the corresponding author.
Availability of data and material (data transparency): The data used to support the outcomes of this
study have been included within the supplementary material.
Code availability (software application or custom code): N/A
References
1. Adimalla, N. & Taloor, A.J. 2019. Hydrogeochemical investigation of groundwater quality in the hard
rock terrain of South India using Geographic Information System (GIS) and groundwater quality
index (GWQI) techniques. Groundwater for Sustainable Development, 10.
https://doi.org/10.1016/j.gsd.2019.10028
2. Aladejana, J.A., Kalin, R.M., Sentenac, P. & Hassan, I. 2020. Assessing the impact of climate change
on groundwater quality of the shallow coastal aquifers of Eastern Dahomey Basin, Southwestern
Nigeria. Jour. water. 2020, 12, 224. Pp. 1-19. https://doi.org/10.3390/w12010224
3. Badana, N., Vetrimurugan, E. & Natarajan, R. 2018. Coastal aquifer contamination and geochemical
processes evaluation in Tugela catchment, South Africa-geochemical and statistical approaches.
Water 10(6): 687. https://doi.org/10.3390/w10060687
4. Barker, O.B. 1983. A proposed geotectonic model for the Soutpansberg Group within the Limpopo
Mobile Belt, South Africa. Special Publication geological Society South Africa. 8: 181-190.
5. Barton Jr, J.M. & Pretorius, W. 1997. Soutpansberg age (1.85 Ga) magmatism and metallogenesis in
southern Africa: a result of regional rifting. Abstract: International Symposium on plumes, plates and
mineralisation. University of Pretoria, Pretoria, South Africa.
6. Bhat, M.A., Wani, A.S., Vijay, K., Jyotirmaya, S. & Dinesh, T. 2018. An overview of the assessment of
groundwater quality for irrigation. J. Agric. Sci. Food. Res. 9: 209.
Page 14/237. Brandl, G. 1987. The geology of the Tzaneen area. Explanation sheet geological Survey South Africa.
2330: 55.
8. Brandl, G. 1999. Soutpansberg Group: Catalogue of South African Lithostratigraphic units. SA
Committee for stratigraphy. Council for Geoscience. 6: 39-41.
9. Brhane, G.K. 2018. Characterization of hydro chemistry and groundwater quality evaluation for
drinking purpose in Adigrat area, Tigray, Northern Ethiopia. Water Science 32 (2018): 213-229.
10. Chande, M.M. & Mayo, A.W. 2019. Assessment of groundwater vulnerability and water quality of
Ngwerere sub-catchment urban aquifer in Lusaka, Zambia. Physics and Chemistry of the Earth. 112:
113-124. https://doi.org/10.1016/j.pce.2019.03.004
11. Cheney, E.S., Barton, J.M. & Brandl, G. 1990. Extent and age of the Soutpansberg sequences of
southern Africa. South African Journal of Geology. 93: 664-675.
12. Davis, S.N. & DeWiest, R.J. 1966. Hydrogeology. Wiley, New York.
13. Deshpande, S.M. & Aher, K.R. 2012. Evaluation of groundwater quality and its suitability for drinking
and agriculture use in parts of Vaijapur, District Aurangabad, MS, India. Res. J. Chem. Sci. 2(1): 25-
31.
14. Doneen, L.D. 1964. Water quality for agriculture. Department of irrigation, University of Carlifonia.
15. Eaton, F.M. 1950. Significance of Carbonates in irrigation waters. Soil Science. 69 (2): 123-134.
16. Egbueri, J.C. 2020. Groundwater quality assessment using pollution index of groundwater (PIG),
ecological risk index (ERI) and hierarchical cluster analysis (HCA): a case study. Groundwater for
Sustainable Development. 10 (100292).
17. Eyinla, D.S. and Oladunjoye, M. A. 2014. Improving quality agricultural practices in tropical
environments through integrated geophysical methods. IOSR. J. Appl. Geol. Geophys (IOSR-JAGG).
2(5): 128-139.
18. Freeze, R.A. and Cherry, J.A. 1979. Groundwater. Prentice-Hall, Englewood cliffs.
19. Gowd, S.S. 2005. Assessment of groundwater quality for drinking and irrigation purpose: a case
study of Pedavanka Watershed. Anantapur District, Andhra Pradesh, India. Environmental Geology.
48: 702-712.
20. He, X., Li, P., Ji, Y., Wang, Y., Su, Z. & Elumalai, V. 2020. Groundwater arsenic and fluoride and
associated arsenicosis and fluorosis in China: occurrence, distribution and management. Expo
Health. https://doi.org/10.1007/s12403-020-00347-8
21. Hussain, M. & Rao, D.P. 2013. Assessment of the ground water quality and its suitability for drinking
and irrigation purposes: a case study of Patancheru, Andhra Pradesh, India. Arch. Appl. Sci. Res.
5(6): 232-238.
22. Hwang, J.Y., Park, S., Kim, H.K., Kim, M.S., Jo, H.J., Kim, J.I., Lee, G.M., Shin, I.K. & Kim, T.S. 2017.
Hydrochemistry for the assessment of groundwater quality in Korea. J. Agric. Chem. Environ. 6: 1-29.
https://doi.org/10.4236/jacen.2017.61001
Page 15/2323. Jackson, R.B., Carpenter, S.R., Dahm, C.N., McKnight, D.M., Naiman, R.J., Postel, S.L., & Running, S.W.
2001. Water in changing world, issues in Ecology. Ecol. Soc. Am, Washington, 1-16.
24. Jalees, M.I., Farooq, M.U. & Anis, M. 2020. Hydrochemistry modelling: evaluation of groundwater
quality deterioration due to anthropogenic activities in Lahore, Pakistan. Environ. Dev. Sustain
(2020).
25. Kokkat, A., Jegathambal, P. & James, E.J. 2016. Spatial and temporal variation in groundwater
quality and impact on sea water in the Cauvery delta, South India. Int. J. Earth. Sci. 9(3): 383-392.
26. Li, P., Wu, J. & Qian, H. 2016. Hydrochemical appraisal of groundwater quality for drinking and
irrigation purposes and the major influence factors: a case study in and around Hua County, China.
Arab. J. Geosci. 9(1): 15. https://doi.org/10.1007/s12517-015-2059-1
27. Li, P., He, S., Yang, N. & Xiang, G. 2018. Groundwater quality assessment for domestic and
agricultural purposes in Yan’an City, northwest China: Implications to sustainable groundwater
management on the Loess Plateau. Environ. Earth. Sci. 77 (23): 775.
https://doi.org/10.1007/s12665-018-7968-3
28. Malaza, N. 2017. Hydrogeochemical assessment of groundwater quality in the Soutpansberg basin
around Tshikondeni, Limpopo Province, South Africa. Geochemistry: Exploration, Environment,
Analysis, 17(1): 35-41. https://doi.org/10.1144/geochem2016-433
29. Mangoua, M.J., Gone, D.L., Kouassi, K.A., N’guettia, K.G., Douagui, G.A., Savane, I. & Biemi, J. 2015.
Hydrogeochmical assessment of groundwater quality in the Baya watershed (Eastern of Cote
d’Ivoire). Afri. J. Agric. Res. Vol.10 (49): 4477-4489. https://doi:10.5897/AJAR2015.10212
30. Meride, Y., & Ayenew, B. 2016. Drinking water quality assessment and its effects on residents health
in Wondo genet campus, Ethiopia. Environ. Syst. Res, Vol. 5:1. https://doi:10.1186/s40068-016-0053-
6
31. Mokoena, P., Kanyerere, T. & van Bever Donker, J. 2020. Hydrogeochemical characteristics and
evaluation of groundwater quality for domestic and irrigation purposes: a case study of the
Heuningnes Catchment, Western Cape Province, South Africa. Applied. Sci. (2020) 2: 1548.
https://doi.org/10.1007/s42452-020-03339-0
32. Napacho, A., & Manyele, V. 2010. Quality assessment of drinking water in Temeke district (Part II):
characterization of chemical parameters. Af. J. Environ. Sci. Technol, Vol. 4 (11): 775-789.
33. Odiyo, J.O., and Makungo, R. 2012. Fluoride concentrations in groundwater and impact on human
health in Siloam Village, Limpopo Province, South Africa. Water SA, Vol. 38 (5): 731-736.
https://dx.doi.org//0.4314/wsa.v38i5.12
34. Odiyo, J.O., Makungo, R., and Muhlari, T.G. 2014. The impacts of geochemistry and agricultural
activities on groundwater quality in the Soutpansberg fractured aquifer. WIT Transaction on Ecology
and The Environment, Vol 182: 121-132. https://doi:10.2495/WP140111
35. Papazotos, P., Koumantakis, I., & Vasileiou, E. 2019. Hydrogeochemical assessment and suitability of
groundwater in a typical Mediterranean coastal area: a case study of the Marathon basin, NE Attica,
Greece. Hydro Research. 2: 49-59. https://doi.org/10.1016/j.hydres.2019.11.002
Page 16/2336. Prasanna, M.v., Chidambaram, S., Gireesh, T.V., Jabir Ali, T.V. 2010. A study on hydrochemical
characteristics of surface and subsurface water in and around Perumal Lake, Cuddalore District,
Tamilnadu, South India. Environ. Earth. Sci. https://doi.org/10.1007/s12665-010-0664-6
37. Raghunath, H.M. 2000. Ground Water Hydrology. Wiley Eastern Ltd. Second reprint.
38. Raheli-Namin, S., Mortazavi, M., Mobinifar, M.A. 2016. Groundwater quality probability mapping and
assessment for domestic and irrigation purposes in Ghara-Su Basin of Golestan Province, Iran. J.
Mater. Environ. Sci. 7 (1): 259-271.
39. Richards, L.A. 1954. Diagnosis and improvement of saline and alkali soils. US Department of
Agriculture, Hand Book 60.
40. SABS (South African Bureau of Standards). 2015. South African National Standard 241-1: 2015
Drinking water, Part 1: Microbiological, Physical, aesthetic and chemical determinands. 241-2: 2015
drinking water, Part 2: Application of SANS 241-1. SABS, Pretoria.
41. Sasikaram, S., Sritharan, K., Balakumar, S., & Arasaratnam, V. 2012. Physical, chemical and microbial
analysis of bottled drinking water. J. Ceylon Medical, 57 (3), 775-789.
42. Sefie, A., Aris, A.A., Shamsuddin, M.K.Z., Tawnie, I., Suratman, S., Idris, A.N., Saadudin, B.S., and
Ahmad, W.K. 2015. Hydrogeochemistry of groundwater from different aquifer in Lower Kelantan
Basin, Kelantan, Malaysia. Proced. Environ. Sci. 30: 151-156.
43. Selvakumar, S., Chandrasekar, N., and Kumar, G. 2017. Hydrogeochemical characteristics and
groundwater contamination in the rapid urban development areas of Combatore, India. Water
resources and urban industry journal, 17 (2017) 26-33.
44. Stengel, D.B., O’Reilly, S., and O’Halloran, J. 2006. In Davenport, J., and Davenport, J.L (eds). The
Ecology of Transportation: Managing mobility for the Environment. Environmental Pollution, Vol 10.
Springer, Dordrecht. https://doi.org/10.1007/1-4020-4504-2_15
45. Szaboles, I. and Darab, C. 1964. The influence of irrigation water of high sodium carbonate content
of soils. Proceedings of 8th ISSS, Transaction. 2: 802-812.
46. Taiwo, A.M., Towolawi, A.T., Olanigan, A.A., Olujimi, O.O., and Arowolo, T.A. 2015. Comparative
assessment of groundwater quality in rural and urban areas of Nigeria. Research and Practices in
Water Quality: 179-191. https://dx.doi.org/10.5772/59669
47. Thorne, D.W. & Peterson, H.B. 1954. Irrigated Soils. Constable and Company, London, UK.
48. Weaver, J.M.C., Cave, L. & Talma, A.S. 2007. Groundwater sampling, 2nd edn. WRC Report No.
TT303/07. Water Research Commission, Pretoria.
49. Weight, W.D. 2008. Hydrogeology field manual, 2nd edn. McGraw-Hill Companies Inc, New York.
50. WHO. 1997. Basic Environmental Health, Geneva.
51. WHO. 2011. Guidelines or Drinking-water quality. 4th edition, World Health Organization, Geneva.
52. Wu, J., Wang, L., Wang, S., Tian, R., Xue, C., Feng, W., Li, Y. 2017. Spatiotemporal variation of
groundwater quality in an arid area experiencing long-term paper wastewater irrigation, northwest
China. Environ. Earth. Sci. 76(13): 460. https://doi.org/10.1007/s12665-017-6787-2
Page 17/2353. Wu, J., Zhou, H., He, S., Zhong, Y. 2019. Comprehensive understanding of groundwater quality for
domestic and agricultural purposes in terms of health risks in a coal mine area of the Ordos basin,
north of the Chinese Loess Plateau. Earth. Sci. 78(15): 446. https://doi.org/10.1007/s12665-019-
8471-1
Figures
Figure 1
Locality map of the Soutpansberg region with existing groundwater monitoring stations Note: The
designations employed and the presentation of the material on this map do not imply the expression of
any opinion whatsoever on the part of Research Square concerning the legal status of any country,
territory, city or area or of its authorities, or concerning the delimitation of its frontiers or boundaries. This
map has been provided by the authors.
Page 18/23Figure 2
Geological settings of the Soutpansberg region Note: The designations employed and the presentation of
the material on this map do not imply the expression of any opinion whatsoever on the part of Research
Square concerning the legal status of any country, territory, city or area or of its authorities, or concerning
the delimitation of its frontiers or boundaries. This map has been provided by the authors.
Page 19/23Figure 3
Spatial distribution of TDS in the Soutpansberg region Note: The designations employed and the
presentation of the material on this map do not imply the expression of any opinion whatsoever on the
part of Research Square concerning the legal status of any country, territory, city or area or of its
authorities, or concerning the delimitation of its frontiers or boundaries. This map has been provided by
the authors.
Figure 4
Page 20/23Spatial distribution of Chloride in the Soutpansberg region Note: The designations employed and the
presentation of the material on this map do not imply the expression of any opinion whatsoever on the
part of Research Square concerning the legal status of any country, territory, city or area or of its
authorities, or concerning the delimitation of its frontiers or boundaries. This map has been provided by
the authors.
Figure 5
Spatial distribution of Nitrate in the Soutpansberg region Note: The designations employed and the
presentation of the material on this map do not imply the expression of any opinion whatsoever on the
part of Research Square concerning the legal status of any country, territory, city or area or of its
authorities, or concerning the delimitation of its frontiers or boundaries. This map has been provided by
the authors.
Page 21/23Figure 6
Spatial distribution of Fluoride in the Soutpansberg region Note: The designations employed and the
presentation of the material on this map do not imply the expression of any opinion whatsoever on the
part of Research Square concerning the legal status of any country, territory, city or area or of its
authorities, or concerning the delimitation of its frontiers or boundaries. This map has been provided by
the authors.
Figure 7
Page 22/23Spatial distribution of Magnesium in the Soutpansberg region Note: The designations employed and the
presentation of the material on this map do not imply the expression of any opinion whatsoever on the
part of Research Square concerning the legal status of any country, territory, city or area or of its
authorities, or concerning the delimitation of its frontiers or boundaries. This map has been provided by
the authors.
Figure 8
Spatial distribution of suitability of groundwater for irrigation based on SAR Note: The designations
employed and the presentation of the material on this map do not imply the expression of any opinion
whatsoever on the part of Research Square concerning the legal status of any country, territory, city or
area or of its authorities, or concerning the delimitation of its frontiers or boundaries. This map has been
provided by the authors.
Supplementary Files
This is a list of supplementary files associated with this preprint. Click to download.
Rawgroundwaterqualitydata.xlsx
Page 23/23You can also read


