City of Paso Robles - Wastewater Rate Study January 2021 - Paso Robles, CA
←
→
Page content transcription
If your browser does not render page correctly, please read the page content below
City of Paso Robles

Wastewater Rate Study

      January 2021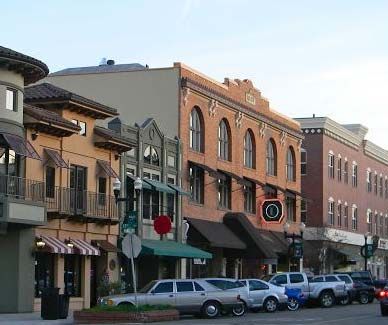
City of Paso Robles
Wastewater Rate Study
      January 2021

          Prepared by:

     Bartle Wells Associates
     2625 Alcatraz Ave, #602
       Berkeley, CA 94705
        Tel: 510.653.3399
      www.bartlewells.com
2625 Alcatraz Ave, #602
                                                                                         Berkeley, CA 94705
                                                                                           Tel: 510 653 3399
                                                                                        www.bartlewells.com

January 20, 2021

Attn:   Matt Thompson, Wastewater Manager

Re:     Wastewater Rate Study

Bartle Wells Associates is pleased to submit the attached Wastewater Rate Study. The study develops
long‐term financial projections and calculates new wastewater rates designed to equitably recover
the costs of providing service. The recommended rates are designed to meet the City’s operational
and capital funding needs, comply with legal requirements, and be fair to all customers.

The proposed rates incorporate both overall rate increases needed to restore the wastewater
enterprise’s financial stability and meet future funding needs as well as some modifications to the
wastewater rate structure designed to improve revenue stability and more equitably align rates with
the cost of providing service. Rate increases are phased over five years, with a larger increase needed
the first year to help restore financial stability.

We enjoyed working with the City on this assignment and appreciate the ongoing assistance and input
received throughout the project. Please contact us anytime if you have questions about the
recommendations in this report or other related issues.

Sincerely,

BARTLE WELLS ASSOCIATES

Alex Handlers                                          Erik Helgeson
Principal/Vice‐President                               Senior Consultant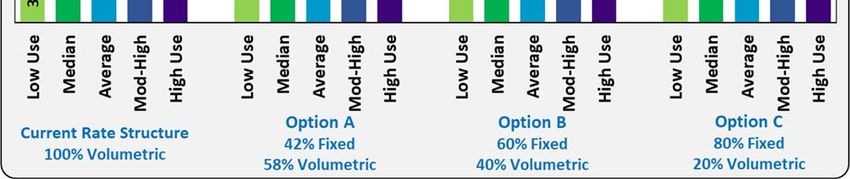
LIST OF TABLES & FIGURES

TABLES
Table ES‐1. Single Family Residential Wastewater Rate Options............................................. ES‐3
Table ES‐2. Projected Commercial Wastewater Rates ............................................................ ES‐4
Table 1. Historical Wastewater Rates........................................................................................... 3
Table 2. Wastewater Fund Reserves ............................................................................................ 9
Table 3. Historical Wastewater Finances.................................................................................... 10
Table 4. Outstanding Debt ......................................................................................................... 11
Table 5. Wastewater Cash Flow Projections A – Phase In Rate Increases .................................. 15
Table 6. Wastewater Cash Flow Projections B – Large Up‐Front Rate Increase ......................... 16
Table 7. Single Family Residential Customers............................................................................. 18
Table 8. Commercial Accounts by Meter Size & Meter Equivalents ........................................... 18
Table 9. Single Family Residential Customers............................................................................. 19
Table 10. Single Family Residential Rate Options ....................................................................... 26
Table 11. Projected Single Family Residential Wastewater Bills ................................................. 27
Table 12. Proposed Commercial Wastewater Rates .................................................................. 29
Table 13. Projected Commercial Wastewater Bills ..................................................................... 29
Table 14. Wastewater Discharge by Customer Class .................................................................. 32
Table 15. Wastewater Discharge by Customer Class .................................................................. 32
Table 16. Single Family Residential Rate Derivation ‐ Option A .................................................. 34
Table 17. Single Family Residential Rate Derivation ‐ Option B .................................................. 35
Table 18. Single Family Residential Rate Derivation ‐ Option C .................................................. 36
Table 19. Commercial Wastewater Rate Derivation................................................................... 37

FIGURES
Figure ES‐1. Comparison of Bills with Full Implementation of Rate Options ........................... ES‐4
Figure 1: Single Family Residential Wastewater Rate Survey – Low Use ...................................... 5
Figure 2: Single Family Residential Wastewater Rate Survey – Typical Use .................................. 6
Figure 3: Single Family Residential Wastewater Rate Survey – Med‐High Use............................. 7
Figure 4: Commercial Wastewater Rate Survey ........................................................................... 8
Figure 5: Projected Revenues & Expenses.................................................................................. 17
Figure 6: Single Family Residential Winter Water Use ............................................................... 19
Figure 7: Single Family Residential Winter Water Use ............................................................... 20
Figure 8: Comparison of Single Family Bills Under Rate Options ................................................ 28
ES EXECUTIVE SUMMARY
Background
The City of Paso Robles provides wastewater service to almost 10,000 residential, commercial and
institutional accounts within the City. The City owns and operates a wastewater system consisting of
approximately 126 miles of sewer pipelines, 14 lift stations and force mains, and a wastewater treatment
plant with a capacity of 4.9 million gallons per day. Treated wastewater effluent is discharged to the
Salinas River and must meet stringent regulatory requirements.
Financially, the wastewater utility is operated as a self‐supporting enterprise that relies primarily on
revenues from wastewater rates to fund the costs of providing service. As such, rates must be set at levels
adequate to fund operating and maintenance expenses, pay debt service, and fund necessary capital
improvements to keep the City’s wastewater system in safe and reliable operating condition.
The City last increased its wastewater rates on July 1, 2016, over 4‐1/2 years ago. The City’s sewer rates
are low compared to other regional agencies based on a survey of 16 agencies on the Central Coast.
Financial Challenges
In recent years, the wastewater enterprise has been operating in deficit mode, which has resulted in a
substantial draw down of fund reserves to meet annual funding needs. In addition, the wastewater utility
is facing a number of new financial challenges that are driving the need for wastewater rate increases.
These financial challenges include:
Loss of approximately $700,000 of annual revenues that used to be funded by Templeton Community
Services District before the District completed a major sewer project and subsequently discontinued
sending wastewater to the City for treatment and disposal.
A $444,000 increase in annual debt service for repayment of a low‐interest‐rate State Revolving Fund
issued to fund tertiary treatment facilities at the wastewater treatment plant.
Increased funding needs for rehabilitation and replacement of aging sewer infrastructure. In 2019,
the City adopted a Wastewater Collection System Renewal Strategy and Master Plan that identifies
over $50 million (in 2019 dollars) of capital improvements needed to address deficiencies and replace
aging infrastructure. The City plans to fund roughly $9.7 million of improvements that benefit existing
ratepayers over the next five years based on a reduced capital improvement program that only
addresses the City’s highest‐priority capital needs. Current rates provide no funding for capital
projects. Additional capital improvements needed to serve growth will be funded by new
development.
The City faces an immediate need to eliminate annual budget deficits and restore financial stability.
Rate increases are also needed to ensure compliance with debt covenants securing each of the City’s
outstanding wastewater debt obligations.
BARTLE WELLS ASSOCIATES ES‐1
City of Paso Robles Wastewater Rate Study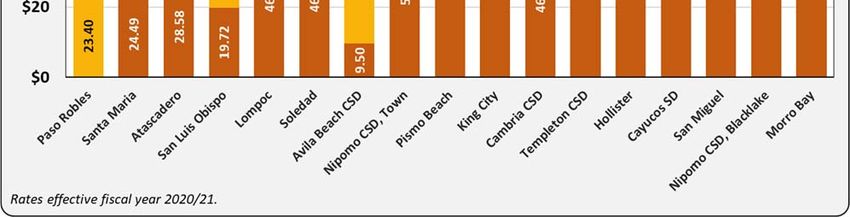
Rate Study Objectives
In 2020, the City retained Bartle Wells Associates (BWA) to conduct a wastewater rate study. Key goals
of the study include developing financial projections to identify future funding needs, evaluating rate
options, and developing future wastewater rates designed to fund the City’s costs of providing wastewater
service and comply with the legal requirements of Proposition 218.

Required Wastewater Rate Increases
Based on evaluation of financial projections, substantial wastewater rate increases are needed over the
next five years. BWA developed two rate increase scenarios designed to meet the funding needs of the
wastewater enterprise:
A) Phase In Rate Increases: In this scenario, wastewater rate increases are phased in as gradually as
   possible but require a larger increase the first year in order to fund projected annual expenses, restore
   financial stability, and comply with debt covenants.
B) Large Up‐Front Rate Increase: This scenario assumes adoption of a large up front rate increase to
   immediately generate adequate funding to both restore financial stability and support more prudent
   levels of fund reserves. This scenario assumes no additional rate increases would be needed for three
   years with smaller future rate increases starting in 2024.

                                           July 1    April 1        April 1       April 1       April 1
                                           2021       2022           2003          2024          2025
 A) Phase In Rate Increases                24%         8%            8%             8%            8%

 B) Large Up‐Front Rate Increase           50%         0%            0%             5%            5%

Current Wastewater Rates
The City currently charges all customers a 100% volumetric rate of $7.80 per hundred cubic feet (hcf) of
estimated wastewater discharge. Single Family Residential accounts (which also include duplexes,
triplexes, and four‐plexes) are billed based on the lower of either a) average use during the months of
December through February, a time of minimal outdoor irrigation, or b) actual monthly use. Commercial
customers (which also include institutional and larger multi‐family accounts) are billed based on metered
water consumption each month and excludes use from irrigation meters.

BWA worked with City staff to evaluate a number of wastewater rate structure alternatives, including
options for phasing in a fixed rate component to help recover a portion of the City’s fixed wastewater
expenses. The City incurs a substantial amount of fixed costs ‐‐ for staffing, administration, debt service
and capital facilities – to provide infrastructure and operational capacity available to serve customers on
demand. The City estimates that roughly 80% of its wastewater expenses are fixed costs that do not vary
with changes in usage.

     BARTLE WELLS ASSOCIATES                                                                              ES‐2
     City of Paso Robles Wastewater Rate Study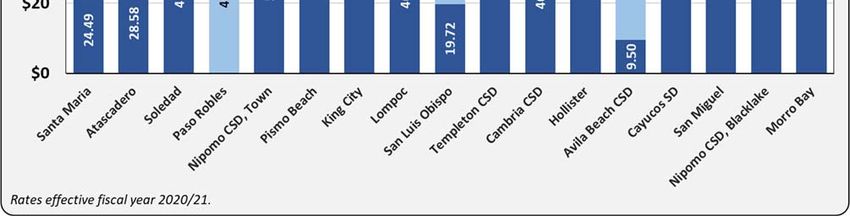
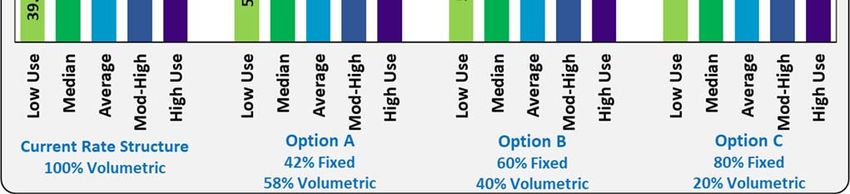
Single Family Residential Rate Options
Three rate options were developed for Council consideration. Each of the options includes phasing in a
fixed monthly service charge that would be levied in addition to monthly usage charges. The options differ
in the level of revenue recovery from the fixed and volumetric rates. The following table summarizes rates
under the three options and assumes the City phases in rate increases over the next five years as shown.
Table ES‐1. Single Family Residential Wastewater Rate Options
Current July 1 April 1 April 1 April 1 April 1
Rates 2021 2022 2023 2024 2025
Overall Rate Increases 24% 8% 8% 8% 8%
Single Family Residential (1‐4 units) Wastewater Rates
Usage Charges based on average monthly water use from the prior Jan & Feb or actual monthly use, whichever is lower
Subject to minimum sewer billing basis of 2 hcf
Option A: Transition to 42% fixed charge while maintaining $7.80/hcf usage rate
Fixed Monthly Charge per Dwelling Unit ‐ $11.40 $15.53 $19.93 $24.60 $29.58
Sewer Usage Charge per hcf 7.80 7.80 7.80 7.80 7.80 7.80
Option B: Transition to 60% fixed & 40% volumetric rates
Fixed Monthly Charge per Dwelling Unit ‐ $11.40 $19.07 $26.74 $34.41 $42.08
Sewer Usage Charge per hcf 7.80 7.80 7.14 6.51 5.93 5.40
Option C: Transition to 80% fixed & 20% volumetric rates
Fixed Monthly Charge per Dwelling Unit ‐ $11.40 $22.58 $33.75 $44.93 $56.11
Sewer Usage Charge per hcf 7.80 7.80 6.48 5.19 3.93 2.70
A number of additional modifications to the City’s single family residential rate structure and billing
method are proposed to help improve equity and address issues with current billing practices, including:
Calculate each customer’s sewer billing basis based on a 3‐year rolling average of monthly winter
water use. This will help reduce annual fluctuations in billed wastewater use due to changes in
weather and other factors. Single family charges are currently calculated based on winter water use
from the prior year only.
Change the months used to determine each customer’s sewer billing basis from a) the current
3‐month period of December through February to b) the 2 months of January and February, which
have historically been the lowest 2 months of residential water use. This period avoids the months of
December and March, which are also low‐use months but have historically experienced more
variability in water use, largely due to outdoor irrigation.
Establish a minimum sewer billing basis of 2 hcf per month. This level of use equates to roughly
50 gallons per day and reflects typical indoor water use for a single person.
The following chart shows a comparison of wastewater charges for single family customers with different
levels of billed usage for each of the residential rate options.
BARTLE WELLS ASSOCIATES ES‐3
City of Paso Robles Wastewater Rate Study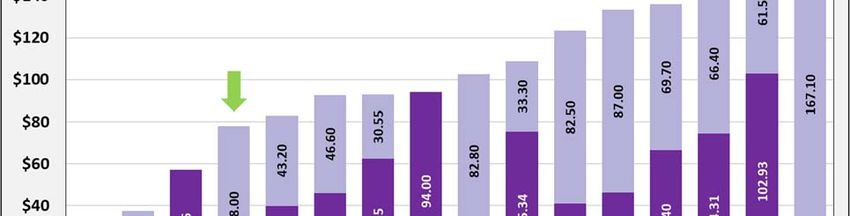
Figure ES‐1. Comparison of Bills with Full Implementation of Rate Options

Commercial Wastewater Rates
Based on evaluation of rate alternatives by BWA and City staff, it is recommended that the City maintain
its 100% volumetric rate structure for commercial customers, but also establish a minimum monthly
charge designed to ensure a minimal level of cost recovery from bills with minimal to no use. The
minimum charge is not a fixed charge that is billed in addition to volumetric rates, instead it serves as a
baseline charge that would only apply when lower levels of billed usage would otherwise result in charges
below the minimum level. To help provide some parity with Single Family Residential rates, the minimum
monthly charges are proposed to be set at the same level as the fixed charge for Single Family accounts.

                          Table ES‐2. Projected Commercial Wastewater Rates
                                                 Current      July 1      April 1      April 1      April 1      April 1
                                                  2021        2021         2022         2023         2024         2025
Overall Rate Increases                                         24%          8%           8%           8%           8%
Commercial/Multi‐Family
Maintain 100% volumetric rates
Sewer Usage Charge per hcf                      $7.80           $9.67       $10.44      $11.27       $12.18       $13.15
Usage Charges applied to monthly metered water use
Minimum Monthly Charge                            Set equal to the Fixed Monthly Charge per Single Family Dwelling Unit

     BARTLE WELLS ASSOCIATES                                                                                         ES‐4
     City of Paso Robles Wastewater Rate Study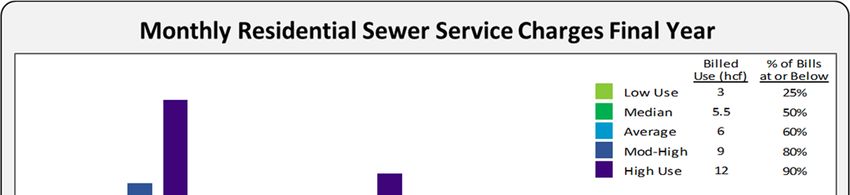
1      BACKGROUND & OBJECTIVES

1.1 Background
The City of Paso Robles provides wastewater service to roughly 10,000 residential, commercial and
institutional accounts within the City. Paso Robles has a population of approximately 31,200 and is
located on California’s Central Coast in northern San Luis Obispo County, roughly half‐way between San
Francisco and Los Angeles.

The City owns and operates a wastewater system consisting of approximately 126 miles of sewer
pipelines, 14 lift stations and force mains, and a wastewater treatment plant with a capacity of
4.9 million gallons per day. Treated wastewater effluent is discharged to the Salinas River and must
meet stringent regulatory requirements.

The City’s treatment plant was originally built in 1954 and underwent major upgrades in 2016. Tertiary
treatment was added in 2019 to enable the City to comply with its waste discharge permit requirements
and will also enable the City to provide highly‐treated recycled water for landscape and agricultural
irrigation in the future.

Many of the City’s sewer pipelines were installed in the 1950s to 1970s and will be reaching the end of
their useful lives in upcoming years. In 2019, the City completed a Wastewater Collection System
Renewal Strategy and Master Plan that identifies over $50 million (in 2019 dollars) of infrastructure
repair and replacement projects over the next 30 years. With construction cost inflation, the projects
are expected to cost over $80 million.

Financially, the wastewater utility is operated as a self‐supporting enterprise that relies primarily on
revenues from wastewater rates to fund the costs of providing service. As such, rates must be set at
levels adequate to fund operating and maintenance expenses, pay debt service, and fund necessary
capital improvements to keep the City’s wastewater system in safe and reliable operating condition.

The City’s last wastewater rate study was completed in 2011 and resulted in adoption of 5‐years of rate
increases. The last wastewater rate increase became effective on July 1, 2016, over 4‐1/2 years ago.
The City’s sewer rates are low compared to other regional agencies.

     BARTLE WELLS ASSOCIATES                                                                          1
     City of Paso Robles Wastewater Rate Study
1.2 Rate Study Objectives
In 2020, the City retained Bartle Wells Associates to conduct a wastewater rate study to support the
City’s wastewater operations and funding needs identified in the 2019 Master Plan. Key objectives of
the study include:
Develop 10‐year financial projections to identify future operating, capital, and debt
service funding needs of the City’s wastewater enterprise.
Evaluate alternatives for implementing rate increases and develop an option for phasing
in rate increases over multiple years to the extent possible.
Review the City’s wastewater rate structure and work with City staff to develop rate
alternatives that:
Recover the costs of providing wastewater service including costs for operations,
maintenance, capital improvements, and compliance with debt service obligations
Are fair and equitable to all customers
Are easy to understand and administer
Comply with the legal requirements of California Constitution, Article 13D, Section 6
(established by Proposition 218)
Support the long‐term operational and financial stability of the wastewater enterprise.
This report presents key findings and wastewater rate options. The rate options were developed and
refined with substantial input from City staff.
BARTLE WELLS ASSOCIATES 2
City of Paso Robles Wastewater Rate Study2 WASTEWATER RATES
2.1 Historical Rates
Table 1 shows a schedule of wastewater rates since July 2011 along with corresponding monthly charges
for customers with a range of billed usage. The City’s last wastewater rate increase went into effect on
July 1, 2016, over 4‐1/2 years ago.
Table 1. Historical Wastewater Rates
Effective July 1 July 1 July 1 July 1 July 1 July 1
Date 2011 2012 2013 2014 2015 2016
Monthly Fixed Charge 25.86 ‐ ‐ ‐ ‐ ‐
Usage Charge ($/hcf) 1.20* 4.50 5.40 6.30 7.35 7.80
Residential (1‐4 units): Charge based on average monthly winter water use (Dec/Jan/Feb) or montly use,
whichever is lower
All Other Customers: Charge based on monthly metered water use
MONTHLY SEWER SERVICE CHARGE
Single Family Residential (1‐4 units)
Usage Charges based on winter water use from Dec/Jan/Feb or actual use, whichever is lower
Description Use (hcf)
Low Use 3 25.86 13.50 16.20 18.90 22.05 23.40
Average Use 6 25.86 27.00 32.40 37.80 44.10 46.80
Mod‐High Use 9 25.86 40.50 48.60 56.70 66.15 70.20
High Use 12 25.86 54.00 64.80 75.60 88.20 93.60
Commercial/Multi‐Family Residential
Usage Charges based on metered water use each month
Description Use (hcf)
Low Use 5 25.86 22.50 27.00 31.50 36.75 39.00
Med‐Low Use 10 31.86 45.00 54.00 63.00 73.50 78.00
Moderate Use 20 43.86 90.00 108.00 126.00 147.00 156.00
Higher Use 50 79.86 225.00 270.00 315.00 367.50 390.00
* Usage Charges effective 2011 only applied to non‐residential use in excess of 5 hcf per month.
BARTLE WELLS ASSOCIATES 3
City of Paso Robles Wastewater Rate StudyThe City’s last wastewater rate study was completed in 2011. The prior study resulted in a 5‐year rate
increase designed to secure funding for a major upgrade to the City’s wastewater treatment plant. The
adopted rates also transitioned the City’s wastewater rate structure from sewer rates that included both
fixed and volumetric rate components to 100% volumetric rates based solely on usage. For comparison,
the City estimates that roughly 80% of its annual wastewater expenses are fixed costs that do not vary
with changes in the volume of wastewater discharge.
The City’s wastewater rates are billed based on metered water use as measured in units of one hundred
cubic feet (hcf). One hcf equals roughly 750 gallons. All customers pay a uniform rate for all billed usage.
The City bills customers monthly for wastewater service on a combined utility bill that also includes
charges for water service.
Wastewater Usage Charges for single family residential customers (which also include duplexes,
triplexes, and fourplexes) are billed based on the lower of a) average monthly winter water use from the
prior December through February, a period of minimal outdoor irrigation, or b) actual monthly use.
Usage Charges for commercial, institutional, and larger multi‐family accounts are billed based on
monthly water use and exclude usage from separate irrigation meters. Large wineries and breweries
are required to independently fund their own pre‐treatment facilities to reduce the strength of their
wastewater discharged to the City’s sewer system. Smaller wineries and breweries pay a surcharge for
higher‐strength wastewater.
BARTLE WELLS ASSOCIATES 4
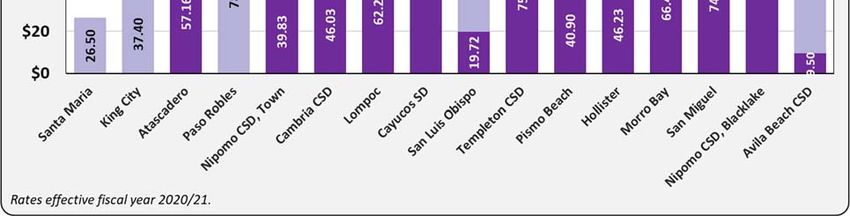
City of Paso Robles Wastewater Rate Study2.2 Regional Rate Surveys
The following charts show monthly wastewater bills for a single family home with low, typical, and higher
levels of wastewater use. The City’s sewer rates are low compared to other regional agencies. Figure 1
shows monthly charges for a low‐use customer with 3 hcf of billed monthly use. Roughly 25% of the
City’s residential wastewater bills are at or below this level of usage.
Figure 1: Single Family Residential Wastewater Rate Survey – Low Use
As shown on the charts, most of the other regional agencies levy fixed charges for wastewater service
that do not vary based on usage. A few other agencies levy wastewater rates that include both fixed and
volumetric charges. Paso Robles is the only agency of those surveyed that levies 100% volumetric
wastewater rates with no fixed charge.
BARTLE WELLS ASSOCIATES 5
City of Paso Robles Wastewater Rate StudyFigure 2 shows monthly charges for a single family home with typical (roughly average) use of
6 hcf per month. The wastewater bill for a typical home in Paso Robles is approximately 30%
lower than the regional average.
Figure 2: Single Family Residential Wastewater Rate Survey – Typical Use
BARTLE WELLS ASSOCIATES 6
City of Paso Robles Wastewater Rate StudyFigure 3 shows monthly charges for a single family home with medium‐high use of 12 hcf per month. This
level of use represents a customer with twice the usage of a typical home. In Paso Robles, the top 10% of
single family customers pay bills at or above this level.
Figure 3: Single Family Residential Wastewater Rate Survey – Med‐High Use
BARTLE WELLS ASSOCIATES 7
City of Paso Robles Wastewater Rate StudyFigure 4 shows a comparison of commercial wastewater charges for a small office with 10 hcf of billed
monthly use. Almost all regional agencies levy commercial rates that include substantial volumetric
charges.
Figure 4: Commercial Wastewater Rate Survey
BARTLE WELLS ASSOCIATES 8
City of Paso Robles Wastewater Rate Study3 WASTEWATER FINANCES & CASH FLOW PROJECTIONS
3.1 Financial Overview
The City’s wastewater utility is a financially self‐supporting enterprise that relies primarily on revenues
from wastewater rates to fund the costs of providing service. As such, wastewater rates must be set at
levels adequate to fund the costs of operating and maintaining the wastewater system, meet annual
debt service requirements, and fund capital improvements to keep the wastewater system in safe and
reliable operating condition.
In recent years, the wastewater enterprise has been operating in deficit mode, which has resulted in a
substantial draw down of fund reserves to meet annual funding needs. Table 2 shows a history of
wastewater fund reserves based on the City’s audited financial statements. As shown, the City’s total
wastewater fund reserves have decreased from roughly $12.8 million to $6.2 million over the past four
years. Also note that the City is required to set aside $3.1 million of this total as a debt service reserve
fund for the wastewater enterprise’s outstanding State Revolving Fund loans.
Table 2. Wastewater Fund Reserves
As of June 30 2017 2018 2019 2020
Cash & Receivables
Cash and investments 12,747,390 9,063,657 8,372,406 5,990,851
Accounts receivable 757,403 887,514 963,585 856,394
Interest receivable 0 0 30,593 30,578
Prepaid items __________0 6,864
__________ 7,139
__________ __________0
Subtotal 13,504,793 9,958,035 9,373,723 6,877,823
Less Liabilities (Excluding Debt)
Accounts payable (599,370) (803,751) (1,125,690) (543,234)
Accrued payroll expenses (89,733)
__________ (103,823)
__________ (110,600)
__________ (104,663)
__________
Subtotal (689,103) (907,574) (1,236,290) (647,897)
Net Fund Reserves 12,815,690 9,050,461 8,137,433 6,229,926
Fund Reserve Breakdown
Facility Charges 3,591,556 3,987,066 6,400,768 5,383,356
Net Other Fund Reserves 6,512,276 2,351,537 (975,193) (2,263,040)
Subtotal 10,103,832 6,338,603 5,425,575 3,120,316
SRF Debt Reserves 2,711,858
__________ 2,711,858
__________ 2,711,858
__________ 3,109,610
__________
Total 12,815,690 9,050,461 8,137,433 6,229,926
Source: Based on data from Comprehensive Annual Financial Reports.
BARTLE WELLS ASSOCIATES 9
City of Paso Robles Wastewater Rate StudyTable 3 shows a history of wastewater enterprise finances from fiscal years 2016/17 through 2018/19.
Table 3. Historical Wastewater Finances
2016/17 2017/18 2018/19
REVENUES
Sewer User Fees 8,093,384 8,507,857 8,854,741
Templeton CSD Charges 506,322 588,007 722,446
Septage Fees 159,615 128,870 23,777
Interest Earnings 48,443 49,128 281,170
Sewer Connection Fees 1,987,855 380,592 380,359
Other 116,889
__________ 236,045
__________ 80,202
__________
Subtotal 10,912,508 9,890,499 10,342,694
SRF Loan Proceeds 1,532,000 6,935,960 5,891,854
EXPENSES
Operating & Maintenance
Sewer Collection 1,361,232 1,089,767 1,538,607
Sewer Treatment 3,552,285 3,278,797 3,756,516
Source Control 359,233 241,471 291,850
Stormwater Management 304,170 266,203 315,990
Utility Billing 453,562 466,949 518,359
Cost Alloc Transfers to GF 661,549 677,266 809,213
Operating Transfers 53,167
__________ 6,000
__________ __________0
Subtotal 6,745,197 6,026,454 7,230,536
Debt Service
2012 Bonds 462,775 463,175 468,175
2013 SRF Loan 2,711,857
__________ 2,711,857
__________ 2,711,857
__________
Subtotal 3,174,632 3,175,032 3,180,032
Capital/Non‐Operating
Tertiary Treatment Project 1,532,000 6,935,960 5,891,854
Other Capital Improvements 506,315
__________ 1,422,628
__________ 3,773,869
__________
Subtotal 2,038,315 8,358,588 9,665,723
Total Expenses 11,958,143 17,560,073 20,076,290
Revenues Less Expenses 486,364 (733,614) (3,841,742)
Debt Service Coverage 1.31 1.22 0.98
Table 4 shows a summary of outstanding debt. The wastewater enterprise has three outstanding debt
obligations including two low‐interest rate State Revolving Fund (SRF) Loans and one bond issue. The
City was successful in its efforts to obtain financing through California’s Clean Water State Revolving
BARTLE WELLS ASSOCIATES 10
City of Paso Robles Wastewater Rate StudyFund Financing Program for its last round of major wastewater treatment plant upgrades and more
recently for the addition of tertiary treatment facilities. In addition, the City was awarded $4 million of
principal forgiveness (grant funding) for the tertiary treatment facilities.
Table 4. Outstanding Debt
2012 Wastewater 2013 SRF Loan 2017 SRF Loan
Rev Refi Bonds WWTP Tertiary* Total
Issue Size $6,355,000 $44,721,969 $10,359,814 $61,436,783
Interest Rate 3.25% ‐ 5.00% 1.70% 1.70%
Outstanding 6/30/20 4,440,000 37,063,095 10,118,869 51,621,965
Fiscal Year Ending
2020 $467,575 $2,665,259 $360,013 $3,492,847
2021 461,575 2,665,259 444,351 3,571,185
2022 467,575 2,665,259 444,351 3,577,185
2023 472,575 2,665,259 444,351 3,582,185
2024 471,575 2,665,259 444,351 3,581,185
2025 474,825 2,665,259 444,351 3,584,435
2026 472,075 2,665,259 444,351 3,581,685
2027 470,050 2,665,259 444,351 3,579,660
2028 471,750 2,665,259 444,351 3,581,360
2029 467,925 2,665,259 444,351 3,577,535
2030 468,750 2,665,259 444,351 3,578,360
2031 463,000 2,665,259 444,351 3,572,610
2032 466,875 2,665,259 444,351 3,576,485
2033 2,665,259 444,351 3,109,610
2034 2,665,259 444,351 3,109,610
2035 2,665,259 444,351 3,109,610
2036 2,665,259 444,351 3,109,610
2037 444,351 444,351
2038 444,351 444,351
2039 444,351 444,351
2040 444,351 444,351
2041 444,351 444,351
2042 444,351 444,351
2043 444,351 444,351
2044 444,351 444,351
2045 444,351 444,351
2046 444,351 444,351
2047 444,351 444,351
2048 444,351 444,351
2049 444,351 444,351
2050 0
* Loan amount reflects $4 million of principal forgiveness (grant funding).
BARTLE WELLS ASSOCIATES 11
City of Paso Robles Wastewater Rate Study3.2 Financial Challenges
The City’s wastewater utility is facing a number of financial challenges that will drive the need for rate
increases in upcoming years. These financial challenges include:
3.2.1 Loss of $700,000 of Revenues from Templeton CSD
In 2019, Templeton Community Services District completed construction of a major sewer project and
subsequently discontinued sending wastewater to the City for treatment and disposal. As a result, the
City experienced a roughly $700,000 loss of annual revenues that were previously paid by the District.
3.2.2 New Debt Service for Tertiary Treatment Facilities
The City needs to fund $444,000 of new annual debt service for repayment of a low‐interest‐rate State
Revolving Fund issued to fund tertiary treatment facilities at the City’s wastewater treatment plant.
With the new SRF Loan, annual debt service will total almost $3.6 million per year.
3.2.3 Rehabilitation and Replacement of Aging Sewer Infrastructure
In 2019, the City developed and adopted a Wastewater Collection System Renewal Strategy and Master
Plan that identifies over $50 million (in 2019 dollars) of capital improvements needed to address
deficiencies and replace aging sewer collection system infrastructure. With construction cost inflation,
the projects are expected to cost over $80 million.
The City plans to fund roughly $9.7 million of improvements that benefit existing ratepayers over the
next five years based on a reduced capital improvement program that only addresses the City’s highest‐
priority capital needs. The reduced capital improvement program is attached in Appendix A. Current
rates provide no funding for capital projects. Additional capital improvements needed to serve growth
will be funded entirely by new development.
3.2.4 Eliminate Annual Budget Deficits
As noted, the wastewater enterprise has been operating in deficit mode in recent years. This has
resulted in the need for the City to draw down over $6 million of fund reserves to meet annual expenses
over the past three years. A substantial budget deficit is also anticipated in the current fiscal year,
resulting in fund reserves being drawn down below prudent minimal levels. Rate increases are needed
to eliminate annual budget deficits and restore financial stability.
3.2.5 Achieve Compliance with Debt Covenants
Pursuant to the legal covenants securing all three of the City’s outstanding wastewater debt obligations,
the City is required to raise rates and charges as needed to achieve a debt service coverage ratio of 1.10x
on annual debt service. This means that rates and charges must be increased to generate annual
revenues that are adequate to fund operating expenses and 110% of annual debt service. Rate increases
are needed to bring the City back into compliance with its debt covenants.
BARTLE WELLS ASSOCIATES 12
City of Paso Robles Wastewater Rate Study3.3 Wastewater Financial Projections
BWA developed 10‐year cash flow projections to identify annual revenue requirements of the
wastewater enterprise and evaluate rate increase options. The financial projections incorporate the
latest information available as well as a number of reasonable and slightly conservative assumptions.
Key assumptions include:
Revenue Assumptions
The projections assume the first rate increase becomes effective July 1, 2021, which will be exactly
5 years after the City’s last wastewater rate increase in 2016. Future rate adjustments are projected
to go into effect on April 1 of each year following the annual calculation of average monthly winter
water use that is the basis for single family residential charges.
Sewer User Fee revenues are based on City year‐end estimates for fiscal year 2019/20 adjusted to
account for projected rate increases. For financial planning purposes, the projections assume
increases in billed sewer use due to growth is offset by declines in customer demand.
Sewer connection fee revenues are based on projected average annual growth of 100 new single
family homes or equivalents per year. This level of growth is higher than the City has experienced in
recent history. However, the City believes this is a reasonable and conservative level of growth to
use for financial planning as significant new development is anticipated in upcoming years with a
number of development projects in various stages of planning.
Interest earnings are projected based on the beginning fund balance projected each year multiplied
by projected interest rates that gradually increase from 0.5% to 1.5% in upcoming years.
New development pays 100% for capital improvements needed to serve growth. The projections
assume direct developer contributions will fund a little under $12 million of capital improvement
projects allocated to new development over the next 5 years including a) upsizing sewers in
Commerce Way, Scott St, and Flag Way needed to accommodate flows from two developments, and
b) design and construction of Phase 2 Airport Area Infrastructure Improvements.
The projections exclude funding for a future recycled water distribution system and assume these
costs would be funded by future recycled water customers. The projections also assume the
wastewater utility will be reimbursed from future debt proceeds for $1.6 million of expenditures
previously incurred on evaluation and design of the first phase of an anticipated recycled water
distribution system.
Expense Assumptions
Operating and maintenance expenses are based on the City’s budget for the current fiscal year and
City staff projections for future years which include a slightly higher level of anticipated operating
expenses in Fiscal Year 2021/22 and overall future cost inflation of roughly 4%.
BARTLE WELLS ASSOCIATES 13
City of Paso Robles Wastewater Rate Study The projections assume the City does not issue any new wastewater debt. The City is aware it may
need to pledge its wastewater enterprise revenues to help provide debt repayment security for a
potential future State Revolving Fund Loan or other financing for construction of a recycled water
distribution system, even though the City anticipates these costs would be funded by future recycled
water customers.
The projections incorporate an updated Wastewater Capital Improvement Program developed by
City staff that includes reduced levels of capital funding in early years to help facilitate a phase in of
wastewater rate increases. Capital expenditures in the current fiscal year 2020/21 are based on
revised City estimates for the current year and include approximately $2.4 million of carryover
funding for projects budgeted, but not funded, in prior years. After 5 years, capital improvements
allocated to City ratepayers are projected at $2.8 per million per year plus 3% cost escalation and
capital improvements for new development are projected at $0.8 million, roughly aligned with
projected wastewater connection fee revenues.
Fund Reserves & Debt Service Coverage
The projections assume the City continues to down fund reserves in the current fiscal year 2020/21
before rate increases are implemented to restore financial stability. Fund reserves are expected to
remain below prudent minimal levels until the City can gradually build back up fund reserves in
future years.
Debt service coverage is projected to remain temporarily below required minimum levels in the
current fiscal year. The initial rate increase is projected to enable the City to meet its debt coverage
requirements starting next fiscal year 2021/22.
3.4 Rate Increase Scenarios
BWA developed cash flow projections under two rate increase scenarios shown on the following pages:
C) Phase In Rate Increases: In this scenario, wastewater rate increases are phased in as gradually as
possible but require a larger increase the first year in order to fund projected annual expenses,
restore financial stability, and achieve debt service coverage requirements.
D) Large Up‐Front Rate Increase: This scenario is shown for comparison assuming adoption of a large
up front rate increase to immediately generate adequate funding to both restore financial stability
and support more prudent levels of fund reserves. This scenario assumes no additional rate
increases for three years followed smaller future rate increases starting in 2024.
July 1 April 1 April 1 April 1 April 1
2021 2022 2003 2024 2025
A) Phase In Rate Increases 24% 8% 8% 8% 8%
B) Large Up‐Front Rate Increase 50% 0% 0% 5% 5%
BARTLE WELLS ASSOCIATES 14
City of Paso Robles Wastewater Rate StudyA) Phase In Rate Increases City of Paso Robles ‐ Sewer Cash Flow Projections
2019/20 2020/21 2021/22 2022/23 2023/24 2024/25 2025/26 2026/27 2027/28 2028/29 2029/30
Effective Date of Rate Increase (tbd) July 1 April 1 April 1 April 1 April 1 April 1 April 1 April 1 April 1 April 1
Sewer Rate Increase Target 24% 8% 8% 8% 8% 4% 4% 3% 3% 2%
Growth EDUs 30 50 100 100 100 100 100 100 100 100 100
Change in Billed Usage 0.0% 0.0% 0.0% 0.0% 0.0% 0.0% 0.0% 0.0% 0.0% 0.0%
Interest Earnings Rate 2.0% 0.5% 0.75% 1.0% 1.5% 1.5% 1.5% 1.5% 1.5% 1.5% 1.5%
Beginning Sewer Fund Reserves $5,426,000 $3,120,000 ($942,000) ($1,048,000) $347,000 $1,433,000 $1,144,000 $2,027,000 $1,886,000 $2,590,000 $2,499,000
Beginning SRF Debt Reserves 2,712,000
__________ 3,110,000
__________ 3,110,000
__________ 3,110,000
__________ 3,110,000
__________ 3,110,000
__________ 3,110,000
__________ 3,110,000
__________ 3,110,000
__________ 3,110,000
__________ 3,110,000
__________
Total 8,138,000 6,230,000 2,168,000 2,062,000 3,457,000 4,543,000 4,254,000 5,137,000 4,996,000 5,700,000 5,609,000
REVENUES
Sewer User Fees 8,874,000 8,857,000 11,129,000 12,019,000 12,981,000 14,019,000 15,041,000 15,643,000 16,241,000 16,729,000 17,202,000
Templeton CSD Charges 560,000 0 0 0 0 0 0 0 0 0 0
Interest Earnings 120,000 31,000 16,000 21,000 52,000 68,000 64,000 77,000 75,000 86,000 84,000
Sewer Connection Fees 297,000 400,000 810,000 810,000 810,000 810,000 810,000 810,000 810,000 810,000 810,000
BARTLE WELLS ASSOCIATES
Other Revenues 38,000
__________ 32,000
__________ 100,000
__________ 100,000
__________ 100,000
__________ 100,000
__________ 100,000
__________ 100,000
__________ 100,000
__________ 100,000
__________ 100,000
__________
Total Revenues 9,889,000 9,320,000 12,055,000 12,950,000 13,943,000 14,997,000 16,015,000 16,630,000 17,226,000 17,725,000 18,196,000
Developer Funding for Capital Projects 2,580,000 9,400,000
City of Paso Robles Wastewater Rate Study
SRF Reimbursement for RW Distribution 1,600,000
EXPENSES
Operating & Maintenance Estimated YE Budget 1st 4 items are from Matt's revised projections
Sewer Collection 19/20 incl 711K cap outlay 1,864,000 1,389,000 1,511,000 1,569,000 1,629,000 1,692,000 1,757,000 1,826,000 1,898,000 1,973,000 2,052,000
Sewer Treatment 3,065,000 3,727,000 4,295,000 4,475,000 4,665,000 4,864,000 5,072,000 5,292,000 5,523,000 5,765,000 6,020,000
Source Control 243,000 309,000 360,000 370,000 381,000 392,000 403,000 414,000 426,000 438,000 451,000
Stormwater Management 344,000 314,000 367,000 379,000 391,000 403,000 416,000 430,000 443,000 458,000 472,000
Utility Billing 3.0% 422,000 452,000 466,000 480,000 494,000 509,000 524,000 540,000 556,000 573,000 590,000
Cost Alloc Transfers to GF 3.0% 546,000
__________ 500,000
__________ 515,000
__________ 530,000
__________ 546,000
__________ 562,000
__________ 579,000
__________ 596,000
__________ 614,000
__________ 632,000
__________ 651,000
__________
Subtotal 6,484,000 6,691,000 7,514,000 7,803,000 8,106,000 8,422,000 8,751,000 9,098,000 9,460,000 9,839,000 10,236,000
Debt Service
2012 Wastewater Rev Refi Bonds 468,000 462,000 468,000 473,000 472,000 475,000 472,000 470,000 472,000 468,000 469,000
2013 SRF Loan (WWTP) 2,665,000 2,665,000 2,665,000 2,665,000 2,665,000 2,665,000 2,665,000 2,665,000 2,665,000 2,665,000 2,665,000
2017 SRF Loan (Tertiary) 360,000
__________ 444,000
__________ 444,000
__________ 444,000
__________ 444,000
__________ 444,000
__________ 444,000
__________ 444,000
__________ 444,000
__________ 444,000
__________ 444,000
__________
Total 3,493,000 3,571,000 3,577,000 3,582,000 3,581,000 3,584,000 3,581,000 3,579,000 3,581,000 3,577,000 3,578,000
Capital/Non‐Operating With Carryover Average Annual Capital Funding for Ratepayer CIP Allocation
Capital: Ratepayer Allocation 3,276,000 3,120,000 1,070,000 1,770,000 1,170,000 2,570,000 2,800,000 2,884,000 2,971,000 3,060,000 3,152,000
Capital: New Development Allocation included above
__________ 2,580,000
__________ __________‐ 9,400,000
__________ __________‐ 710,000
__________ __________‐ 1,210,000
__________ 510,000
__________ 1,340,000
__________ 660,000
__________
Subtotal 3,276,000 5,700,000 1,070,000 11,170,000 1,170,000 3,280,000 2,800,000 4,094,000 3,481,000 4,400,000 3,812,000
Table 5. Wastewater Cash Flow Projections A – Phase In Rate Increases
Total Expenses 13,253,000 15,962,000 12,161,000 22,555,000 12,857,000 15,286,000 15,132,000 16,771,000 16,522,000 17,816,000 17,626,000
Revenues Less Expenses (3,364,000) (4,062,000) (106,000) 1,395,000 1,086,000 (289,000) 883,000 (141,000) 704,000 (91,000) 570,000
Net Transfer to SRF Debt Reserves 398,000 ‐ ‐ ‐ ‐ ‐ ‐ ‐ ‐ ‐ ‐
Ending Sewer Fund Reserves 1,664,000 (942,000) (1,048,000) 347,000 1,433,000 1,144,000 2,027,000 1,886,000 2,590,000 2,499,000 3,069,000
SRF Debt Reserve Requirement 3,110,000
__________ 3,110,000
__________ 3,110,000
__________ 3,110,000
__________ 3,110,000
__________ 3,110,000
__________ 3,110,000
__________ 3,110,000
__________ 3,110,000
__________ 3,110,000
__________ 3,110,000
__________
15
Total 4,774,000 2,168,000 2,062,000 3,457,000 4,543,000 4,254,000 5,137,000 4,996,000 5,700,000 5,609,000 6,179,000
Minimum Reserve Target: 25% O&M + $1M CIP 2,621,000 2,673,000 2,879,000 2,951,000 3,027,000 3,106,000 3,188,000 3,275,000 3,365,000 3,460,000 3,559,000
Debt Service Coverage (Min > 1.10x) 0.97 0.74 1.27 1.44 1.63 1.83 2.03 2.10 2.17 2.20 2.22B) Large Upfront Rate Increase City of Paso Robles ‐ Sewer Cash Flow Projections
2019/20 2020/21 2021/22 2022/23 2023/24 2024/25 2025/26 2026/27 2027/28 2028/29 2029/30
Effective Date of Rate Increase (tbd) July 1 April 1 April 1 April 1 April 1 April 1 April 1 April 1 April 1 April 1
Sewer Rate Increase Target 50% 0% 0% 5% 5% 4% 4% 3% 3% 3%
Growth EDUs 30 50 100 100 100 100 100 100 100 100 100
Change in Billed Usage 0.0% 0.0% 0.0% 0.0% 0.0% 0.0% 0.0% 0.0% 0.0% 0.0%
Interest Earnings Rate 2.0% 0.5% 0.75% 1.0% 1.5% 1.5% 1.5% 1.5% 1.5% 1.5% 1.5%
Beginning Sewer Fund Reserves $5,426,000 $3,120,000 ($942,000) $1,108,000 $3,790,000 $5,343,000 $5,160,000 $5,806,000 $5,413,000 $5,850,000 $5,477,000
Beginning SRF Debt Reserves 2,712,000
__________ 3,110,000
__________ 3,110,000
__________ 3,110,000
__________ 3,110,000
__________ 3,110,000
__________ 3,110,000
__________ 3,110,000
__________ 3,110,000
__________ 3,110,000
__________ 3,110,000
__________
Total 8,138,000 6,230,000 2,168,000 4,218,000 6,900,000 8,453,000 8,270,000 8,916,000 8,523,000 8,960,000 8,587,000
REVENUES
Sewer User Fees 8,874,000 8,857,000 13,285,000 13,285,000 13,396,000 14,066,000 14,744,000 15,334,000 15,921,000 16,399,000 16,891,000
Templeton CSD Charges 560,000 0 0 0 0 0 0 0 0 0 0
Interest Earnings 120,000 31,000 16,000 42,000 104,000 127,000 124,000 134,000 128,000 134,000 129,000
Sewer Connection Fees 297,000 400,000 810,000 810,000 810,000 810,000 810,000 810,000 810,000 810,000 810,000
BARTLE WELLS ASSOCIATES
Other Revenues 38,000
__________ 32,000
__________ 100,000
__________ 100,000
__________ 100,000
__________ 100,000
__________ 100,000
__________ 100,000
__________ 100,000
__________ 100,000
__________ 100,000
__________
Total Revenues 9,889,000 9,320,000 14,211,000 14,237,000 14,410,000 15,103,000 15,778,000 16,378,000 16,959,000 17,443,000 17,930,000
Developer Funding for Capital Projects 2,580,000 9,400,000
City of Paso Robles Wastewater Rate Study
SRF Reimbursement for RW Distribution 1,600,000
EXPENSES
Operating & Maintenance Estimated YE Budget 1st 4 items are from Matt's revised projections
Sewer Collection 19/20 incl 711K cap outlay 1,864,000 1,389,000 1,511,000 1,569,000 1,629,000 1,692,000 1,757,000 1,826,000 1,898,000 1,973,000 2,052,000
Sewer Treatment 3,065,000 3,727,000 4,295,000 4,475,000 4,665,000 4,864,000 5,072,000 5,292,000 5,523,000 5,765,000 6,020,000
Source Control 243,000 309,000 360,000 370,000 381,000 392,000 403,000 414,000 426,000 438,000 451,000
Stormwater Management 344,000 314,000 367,000 379,000 391,000 403,000 416,000 430,000 443,000 458,000 472,000
Utility Billing 3.0% 422,000 452,000 466,000 480,000 494,000 509,000 524,000 540,000 556,000 573,000 590,000
Cost Alloc Transfers to GF 3.0% 546,000
__________ 500,000
__________ 515,000
__________ 530,000
__________ 546,000
__________ 562,000
__________ 579,000
__________ 596,000
__________ 614,000
__________ 632,000
__________ 651,000
__________
Subtotal 6,484,000 6,691,000 7,514,000 7,803,000 8,106,000 8,422,000 8,751,000 9,098,000 9,460,000 9,839,000 10,236,000
Debt Service
2012 Wastewater Rev Refi Bonds 468,000 462,000 468,000 473,000 472,000 475,000 472,000 470,000 472,000 468,000 469,000
2013 SRF Loan (WWTP) 2,665,000 2,665,000 2,665,000 2,665,000 2,665,000 2,665,000 2,665,000 2,665,000 2,665,000 2,665,000 2,665,000
2017 SRF Loan (Tertiary) 360,000
__________ 444,000
__________ 444,000
__________ 444,000
__________ 444,000
__________ 444,000
__________ 444,000
__________ 444,000
__________ 444,000
__________ 444,000
__________ 444,000
__________
Total 3,493,000 3,571,000 3,577,000 3,582,000 3,581,000 3,584,000 3,581,000 3,579,000 3,581,000 3,577,000 3,578,000
Capital/Non‐Operating With Carryover Average Annual Capital Funding for Ratepayer Allocation
Capital: Ratepayer Allocation 3,276,000 3,120,000 1,070,000 1,770,000 1,170,000 2,570,000 2,800,000 2,884,000 2,971,000 3,060,000 3,152,000
Capital: New Development Allocation included above
__________ 2,580,000
__________ __________‐ 9,400,000
__________ __________‐ 710,000
__________ __________‐ 1,210,000
__________ 510,000
__________ 1,340,000
__________ 660,000
__________
Subtotal 3,276,000 5,700,000 1,070,000 11,170,000 1,170,000 3,280,000 2,800,000 4,094,000 3,481,000 4,400,000 3,812,000
Total Expenses 13,253,000 15,962,000 12,161,000 22,555,000 12,857,000 15,286,000 15,132,000 16,771,000 16,522,000 17,816,000 17,626,000
Table 6. Wastewater Cash Flow Projections B – Large Up‐Front Rate Increase
Revenues Less Expenses (3,364,000) (4,062,000) 2,050,000 2,682,000 1,553,000 (183,000) 646,000 (393,000) 437,000 (373,000) 304,000
Net Transfer to SRF Debt Reserves 398,000 ‐ ‐ ‐ ‐ ‐ ‐ ‐ ‐ ‐ ‐
Ending Sewer Fund Reserves 1,664,000 (942,000) 1,108,000 3,790,000 5,343,000 5,160,000 5,806,000 5,413,000 5,850,000 5,477,000 5,781,000
SRF Debt Reserve Requirement 3,110,000
__________ 3,110,000
__________ 3,110,000
__________ 3,110,000
__________ 3,110,000
__________ 3,110,000
__________ 3,110,000
__________ 3,110,000
__________ 3,110,000
__________ 3,110,000
__________ 3,110,000
__________
16
Total 4,774,000 2,168,000 4,218,000 6,900,000 8,453,000 8,270,000 8,916,000 8,523,000 8,960,000 8,587,000 8,891,000
Minimum Reserve Target: 25% O&M + $1M CIP 2,621,000 2,673,000 2,879,000 2,951,000 3,027,000 3,106,000 3,188,000 3,275,000 3,365,000 3,460,000 3,559,000
Debt Service Coverage (Min > 1.10x) 0.97 0.74 1.87 1.80 1.76 1.86 1.96 2.03 2.09 2.13 2.15Figure 5 shows a projection of annual revenues and expenses based on the cash flow projections for
Scenario B with a 5‐year phase in of rate increases coupled with reduced capital improvement funding in
the early years.
Figure 5: Projected Revenues & Expenses
BARTLE WELLS ASSOCIATES 17
City of Paso Robles Wastewater Rate Study4 WASTEWATER ACCOUNTS & USAGE
4.1 Wastewater Accounts
The City’s wastewater utility currently serves a little under 10,000 total connections. Table 7 shows a
breakdown of customers in the Single Family Residential class which also include duplexes, triplexes and
four‐plexes. Single Family Residential customers account for approximately 92% of the total number of
wastewater connections.
Table 7. Single Family Residential Customers
Number of Dwelling Total
Accounts Units per Acct Dwelling Units
Single Family 8,795 1 8,795
Duplex 190 2 380
Triplex 114 3 342
4‐Plex 55
______ 4 220
______
Total 9,154 9,737
Source: Based an analysis utility billing data as of September 2020.
Commercial accounts (which include institutional and multi‐family residential buildings with five or more
dwelling units) account for about 8% of the total number of connections. Table 8 shows the number of
Commercial accounts and corresponding 3/4‐inch Meter Equivalents by water meter size based on
standard meter capacities from the American Water Works Association. Each 3‐inch meter, for example,
has the same capacity as ten 3/4‐inch meters.
Table 8. Commercial Accounts by Meter Size & Meter Equivalents
Meter Meter Number Max Flow Capacity 3/4" Meter
Code Size of Accts Capacity* Ratios* Equivalents
75B 3/4‐inch 392 30 1.00 392.0
1B 1‐inch 156 50 1.67 260.0
15B 1.5‐inch 91 100 3.33 303.3
2B 2‐inch 125 160 5.33 666.7
3B 3‐inch 19 300 10.00 190.0
4B 4‐inch 11 500 16.67 183.3
6B 6‐inch 1 1000 33.33 33.3
8B 8‐inch 0
______ 1600 53.33 0.0
_______
Total 795 2,028.7
* AWWA standard meter capacities and capacity ratios
Source: Based an analysis utility billing data as of September 2020.
BARTLE WELLS ASSOCIATES 18
City of Paso Robles Wastewater Rate Study4.2 Wastewater Discharge
Table 9 shows projected billable wastewater discharge by month based on slightly conservative
estimates developed from analysis of historical billing data from recent years. Billed sewer use in the
prior and current fiscal years has been impacted by Covid‐19 which may result in temporarily reduced
levels of commercial use and increased levels of residential use.
Table 9. Single Family Residential Customers
JUL AUG SEP OCT NOV DEC JAN FEB MAR APR MAY JUN TOTAL
Single Family Residential (1‐4 Units)
Billed Monthly Use (hcf) 56,000 56,000 56,000 53,000 52,000 51,000 50,000 50,000 50,000 51,000 52,000 53,000 630,000
Commercial/Multifamily
Billed Monthly Use (hcf) 44,000 44,000 44,000 42,000 42,000 40,000 38,000 38,000 38,000 38,000 40,000 42,000 490,000
Total 100,000 100,000 100,000 95,000 94,000 91,000 88,000 88,000 88,000 89,000 92,000 95,000 1,120,000
Source: Slightly conservative estimates based on analysis of historical City utility billing data.
Note: FY2020/21 residential billed use expected to be a little higher due to a temporarily higher Sewer Billing Basis.
Figure 6 shows a distribution of average monthly winter water use for single family residential customers
based on data from December 2019 through February 2020, the period used to determine each
customers’ sewer billing basis for wastewater charges in the current fiscal year.
Figure 6: Single Family Residential Winter Water Use
BARTLE WELLS ASSOCIATES 19
City of Paso Robles Wastewater Rate StudyYou can also read