A First Implementation of Underwater Communications in Raw Water Using the 433 MHz Frequency Combined with a Bowtie Antenna - MDPI
←
→
Page content transcription
If your browser does not render page correctly, please read the page content below
sensors
Article
A First Implementation of Underwater
Communications in Raw Water Using the 433 MHz
Frequency Combined with a Bowtie Antenna
Samuel Ryecroft 1 , Andrew Shaw 1, *, Paul Fergus 1 , Patryk Kot 1 , Khalid Hashim 1 ,
Adam Moody 2 and Laura Conway 2
 1    Built Environment and Sustainable Technologies (BEST) Research Institute, Liverpool John Moores
      University, Liverpool L3 3AF, UK; S.P.Ryecroft@2012.ljmu.ac.uk (S.R.); P.Fergus@ljmu.ac.uk (P.F.);
      P.Kot@ljmu.ac.uk (P.K.); K.S.Hashim@ljmu.ac.uk (K.H.)
 2    United Utilities, Warrington WA5 3LP, UK; Adam.Moody@uuplc.co.uk (A.M.);
      Laura.Conroy@uuplc.co.uk (L.C.)
 *    Correspondence: A.Shaw@ljmu.ac.uk; Tel.: +44-151-231-2420

 Received: 14 March 2019; Accepted: 13 April 2019; Published: 16 April 2019

 Abstract: In 2016, there were 317 serious water pollution incidents in the UK, with 78,000 locations
 where businesses discharge controlled quantities of pollutants into rivers; therefore, continuous
 monitoring is vital. Since 1998, the environment agency has taken over 50 million water samples for
 water quality monitoring. The Internet of Things has grown phenomenally in recent years, reaching
 all aspects of our lives, many of these connected devices use wireless sensor networks to relay
 data to internet-connected nodes, where data can be processed, analyzed and consumed. However,
 Underwater wireless communications rely mainly on alternative communication methods such as
 optical and acoustic, with radio frequencies being an under-exploited method. This research presents
 real world results conducted in the Leeds and Liverpool Canal for the novel use of the 433 MHz radio
 frequency combined with a bowtie antenna in underwater communications in raw water, achieving
 distances of 7 m at 1.2 kbps and 5 m at 25 kbps.

 Keywords: Bowtie Antenna; Under Water Wireless Sensor Network; Underwater Communication;
 Sensor Networks; Water Pollutants; Water Quality

1. Introduction
     Water quality is tightly monitored and regulated in the UK, with legislation covering both drinking
water [1] and natural water resources such as rivers, lakes and reservoirs [2]. In 2016, 86% of river
water bodies had not reached a good ecological status, with the leading reason being agriculture,
rural land management, water industry and urban and transport pressures. In 2016, there were a
total of 317 serious water pollution incidents in the UK, with water industry being responsible for
60 incidents [3]. In the UK, 55% of water abstracted from freshwater was for use in the public water
supply [4]. Current monitoring approaches rely on manual collection of samples with processing
taking part in a centralized lab location, this leaves gaps between samples collection where areas are
not monitored. There is a need for a continuous monitoring approach to provide a better technique for
reducing the dependency on manual sample collection.
     The proposition of an alternative communication method for Underwater Wireless Sensor
Networks (UWSNs), could have an impact on areas such as environmental monitoring, combining
developments in sensing technologies for substances, including nitrates [5], heavy metals and
bacteria [6], carbonyl compounds [7] and dissolved oxygen [8]. Other areas such as industry,

Sensors 2019, 19, 1813; doi:10.3390/s19081813                                      www.mdpi.com/journal/sensors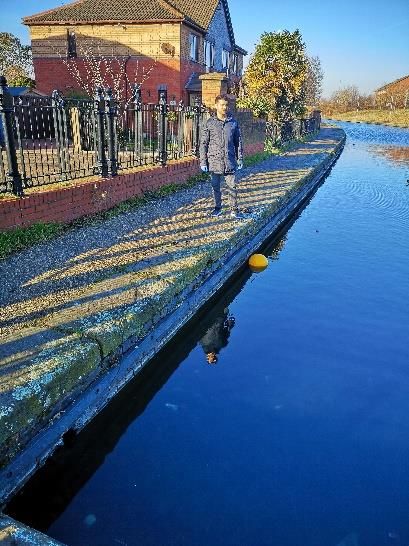
Sensors 2019, 19, 1813                                                                             2 of 10

including offshore oil and renewable energy, wave energy harvesting, and defense, such as costal
monitoring, as well as water utility companies could benefit from the proposed monitoring technique.
     Wireless communications underpin many modern technologies that have become pervasive in
modern life, from mobile phones to home wireless networks. The same communication technologies
also underpin the operation of many internet-connected devices, forming part of the IoT (Internet
of Things) and the Industrial Internet of Things (IIoT). The IoT market worldwide is predicted to
reach a value of $457.29 billion by 2020 [9]. With applications of IoT technologies being applied
in a range of industries from smart energy meters to intelligent agriculture. While the adoption of
IoT in conventional environments has thrived, there has been little development in IoT applications
in underwater environments, with one of the issues being underwater wireless communications
being non-trivial.
     If an effective communication method in (Underwater Wireless Sensor Networks (UWSNs) were
achieved, applications could include a network of water quality monitoring sensors connected through
an UWSN to a wider internet connection or private network to allow for the development of a smart,
continuous water quality monitoring system. Such a system could enable remote monitoring of key
water quality metrics and allow for the automation of processes within water treatment works to
adjust to incoming water properties, and in cases where water quality is unsuitable for processing, an
automated shutoff of the water intake.
     Many aspects of WSNS can be transferred and applied to UWSNs, and considerations such as
security [10,11], energy-efficient routing approaches [12–14], and application layer protocols [15,16]
have all been considered in detail with a vast amount of coverage in existing works. Little work has
been carried out into the area of underwater wireless communication methods, for which Wireless
Sensor Networks (WSNs) and UWSNs differ, with WSNs primarily using Radio Frequency (RF), and
UWSNs tending to use acoustic and optical communications.
     At present, RF communication is not widely used in a UWSNs; instead, methods such as acoustic
and optical are used. Factors impacting UWSNs are highlighted in research conducted by both X.
Che et al. [17] and S. Ryecroft et al. [18]. Some research has explored using RF at other frequencies
in underwater environments, such as the work conducted by Lloret et al. [19], which achieved
communication at 20 cm at up to 11 Mbps using a frequency of 2.4 GHz. Rubino et al. [20] examined
the use of a frequency of 868.3 MHz and FSK (Frequency Shift Keying) to transmit compressed images.
The experimental work was undertaken in a controlled environment using a water pool. The proposed
research was able to achieve data rates of 4.9 KB/s at distances of up to 5 m with some packet loss.
Other research undertaken by A. Shaw et al. [21] investigated the use of lower frequencies using a loop
antenna design; the results achieved distances of over 90m using frequencies of 3.5 MHz, 4.7 MHz
and 5 MHz with the results being achieved by combining a loop antenna with a directional design,
meaning that alignment between the two antennas is required. These results were also achieved using
a highly tuned antenna that would not function outside of water.
     Previous research by A. A. Abdou et al. [22,23] explored using the 433 MHz frequency to
communicate in an underwater environment, and this work showed that a 433 MHz signal could be
transmitted and detected at distances of up to 30 m using bowtie antennas. The work made use of
a bowtie antenna, also known as a Bifin antenna, to communicate at distances of over 30 m. Bowtie
antennas are a simplified form of a log-periodic toothed planar antennas. Bowtie antennas are the
planar version of the finite biconical antenna. Bowtie antennas have a bidirectional pattern, with
broad main beams perpendicular to the plane of the antenna, and are linearly polarized [24]. Work by
A. Shaw et al. [21] investigated the use of loop antennas, which are highly directional, making them
ideal for the formation of point to point links, but being of little use in underwater sensor networks in
long term deployments.
     Underwater wireless sensor networks currently utilize two communication methods, optical
modulates a light source, which is then detected by a photodiode. The second communication approach
commonly used is acoustic communication, which encodes data through the modulation of a sound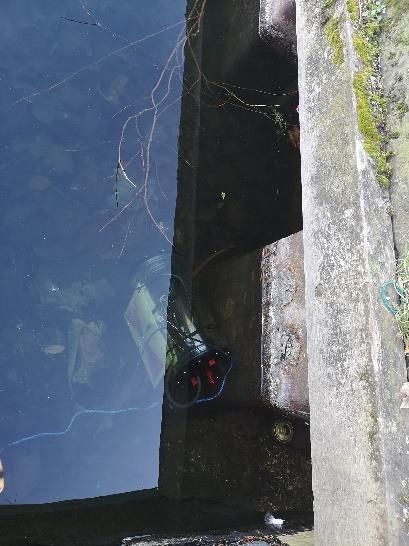
Sensors 2019, 19, 1813                                                                             3 of 10

wave. Optical communication can offer significant data rates of up to 500 Mbps at distances of up
to 150 m using commercial products such as the Bluecomm 5000 series [25]. Optical provides a
point-to-point link, which requires alignment between two nodes, communication speeds and distances
can be impacted by the alignment as well as other factors such as optical clarity of water and turbidity.
     Commercial acoustic communication devices such as the Teledyne marine 900 series [26] offer data
rates from 80 bps up to 15,360 bps, depending on configuration and encoding methods, at operating
distances of 2 km to 6 km. Acoustic communication offers the ability to implement a broadcast topology
unlike optical, and investigations undertaken by Codarin, A et al. [27] and research carried out by
Peng, C et al. [28] have both highlighted issues surrounding the introduction of noise into a marine
environment, including impacting predator–prey balances, damaging hearing of marine wildlife,
and disrupting reproductive cycles. Acoustic communications also suffer when operating in noisy
environments, such as in offshore drilling, where noise poses an issue for acoustic communications.
Acoustic communications also suffer when deployed in shallow water, with issues such as reverberation
impacting on data rates and distances.
     RF communication can offer higher data rates. The Nyquist theorem [29] states that if the
rate of an original signal transmission is 2B, then a signal with frequencies no greater than B is
sufficient to carry the signal rate. In cases of binary data, the maximum transmission rate can be
calculated using the calculation of B Hz is 2B bps. It is possible to achieve higher data rates using a
multi-level transmission in which case the calculation becomes 2B log2 M. In non-perfect environments,
the maximum data rate that can be achieved in a given communication channel is constrained by factors
such as signal-to-noise ratio. The Shannon-Hartley Theorem [30] combines the work of Hartley [31],
which provides calculations for the amount of information per second that can be encoded into a
given bandwidth. Shannon-Hartley builds on this work by including signal-to-noise ratio, allowing
Equation (1) to be derived:
                                         C = B log2 (1 + SNR)                                        (1)

     C = channel capacity (bits per second)
     B = Bandwidth of the channel (Hz)
     SNR = Signal-to-noise ratio.

      In addition to increased data rates, RF communication also offers advantages such as a reduced
setup complexity of the network due to there being no need for alignment when using an omnidirectional
antenna design. RF communication is also unaffected by factors such as water turbidity, unlike optical
communications. RF communication is also immune to the impacts of environmental noise and is not
impacted by shallow waters, unlike acoustic communications, which can suffer from the reverberation
of transmitted signals impacting the achievable data rates or even stopping communication completely.
RF communication combined with an omnidirectional antenna design such as the bowtie antenna
enables an easier setup process that supports a mesh network topology. RF communication also offers
superior data rates to those offered by acoustic communications. RF communication can cross the water
air boundary allowing for data transmission between submerged network nodes and non-submerged
network nodes. The design of the bowtie antenna demonstrated in this research also allows for
communication in both air and water due to the ultra-wide band design.

2. Materials and Methods
     Initial lab-based experimentation was undertaken in a controlled environment set to establish
the impact that the conductivity of water would have on the attenuation of the RF signal as it passed
through the water. Experiments were conducted in a small container with antennas separated at set
intervals. A HopeRF 69 HW transceiver module produced by Shenzen HOPE Microelectronics Co,
Shenzen, China combined with an Atmel 328p micro controller, Microchip Technology, Chandler,
USA were used to produce a continuous signal at 433 MHz, a Hameg HMS 3000 spectrum Analyzer,
manufactured by Hameg instruments, Mainhausen, Germany was used to measure the received signal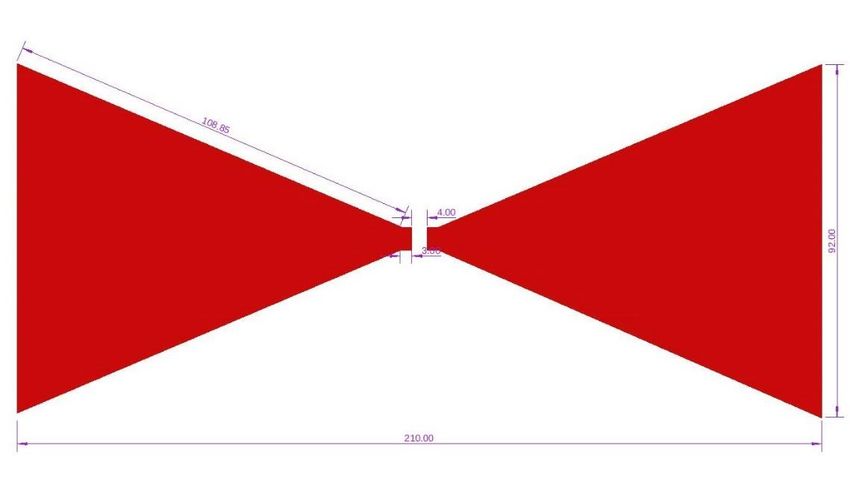
Sensors 2019, 19, 1813 4 of 10
Sensors 2019, 19, x FOR PEER REVIEW 4 of 10
were usedAthroughout
strength. the experimental
pair of matched work,
Bowtie antennas each antenna
designed for usewaswithcoated
the 433with
MHza frequency
layer of clear epoxy
were used
resin to protect
throughout the antenna surface
the experimental and stop
work, each conduction
antenna was coatedacross
withthe two poles
a layer ofepoxy
of clear the antenna.
resin to protect
The bowtie
the antenna antennas
surface usedconduction
and stop throughout experiments
across the two were
polesdesigned in Autodesk Eagle created by
of the antenna.
Auto TheDesk, San Rafael,
bowtie antennas USA and
used printed using
throughout a chemical
experiments were etching process
designed onto FR4Eagle
in Autodesk PCB created
Producedby
by
AutoC.I.F, Buc,
Desk, France
San with
Rafael, USA substrate withusing
and printed a thickness of 1.5etching
a chemical mm and a copper
process ontothickness of 35 µ m. by
FR4 PCB Produced A
layer of epoxy
C.I.F, Buc, France resin
withwas applied
substrate toathe
with exposed
thickness copper
of 1.5 mm and facea of the antenna,
copper thicknesswith
of 35 aµm.
thickness
A layerof
of
approximately
epoxy resin was0.8 mm. The
applied design
to the of the
exposed antenna
copper face and
of thethe dimensions
antenna, with a(in mm) used
thickness are shown in
of approximately
Figure
0.8 mm.1. The
Thedesign
bowtieofantenna used and
the antenna wasthe
based on designs
dimensions (in used
mm) in previous
used research
are shown undertaken
in Figure by A.
1. The bowtie
A. Abdou
antenna et al.
used was[22,23]
basedusing the 433used
on designs MHzinfrequency.
previous research undertaken by A. A. Abdou et al. [22,23]
using the 433 MHz frequency.
Figure 1. Bowtie antenna design with dimensions in mm.
Figure 1. Bowtie antenna design with dimensions in mm.
The water within the tank had an initial conductivity of 0.2 mS/cm, the conductivity in the tank
The water
was raised using within the tank
sea salts. had an initialofconductivity
The conductivity of 0.2 mS/cm,
a 1 molar solution was used thetoconductivity
calculate thein the tank
amount of
was raised
sea salts using sea
required salts.the
to raise The conductivity
conductivity byof
thea desired
1 molaramount,
solutionthewascorrect
used to calculate
weight thewas
of salts amountthen
of sea salts
added to therequired to raise
water tank andthetheconductivity
tank agitatedby to the desired
dissolve theamount, the correct weight
salts. Conductivity readings of were
salts then
was
then
takenadded
with atoHanna
the water tank and98188
Instruments the tank agitated tometer
conductivity dissolve the salts.
at each cornerConductivity
and the center readings were
of the water
then
takentaken withthat
to ensure a Hanna Instruments
conductivity of the98188
waterconductivity
was correct acrossmetertheat each
wholecorner
tank. and the center of was
The conductivity the
water
raised taken to ensure
to 0.4 mS/cm, that conductivity
0.6 mS/cm, 0.8 mS/cm, of the water
1 mS/cm and 5.2was correct
mS/cm; by across the whole
comparison, normal tank.
levelsTheof
conductivity
conductivity was raised to
in drinking 0.4 mS/cm,
water 0.6 mS/cm,
are limited 0.8 mS/cm,
by legislation to 0.251 mS/cm
mS/cm and 5.2 mS/cm;
seawater hasbyacomparison,
conductivity
normal levels of conductivity
of approximately 40 mS/cm. in drinking water are limited by legislation to 0.25 mS/cm and seawater
has a The
conductivity
two antennas of approximately
were suspended 40 and
mS/cm.
separated at distances between 10 cm and 50 cm, inclusive,
The two antennas were suspended
with readings taken at 5 cm intervals. The transmitting and separated
antennaat distances
remained between
stationary10 cm the
while andreceiving
50 cm,
inclusive,
antenna was with readings
moved taken
further at 5 Once
away. cm intervals.
moved the Theantennas
transmittingwereantenna remained
left for settle for at stationary while
least one minute
the receiving
to ensure thatantenna
the signal was moved further
stabilized. away.
A reading wasOncetakenmoved
from thethespectrum
antennasanalyzer
were leftfor foreach
settle for at
position
least one minute to ensure that the signal stabilized. A reading was taken
the antenna was placed in before the antenna was moved to the next position. Readings were taken from the spectrum analyzer
for each for
10 times position the antenna
each position at eachwas placed in before
conductivity level. the antenna was moved to the next position.
Readings
Afterwere taken 10 times
the completion for each position
of lab-based at eachfield
work initial conductivity
tested was level.
undertaken at the end of the
After the completion of lab-based work initial field
Liverpool Canal. Testing was undertaken in this environment to examine how tested was undertaken at the end would
signals of the
Liverpool
propagate Canal.
and carry Testing was undertaken
in a real-world in thisover
environment environment
larger areas to and
examine how signals
distances. The field would
trials
propagate and carry in a real-world environment over larger areas
used a microcontroller combined with a HopeRF69 HW transceiver produced by Shenzen HOPEand distances. The field trials used
aMicroelectronics
microcontrollerCo, combined
Shenzen, China;with athe HopeRF69
hardware HW transceiverto produced
was connected a temperature by and
Shenzen
depth HOPEsensor
Microelectronics
to collect data that Co,could
Shenzen, China; the from
be transmitted hardware was connected
one node to another,toanda temperature
the experiment and depth
collectedsensor
the
to collect data that could be transmitted from one node to another, and the
received signal strength. The sensor nodes were deployed at varying distances along the canal edge, experiment collected the
received signal strength.
and the sensor node wasThe leftsensor
in place for +/−
nodes were1 deployed
min to allow at varying
the waterdistances
to settlealong
beforethereadings
canal edge, for
and the sensor node was left in place for +/− 1 minute to allow the water to settle before readings for
10 transmissions were taken. Once readings had been taken, the receiving node was moved to the
next reading location and redeployed. The distances and average readings can be seen in Table 2.Sensors 2019, 19, 1813 5 of 10
10 transmissions were taken. Once readings had been taken, the receiving node was moved to the next
reading location and redeployed. The distances and average readings can be seen in Table 1.
Table 1. Results from field work with averages for the 1.2 kbps, 25 kbps and the overall average,
where applicable.
Standard Standard
1.2 kbps 25 kbps Overall
Distance (m) Deviation Deviation
Average (dBm) Average (dBm) Average (dBm)
1.2 kbps (dBm) 25 kbps (dBm)
1 −49.00 −46.00 −47.50 5.71547607 2.692582
2 −69.33 −72.00 −70.67 3.8586123 3.674235
3 −87.33 −88.33 −87.83 3.68178701 3.832427
4 −87.67 −94.00 −90.83 1.24721913 5.612486
5 −107.00 −106.33 −106.67 2.1602469 1.581139
6 −109.67 N.A N.A 1.24721913 N.A
Sensors 2019,719, x FOR PEER REVIEW
−110.33 N.A N.A 0.47140452 N.A 5 of 10
Experiments were undertaken using On-Off Keying (OOK) modulation at two baud rates:
Experiments
1.2 kbps wereto
and 25 kbps undertaken
allow for using On-Off Keying
a comparison of how (OOK)
baudmodulation
rates impact at two baud
on the rates: 1.2 kbps
communication
distances that can be achieved. OOK modulation encodes digital data using either the distances
and 25 kbps to allow for a comparison of how baud rates impact on the communication presence ofthat
a
can be achieved. OOK modulation encodes digital data using either the
frequency or not to encode binary data. OOK modulation was chosen due to the simplicity of presence of a frequency or not
to encode and
operation binary
doesdata.
not OOK
depend modulation
on factorswas suchchosen due to the
as frequency simplicity
or phase of theofcarrier
operation
wave.and does not
depend on factors such as frequency or phase of the carrier wave.
During the field testing, the temperature of the water was measured using a TSYS01 temperature
sensorDuring the field testing,
manufactured the temperature
by TE connectivity, of the water
Schaffhausen, was measured
Switzerland and using a TSYS01astemperature
was averaged 6.1 °C. The
sensor manufactured by TE connectivity, Schaffhausen, Switzerland
conductivity of the water was measured as 0.51 mS/cm using a Hanna Instruments and was as 6.1 ◦ C.
averaged HI933000
The conductivity
conductivity meterofmanufactured
the water wasbymeasured as 0.51 mS/cm
Hanna Instruments, using a Hanna
Woonsocket, USA. Instruments HI933000
conductivity meter manufactured by Hanna Instruments, Woonsocket, USA.
For each baud rate an estimated maximum distance was established by moving the receiving
For until
antenna each data
baudwasrateno anlonger
estimated maximum
received, these distance
maximum was established
distances by moving
provide the receiving
the furthest distance
tested. The receiving antenna was placed at 1 m separation intervals and left to settle for 1distance
antenna until data was no longer received, these maximum distances provide the furthest minute
tested. aThe
before receiving
Received antenna
signal wasindication
strength placed at 1(RSSI)
m separation intervals
reading was and left
recorded. Eachto reading
settle forwas
1 min before
taken on
a Received signal strength indication (RSSI) reading was recorded. Each reading
three separate occasions and an average taken, the results for both baud rates are provided in Table was taken on three
separate occasions and an average taken, the results for both baud rates are provided in Table 1.
2.
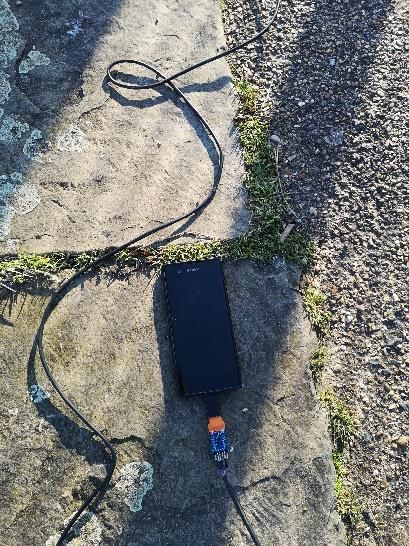
Figure 22 shows
Figure shows images
images of of the
the experimental
experimental fieldfield setup
setup and
and site,
site, Figure
Figure 2a2a shows
shows thethe setup
setup with
with
the two
the two communication
communicationnodes nodesdeployed,
deployed,FigureFigure2b2bshows
shows thethe connection
connection of of
thethe receiving
receiving node
node to
to an
an android smart phone using a serial adapter to capture result, Figure
android smart phone using a serial adapter to capture result, Figure 2c shows the submerged 2c shows the submerged
transmitting node.
transmitting node.
(a) (b) (c)
Figure
Figure 2.
2. (a)
(a) experimental
experimental setup;
setup; (b)
(b) Data
Data capture
capture device;
device; (c)
(c) Submerged
Submerged sensor node.
3. Results and Discussion
The results from the lab-based experiments provided in Table 1 follow the established principle
that the conductivity of the water through which the signal passes have an impact on signal loss. The
signal loss was particularly noticeable in water with a conductivity of 5.2 mS/cm, with significantSensors 2019, 19, 1813 6 of 10
3. Results and Discussion
The results from the lab-based experiments provided in Table 2 follow the established principle
that the conductivity of the water through which the signal passes have an impact on signal loss.
The signal loss was particularly noticeable in water with a conductivity of 5.2 mS/cm, with significant
additional losses being observed. It is likely that these initial experiments were based on near field
power rather than far field power. Near-field power is normally observed at distances of up to
1 wavelength and decays much faster than far field power.
Table 2. Signal losses for distances between 10 cm and 50cm at different conductivity levels.
Distance 0.4 mS/cm 0.6 mS/cm 0.8 mS/cm 1.0 mS/cm 5.2 mS/cm
(cm) (dBm) (dBm) (dBm) (dBm) (dBm)
10 −27.38 −24.34 −25.15 −24.9 −38.74
19, x FOR PEER−25.675
Sensors 2019, 15 REVIEW −22.06 −23.5 −23.7 −33.61 6 of 10
20 −28.33 −26.14 −28.09 −28.95 −46.27
25
10 −30 −27.38 −28.45
−24.34 −29.44−25.15 −29.97
−24.9 −47.64
−38.74
30 −33.87 −30.26 −32.2 −34.13 −51.57
15 −25.675 −22.06 −23.5 −23.7 −33.61
35 −41.4 −34.21 −35.51 −36.22 −48.5
20
40 −41.527−28.33 −26.14
−38.99 −38.01−28.09 −28.95
−41.87 −46.27
−50.58
25
45 −41.38 −30 −28.45
−44.44 −42.1−29.44 −29.97
−43.53 −47.64
−51.7
50
30 −46.02 −33.87 −44.98
−30.26 −43.87−32.2 −44.48
−34.13 −50.69
−51.57
35 −41.4 −34.21 −35.51 −36.22 −48.5
40 −41.527 −38.99 −38.01 −41.87 −50.58
Figure 3 shows a plot of the averaged data collected from the lab-based experimentation.
45
The standard deviation between−41.38
the ten readings−44.44 −42.1
for each conductivity and−43.53 −51.7
distance combination, in all
50 −46.02 −44.98 −43.87 −44.48 −50.69
cases the standard deviation showed that all results fell within +/− 3 dBm and in most cases fell within
+/− 1 dBm.
Figure3.3.AAgraph
Figure graphshowing
showingthe
thesignal
signalloss
lossacross
acrossdistances
distanceswith
witha arange
rangeofofconductivities.
conductivities.
The
Thehardware
hardwareplatform
platform developed
developed for further experimentation
for further experimentationhad hadaatransmission
transmissionpower
powerofof14
14dBm
dBmand andwas
wascapable
capableof ofreceiving
receiving signals
signals at
at signal
signal power −120
power of −120 dBm. It is however, importanttoto
of dBm. It is however, important
consider
considerlosses
lossesthat
thatwill
willtake
takeplace due
place duetoto
coupling
couplingboth
bothonon
thethe
transmitter and
transmitter andthethe
receiver, making
receiver, it
making
likely that the power transmitted will be lower.
it likely that the power transmitted will be lower.
Field-based
Field-basedworkworkidentified
identifiedthat
thatthe
thebaud
baudrate
rateused
usedduring
duringcommunication
communicationhad hadaadirect
directimpact
impact
ononthethecommunication
communication ranges
rangesthat were
that achievable
were in real
achievable world
in real environments
world with higher
environments baud rates
with higher baud
rates having a negative impact on the achievable communication distances. This is due to the weaker
signal being harder to distinguish from the background RF noise. Slower baud rates improve the
ability of the receiver to distinguish the transmission from the spectral noise. The maximum
communication rate of a given channel can be calculated using the Shannon-Hartley Therom, which
provides a theoretical maximum bitrate that can be achieved over a given channel given theSensors 2019, 19, 1813 7 of 10
having a negative impact on the achievable communication distances. This is due to the weaker signal
being harder to distinguish from the background RF noise. Slower baud rates improve the ability of
the receiver to distinguish the transmission from the spectral noise. The maximum communication rate
of a given channel can be calculated using the Shannon-Hartley Therom, which provides a theoretical
maximum bitrate that can be achieved over a given channel given the bandwidth, signal power and
signal-to-noise ratio.
The results from the field work can be seen in Table 1, showing the distance tested and the average
received RSSI for each for the two baud rates tested as well as a combined average where applicable.
The results in Table 1 shows that signal degradation is similar between the two baud rates, which
is to be expected, as baud rate does not impact on the signal itself, but rather the ability to distinguish
the signal from background noise. The results follow the principle of the Shannon-Hartley theorem
that state as a received signal strength weakens the baud rate must be lowered to allow for the signal
to be distinguished from the background noise.
The results provided in Table 1 present an average of the data collected during field work based
on three separate deployments of the sensor node, the standard deviation of the data was calculated,
across baud and distance combinations using the three data points collected. The standard deviation
showed that in most cases, there was a standard deviation of 5 dBm and with the remaining readings
having a standard deviation of no more than 5.7 dBm.
The results show that the reduction of baud rate allows an improved range to be achieved, with
an increase of 40% being achieved. This suggests that the signal-to-noise ratio past 5 m makes reliable
higher baud rate communication impossible, but still allows lower baud rate communications extend
the communication distance further. These results indicate that lower baud rates could further increase
transmission ranges.
The results indicated that the distances achieved could be extended in two ways to allow for
greater communication distances. The first would be to identify a more powerful transmitter or amplify
the output signal of the current transited module. Amplifying the signal may increase the amount of
noise within the signal, which may in turn impact of the reliability of the encoding of data used. Since
OOK depends on the presence or lack of presence of a frequency, it is likely that amplification would
have less of an impact on the encoded data than other methods available. Alternatively, a further
reduction on baud rate could further increase the communication range achievable at the expense of
data rates. It is likely that a combination of these two approaches would yield significantly improved
ranges by providing a stronger signal to begin with as well as improving the ease of identification of
the signal from background noise.
The experimental work indicated that a baud rate of 25 kbps could be used to achieve
communication at distances of 5 m in real world conditions. This provides the option of high-speed
shorter-range wireless communication that could be applied to a range of applications such as the
transmission of images and short-range control of UAVs.
The field work indicated that the slower baud rate of 1.2 kbps could be used to achieve
communication at distances of up to 8 m providing a range of opportunities in a variety of fields
such as in the development of a multimode underwater environmental monitoring system for areas
such as reservoirs. Such a system would not require significant data rates, but demanding reasonable
communication distances to reduce the node density required to cover large monitoring areas.
The results indicate that a more in-depth protocol and wider supporting architecture targeted
at the 433 MHz spectrum could be developed that includes a form of link speed negotiation existing
wireless protocols such as Wi-Fi support link speed negotiation known as the physical layer rate. Such a
protocol could use lower data rates to identify nearby network nodes and begin a link speed negotiation
process with nodes adjusting data rates until a suitable data rate is achieved. Such a mechanism could
be used for a variety of applications in areas such as continuous environmental monitoring.
Existing research has already shown that frequencies such as 868.3 MHz can be used in controlled
environment to communicate data at comparable distances, the results from Rubino et al. establish anSensors 2019, 19, 1813 8 of 10
effective communication rate of 4.9KB/s using the 868.3 MHz frequency, compared to the maximum
data rate examined in this study of 25 kbps equivalent to 3.125 KB/s, it is possible that future research
could further investigate increasing the data rates.
Other existing research such as Lloret et al. achieved significantly higher data rates of 11 mbps,
although at heavily reduced distances of 20 cm.
Existing solutions within optical underwater communication such as the bluecom 100 series offers
data rates of 5 mbps at distances of up to 5 m. The obtained results offer reduced data rates compared
to this optical communication method, but provides slightly improved distances at lower data rates
than mentioned product. In addition, proposed technique overcome existing limitations with the
optical communication.
Other solutions such as acoustic communication the Teledyne marine 900 series offers significantly
better ranges than the results obtained with communication distances of between 2 km and 6 km;
however, data rates achieved during field work show significantly better data rates, with baud rates of
between 140 bps to 15,360 bps being offered by the Teledyne marine 900, compared to the baud rates of
1200 bps and 25000 bps achieved during experimental work.
It is possible for transmission distances to be improved further with alterations to the circuitry
being made to incorporate a higher power transmitter and a higher sensitivity receiver module;
however, short-range communications do have applications in localized sensor networks, where a
high density of nodes may be desirable. With commercial products offering link distances of 5 m and
data rates as low as 140 bps, it is clear there is a gap within the underwater communication area for
a solution that provides short communication distances at medium communication speeds with the
benefit of allowing a mesh topology with no need of alignment. The novelty of this research is to
deploy a distributed sensor network in shallow water for water security.
4. Conclusions
The results demonstrated that RF communications is achievable in a real-world environment at
distances of 5 m with data rates of 25 kbs and at distances of 7 m with a data rate 1.2 kbps, indicating
that RF communications can be used to communicate data in an underwater environment, which could
be used as the basis of forming an underwater wireless sensor network, with scope for improving
communication distances in a variety of ways in future research.
The research presents a novel application of 433 MHz communication in an underwater
environment using a bowtie antenna specifically designed to communicate in underwater environments
at a range of conductivities as well as in the air. The research findings are supported through field
trials in real world conditions with a varying conductivity of the water.
Author Contributions: P.K. and A.S. organised the conceptualization idea and methodology of this paper.
Following that, S.P.R., P.F. and K.H. worked on the data validation, formal analysis and investigation. The original
writing and draft preparation are done by S.P.R. and P.K. The review and editing was completed by A.S. A.M. and
L.C. This project is supervised under P.K., P.F. and A.S.
Funding: This research was funded by United Utilities, Warrington.
Conflicts of Interest: The authors declare no conflict of interest.
References
1. HM Government. The Water Supply (Water Qaulity) Regulations 2016; 2016; Volume 614, pp. 11–15, 36–42.
Available online: http://www.legislation.gov.uk/uksi/2016/614/contents/made (accessed on 15 April 2019).
2. HM Government. Water Resources, England and Wales. The Water Environment (Water Framework Directive)
(England and Wales) Regulations; 2017; Volume 407, p. 8. Available online: http://www.legislation.gov.uk/uksi/
2017/407/contents/made (accessed on 15 April 2019).
3. Environment Agency. The State of the Environment: Water Quality; 2018; pp. 1–2. Available online:
https://assets.publishing.service.gov.uk/government/uploads/system/uploads/attachment_data/file/709493/
State_of_the_environment_water_quality_report.pdf (accessed on 20 February 2019).Sensors 2019, 19, 1813 9 of 10
4. Environment Agency. The State of the Enviroment Water Resources; 2018; p. 9. Available online:
https://assets.publishing.service.gov.uk/government/uploads/system/uploads/attachment_data/file/709924/
State_of_the_environment_water_resources_report.pdf (accessed on 20 February 2019).
5. Cashman, S.; Korostynska, O.; Shaw, A.; Lisboa, P.; Conroy, L. Detecting the Presence and Concentration of
Nitrate in Water Using Microwave Spectroscopy. IEEE Sens. J. 2017, 17, 4092–4099. [CrossRef]
6. Clausen, H.C.; Dimaki, M.; Bertelsen, V.C.; Skands, E.G.; Rodriguez-Trujillo, R.; Thomsen, D.J.; Svendsen, E.W.
Bacteria Detection and Differentiation Using Impedance Flow Cytometry. Sensors 2018, 18, 3496. [CrossRef]
[PubMed]
7. Cheng, J.; Shao, J.; Ye, Y.; Zhao, Y.; Huang, C.; Wang, L.; Li, M. Microfluidic Preconcentration Chip with
Self-Assembled Chemical Modified Surface for Trace Carbonyl Compounds Detection. Sensors 2018, 18, 4402.
[CrossRef] [PubMed]
8. Zhang, Y.; Angelidaki, I. A simple and rapid method for monitoring dissolved oxygen in water with a
submersible microbial fuel cell (SBMFC). Biosens. Bioelectron. 2012, 38, 189–194. [CrossRef] [PubMed]
9. Market Pulse Report Internet of Things (IoT); GrowthEnabler: London, UK, 2017; p. 14.
10. Pathan, A.S.K.; Hyung-Woo, L.; Choong Seon, H. Security in wireless sensor networks: Issues and challenges.
In Proceedings of the 8th International Conference Advanced Communication Technology, Phoenix Park,
South Korea, 20–22 February 2006; pp. 329–334.
11. Hari, P.B.; Singh, S.N. Security issues in Wireless Sensor Networks: Current research and challenges.
In Proceedings of the International Conference on Advances in Computing, Communication, & Automation
(ICACCA) (Spring), Dehradun, India, 8–9 April 2016; pp. 1–4.
12. Manjeshwar, A.; Agrawal, D.P. TEEN: A routing protocol for enhanced efficiency in wireless sensor networks.
In Proceedings of the 15th International Parallel and Distributed Processing Symposium, San Francisco, CA,
USA, 23–27 April 2000; pp. 1–4.
13. Kodali, R.K.; Kiran A., V.S.; Bhandari, S.; Boppana, L. Energy efficient m- level LEACH protocol.
In Proceedings of the International Conference on Advances in Computing, Communications and Informatics
(ICACCI), Kochi, India, 10–13 August 2015; pp. 973–979.
14. Lindsey, S.; Raghavendra, C.S. PEGASIS: Power-efficient gathering in sensor information systems.
In Proceedings of the IEEE Aerospace Conference, Big Sky, MT, USA, 9–16 March 2002; pp. 1–6.
15. Truong, A.S.-C.a.H.L. MQTT For Sensor Networks (MQTT-SN) Protocol Specification. Available online:
http://mqtt.org/2013/12/mqtt-for-sensor-networks-mqtt-sn (accessed on 15 February 2019).
16. Bormann, C.; Lemay, S.; Tschofenig, H.; Hartke, K.; Silverajan, B.; Raymor, B. (Eds.) CoAP (Constrained
Application Protocol) over TCP, TLS, and WebSockets. In RFC 8323, 10.17487/RFC8323. Available online:
https://tools.ietf.org/id/draft-ietf-core-coap-tcp-tls-11.html (accessed on 15 February 2019).
17. Che, X.; Wells, I.; Dickers, G.; Kear, P.; Gong, X. Re-evaluation of RF electromagnetic communication in
underwater sensor networks. IEEE Commun. Mag. 2010, 48, 143–151. [CrossRef]
18. Ryecroft, S.P.; Shaw, A.; Fergus, P.; Kot, P.; Muradov, M.; Moody, A.; Conroy, L. Requirements of an underwater
sensor-networking platform for environmental monitoring. In Proceedings of the Developments in Esystems
Engineering, Cambridge, UK, 2–5 September 2018.
19. Lloret, J.; Sendra, S.; Ardid, M.; Rodrigues, J.J.P.C. Underwater Wireless Sensor Communications in the
2.4 GHz ISM Frequency Band. Sensors 2012, 12, 4237–4264. [CrossRef] [PubMed]
20. Rubino, E.M.; Centelles, D.; Sales, J.; Marti, J.V.; Marin, R.; Sanz, P.J. Wireless Image Compression and
Transmission for Underwater Robotic Applications? IFAC-Papers Online 2015, 48, 288–293. [CrossRef]
21. Shaw, A.; Al-Shamma’a, A.i.; Wylie, S.R.; Toal, D. Experimental Investigations of Electromagnetic Wave
Propagation in Seawater. In Proceedings of the 2006 European Microwave Conference, Manchester, UK,
10–15 September 2006.
22. Abdou, A.A.; Shaw, A.; Mason, A.; Al-Shamma’a, A.; Cullen, J.; Wylie, S.; Diallo, M. A matched Bow-tie
antenna at 433MHz for use in underwater wireless sensor networks. J. Phys.: Conf. Ser. 2013, 450, 012048.
[CrossRef]
23. Abdou, A.; Shaw, A.; Mason, A.; Al-Shamma, A.; Cullen, J.D.; Wylie, S. Electromagnetic (EM) wave
propagation for the development of an underwater Wireless Sensor Network (WSN). In Proceedings of the
2011 IEEE Sensors, Limerick, Ireland, 28–31 October 2011. [CrossRef]
24. Warren, L.; Stutzman, G.A.T. Antenna Theory and Design, 2nd ed.; John Wiley & Sons, INC: Hoboken, NJ,
USA, 2012.Sensors 2019, 19, 1813 10 of 10
25. Bluecomm. BlueComm Underwater Optical Communication-Sonardyne. Available online: https://www.
sonardyne.com/product/bluecomm-underwater-optical-communication-system/ (accessed on 1 January 2019).
26. Marine, T. Teledny Marine 900 series. Available online: http://www.teledynemarine.com/acoustic-modems
(accessed on 1 January 2019).
27. Codarin, A.; Wysocki, L.E.; Ladich, F.; Picciulin, M. Effects of ambient and boat noise on hearing and
communication in three fish species living in a marine protected area (Miramare, Italy). Mar. Pollut. Bull.
2009, 58, 1880–1887. [CrossRef] [PubMed]
28. Peng, C.; Zhao, X.; Liu, G. Noise in the Sea and Its Impacts on Marine Organisms. Int. J. Environ. Res. Public
Health 2015, 12, 12304–12323. [CrossRef] [PubMed]
29. Weik, M.H. (Ed.) Nyquist theorem. In Computer Science and Communications Dictionary; Springer US: Boston,
MA, USA, 2001. [CrossRef]
30. Shannon, C.E. Communication in the Presence of Noise. Proc. IRE 1949, 37, 10–21. [CrossRef]
31. Hartley, R.V.L. Transmission of Information. Bell Syst. Tech. J. 1928, 7, 535–563. [CrossRef]
© 2019 by the authors. Licensee MDPI, Basel, Switzerland. This article is an open access
article distributed under the terms and conditions of the Creative Commons Attribution
(CC BY) license (http://creativecommons.org/licenses/by/4.0/).You can also read