AIR QUALITY MONITOR AND FORECAST IN NORWAY USING NB-IOT AND MACHINE LEARNING - UTOPIA
←
→
Page content transcription
If your browser does not render page correctly, please read the page content below
Air Quality Monitor and Forecast in Norway
         using NB-IoT and Machine Learning

    Andreas Lepperød1 , Hai Thanh Nguyen1,2 ⋆ , Sigmund Akselsen2 , Leendert
               Wienhofen3 , Pinar Øzturk1 , and Weiqing Zhang2
              1
                  Norwegian University of Science and Technology (NTNU)
                                     2
                                       Telenor ASA
                           3
                             Trondheim Municipality, Norway

        Abstract. In recent years, air quality has become a significant environ-
        mental and health related issue due to rapid urbanization and industrial-
        ization. As a consequence, real-time monitoring and precise prediction of
        air quality gained increased importance. In this paper, we present a com-
        plete solution to this problem by using NB-IoT (Narrowband-Internet-of-
        Things) sensors and machine learning techniques. This solution includes
        our own compiled cheap micro-sensor devices that are planned to be
        deployed at stationary locations as well as on the moving vehicles to
        provide a comprehensive overview of air quality in the city. We devel-
        oped our own IoT data and analysis platform to support the gathering of
        air quality data as well as weather and traffic data from external sources.
        We applied seven machine learning methods to predict air quality in the
        next 48-hours, which showed promising results. Finally, we developed a
        mobile application named Lufta, which is now available in Google play
        for testing purposes.

        Keywords: Air Quality · Internet of Things · Machine Learning.

1     Introduction

Air quality has increasingly attracted attention from environment managers and
citizens all over the world. New tools continue to emerge to raise air quality
awareness worldwide. Continuous improvements in air quality monitoring are
occurring along with the advancements of smart cities and with the rapidly
increasing deployment of internet-of-things sensor devices. As a natural conse-
quence, air pollution forecasting has become a hot topic, aiming the prediction
of the atmospheric composition of pollutants at a given time and location. With
an accurate air quality forecast, individuals can take action to reduce the pos-
sible adverse effects of air pollution on their health, such as choosing the clean-
est routes for the commute or the best time for outdoor activities. From the
policy-making perspective, accurate forecasting contributes to better planning
and establishment of procedures to reduce the severity of local pollution levels.
⋆
    Corresponding Author
2 Lepperød et al.
Much effort has already been made by researchers to create accurate fore-
casting models capable of fitting the underlying time series, which is challenging
for various reasons. Often, air quality prediction involves a noisy and limited
amount of historical data, mainly due to the poor quality of sensors used. Fur-
thermore, the prediction of a single observation usually depends on many factors,
such as weather conditions, traffic flow, time of the week, and so on. Besides, the
air changes rapidly in short time frames, with hourly data being more uncertain
compared with monthly and yearly trends and seasonality. These problems make
it hard to generalize a created model to be transferable to other locations.
We studied air quality monitoring and forecasting in Trondheim, one of the
largest cities in Norway. Typically, and similar to many other cities in Scan-
dinavia, the air quality in Trondheim is on average at a healthy level but has
periods with severe pollution, especially in the winter months. This is mainly
because people drive a lot and use wood-burners during wintertime. Also, munic-
ipalities often put sand on the roads to make them less slippery under conditions
with snow and ice.
We developed a complete solution for air quality monitoring and forecast-
ing using Narrowband IoT (NB-IoT) and machine learning. Our holistic IoT
solution contains self-compiled micro-sensor devices, IoT data platform, and an-
alytics tools [1]. The solution aggregates different data sources and performs air
quality prediction by using machine learning methods. We also developed a mo-
bile application named Lufta [2] to visualize the air quality data as well as to
give users forecast information.
Our study demonstrates the benefits of machine learning for predicting gen-
eral patterns of air pollutants and foresees sudden spikes of a high pollution level.
The study has tested seven different machine learning algorithms for modeling
and forecasting the pollution of PM2.5 , PM10 , and NO2 . The data of pollutants,
and meteorological and traffic data with statistical temporal-spatial feature engi-
neering were taken into account to build models for multi-step-ahead air quality
forecasts for 24 and 48-hours. Results express that ensemble techniques could
significantly improve the stability and accuracy of the prediction of the general
trends of air quality. Among the ensemble techniques, gradient boosting with
dropouts resulted in prediction errors with the lowest deviation. For the predic-
tion of sudden changes in air pollution, using a recurrent neural network with
a memory unit provided the highest accuracy of classified spikes. Lastly, the
machine learning results were compared with that of the national air quality
services, which uses a knowledge-driven model. The predictions of general pat-
terns and anomalies are shown to be superior for 24-hour, and more comparable
results for the 48-hour forecasts. The data-driven approach is considered to be
an excellent complement for the knowledge-driven model.
2 State of the art on air quality prediction
Air quality prediction methods can be split into two main categories: classical de-
terministic models and data-driven models [3]. The traditional dispersion modelsAbbreviated paper title 3
consist of heavy domain knowledge of air quality behavior with expertise from
multiple areas among other on chemical, emission, and climatological processes.
These factors help to create complex numerical models to predict the future.
However, these dispersion models are computationally heavy and expensive in
maintenance. The second category refers to data-driven models, where various
machine learning methods have been applied to predict air pollution.
2.1 Influential variables
Due to the complexity of air quality behavior, it is crucial to include multiple
influential variables. In recent studies, several pollutants and meteorological vari-
ables have been included. The different pollutants are often PMx , NOx , SOx ,
COx , Ozone, and VOC. Meteorological variables are those which describe the
weather and the atmospheric composition. The most common meteorological
variables are temperature, pressure, humidity, and surface wind with speed and
direction. The meteorological variables vary from location to location and affect
air pollution differently. Various air pollutants and meteorological variables have
been extensively studied in the literature ([4], [6], [7], [8],[12], [13],[15]). Other
variables such as traffic [5] and weather forecast ([4], [6], [11], [16]) have been
investigated to find their relations with air quality changes.
2.2 Air quality prediction methods
Multiple research studies apply variations of Recurrent Neural Networks (RNN)
to capture temporal dependencies. [6] includes an LSTM model to learn short-
term and long-term temporal dependencies by using the weather forecast. [9]
adopts an LSTM solution on IoT sensor data to perform short-term prediction.
[12] provides a performance overview of different RNN cells and concludes that
GRU cell has a slightly higher accuracy of learning PM10 concentration. [13]
consists of an LSTM model that considers spatio-temporal relations for predict-
ing air quality concentrations. From their results comparing an extended LSTM
to SVR, deep learning-based models exhibit better prediction.
Multiple specialized multilayer perceptron (MLP) networks [11] were imple-
mented for each weather class, determined by clustering. They further learn the
relation between a high concentration of air pollutants and different weather
classes to improve the classification of sudden spikes. In [17], they show how
a deep learning regression model can learn patterns of pollutants and weather
data collected from 449 sensors all around Aarhus city in Denmark. Their DNN
model can outperform SVM in predictions of the next hour.
In [10], they use fuzzy inference of the results from an ensemble of random
forest (RF) and feed-forward neural network. They combine the power of a
non-linear relationship in a neural network and the averaging strategies of an
ensemble approach to generalize the results. [14] predicts daily NO2 exposure
and compares an RF model with an LR model at a national scale. [15] also
applied an RF model to predict PM2.5 with features including other pollutants4 Lepperød et al.
and meteorological variables. Their RF model shows better performance than
their implementation of a generalized additive model.
2.3 Norwegian air quality service
A new nationwide air quality information service was launched on December
18th, 2018 in Norway, by the Norwegian Environment Agency, which will be
referenced in this paper as MET [18]. Their urban EMEP (uEMEP) model is
a downscaling model of EMEP, a knowledge-driven model that calculates the
transboundary transport of air pollutants [19]. uEMEP initiates with low spatial
data (10km-2.5km resolution) from the EMEP model, which is scaled down to
an approximately 50m grid resolution based on proxy data from each grid. The
proxy data consist of meteorological forecasts, historical emissions and traffic
volume, and geographic variables. Each grid calculates its local contribution of
emissions and with a Gaussian model to find non-local concentrations.
Notable strengths of uEMEP are its consideration of all primary sources of air
quality pollution with a direct connection to weather forecasts and geographical
terrain. Although adding weather forecasts into the model is a strength, it can
also be a weakness if the forecasts deviate from the real values and thereby
induce warnings of too high or low air pollution levels.
3 Complete solution
This section introduces the complete solution we developed for air quality mon-
itoring and forecasting using NB-IoT and machine learning. The overall archi-
tecture is presented in Fig. 1.
Fig. 1. IoT pipeline.
3.1 Air quality NB-IoT sensor device
Recent progress in sensory and communication technologies has made the devel-
opment of portable air-quality micro-sensing devices feasible. For our project,Abbreviated paper title 5
a device consisting of a board with sensors and a communication modem was
compiled4 . The initial price of this device was around EUR 100, excluding costs
tied to writing software for the integration of parts. The sensors report levels of
particle dust (PM2.5 and PM10 ), temperature, humidity, CO2 equivalents, and
VOC equivalents. The communication modem includes a GPS module, and it
supports both LTE-M and NB-IoT connectivity5 . So far, only off-the-shelf low-
cost micro-sensors have been used in these designs. In the first version, a particle
sensor made by Honeywell was used6 .
The quality of data from micro-sensors has been questioned, and there is a
need for assessment of the sensors’ performance in varied applications and envi-
ronments. This need has been addressed by [20]. An initial test of the data quality
from the device compiled in this project (compared to an industrial sensor of
particle dust in the same location) was made, indicating that the measurements
were influenced by variations in temperature, humidity, and pollutant levels. A
thorough and systematic testing of the differences in performance between our
micro-sensor devices and the standardized industrial equipment over time re-
mains to be done. Based on the initial test, we decided to use data only from the
standardized industrial equipment for training the machine learning models (see
chapter 4). The plan for this project includes systematic testing of micro-sensor
devices with more expensive components and various designs, e.g., positioning
and structure of the inlet which tends to have a big impact on the measure-
ment quality of PM devices. Depending on the results of these tests a number of
micro-sensor devices will be deployed throughout the city and on vehicles. The
initial plan is in the range of 25-50 devices.
3.2 IoT data platform and analytics
The Lambda Architecture[21] is used in the design of the air quality data plat-
form. The architecture is a data-processing architecture designed to handle
massive quantities of data by taking advantage of both batch-processing and
stream-processing methods. It attempts to balance latency, throughput, and
fault-tolerance by using batch processing to provide comprehensive and accu-
rate views of batch data, while simultaneously using real-time stream processing
to provide views of online data. The IoT data platform adopts the Lambda Ar-
chitecture in its design to build a robust system that is fault-tolerant and able
to serve a wide range of workloads and low-latency reads and updates.
In this project, we use the Horde IoT data platform[1] (beta version) from
Telenor Exploratory Engineering team to support running NB-IoT devices ex-
periments quickly and efficiently. Horde handles data encryption and provides
backend services to manage IoT devices, inspect payloads, share devices between
4
https://blog.exploratory.engineering/post/where-the-air-is-crisp/
5
The modem is based on Nordic Semiconductor technology, see
https://www.nordicsemi.com/Products/Low-power-cellular-IoT/nRF9160 and
had an indicative price of USD 45, see https://shop.exploratory.engineering/
6
Honeywell HPM Series, Particle Sensor, 32322550, Issue E, using a light scattering
method. The price of this sensor measuring both PM2.5 and PM10 was less than 40
USD as of November 2018.6 Lepperød et al.
Fig. 2. Air quality micro-sensor devices mounted to buses and stationary locations
team members, and send data from the devices. Through Horde, users are able
to get data online quickly either as a WebSocket (for a simple single-page web
apps) or WebHooks (for a quick demo service), and into IFTTT (known as IF
This Then That[23], a free web-based service to create chains of simple con-
ditional statements, for quick prototypes and hackathons) or MQTT (Message
Queuing Telemetry Transport[22], for flexible and reliable delivery).
3.3 Mobile application for air quality monitoring and forecasting
The mobile application we developed, named Lufta, is now available in Google
Play for testing purpose [2]. The app analyses the aggregated data provided by
both sensors in stationary locations as well as sensors mounted to moving vehi-
cles. That gives users the possibility to have a better and real-time monitoring of
air quality in the areas where they live. In the app, users can also see recommen-
dations or set up to get notifications about the level of air quality, whether it is
good, moderate, or bad. We plan to provide the forecast information to users in
the app as well through APIs to third parties.
4 Experiment for exploring air quality prediction
This section describes the experiments performed in the project. First, in sub-
section 4.1, we introduce the experimental setting, including the description of
datasets, extracted features, machine learning methods used, and the evaluation
metrics. Next, the experiment results are presented in subsection 4.2.
4.1 Experimental settings
Dataset. Because of the unstable data provided by our micro-sensors during the
testing phase, we decided to do our experiments with the data from expensive
sensors given by the Norwegian Institute for Air Research through open APIsAbbreviated paper title 7
[24]. Four air quality stations are used in this research. Air quality in Trondheim
has improved due to initiatives taken by the municipality, such as road clean-
ing and dust suppression. Thus the data analysis and machine learning models
utilized data from January 2014 to April 2019 to avoid learning on too old data
with unrelated distributions.
The weather dataset consists mainly of the hourly data recorded at a station
at Voll in Trondheim, which includes features like temperature, precipitation,
humidity, pressure, wind speed, and wind direction. The traffic data consists of
traffic information on the road network in Trondheim. The traffic information
was included by taking the mean of the closest three traffic stations for each of
the locations predicted. The recorded variables are hourly vehicle count in both
driving directions. This paper uses the sum of the numbers of passing vehicles
in both driving directions and assumes that this sum of recordings is sufficient
for analyzing the relationship between traffic and air pollutants.
Fig. 3. Map of the data stations in Trondheim where red marks show air quality
stations, pink is a weather station, and blue (small and large) is traffic stations. The
numbers within the circles are indicators of the total number of stations in that area.
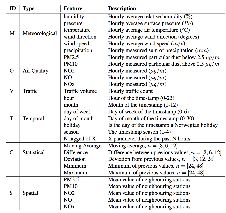
Extracted features. The extracted features are divided into different cate-
gories. See Fig.4 for an overview of all with their shorthand ID, type, feature,
and a short description. In this paper, we deal with three kinds of features that
measure some qualities in nature (meteorological, air quality, and traffic). We
also identify three types of features (temporal, statistical, and spatial). In total,
we have used 655 high-level extracted features.
The temporal features are mainly generated by the use of the timestamp of
the measurement. The timestamp includes information of the hour of the day,
the day of the week, the day of the month, the month, and the season of the
year. The Norwegian holiday calendar is matched against the date to see if it is
a day off. The last temporal feature is created out of the historical values of the8 Lepperød et al.
Fig. 4. The final set of extracted feature
parameter. The spatial features contain properties from neighboring stations.
These are calculated from the mean of the nearby stations. These features are
included to help the models capture spatial relations of the air quality.
The statistical features are produced by applying a set of mathematical func-
tions to the time series to derive unique properties, such as lagged value differ-
ence, moving average, moving standard deviation, moving minimum, and moving
maximum, as shown in Fig. 4. The goal of statistical features is to add a more
general and broader temporal dependency by including historical values. The sta-
tistical functions will consist of a smarter relation of the past, that the models
will easier learn. The statistical features will provide reliable and more straight-
forward ties between the past and the forecasts. Statistical feature engineering
can help smooth the raw values of the time series to decipher the complexity. The
functions minimum, maximum, and moving average are used to capture trends
in the series. The difference and deviation can help to detect sudden changes by
learning what happened just before the change.
Machine learning models. It was decided to implement seven forecasting
techniques, each with its unique trait, and identified as potentially advantageous
approaches for air quality prediction. Autoregressive Integrated Moving Average
(ARIMA) and Ridge Regression (Ridge) had been applied to time series prob-
lems with reliable results in the past. Multilayer Perceptron (MLP) and Random
Forest (RF) had been used in the recent literature with reliable results within air
quality prediction problems. A version of Recurrent Neural Network with Gated
Recurrent Unit cells (GRU) was included due to its predicting powers of timeAbbreviated paper title 9
series problems. Finally, because of the ability of gradient boosting to minimize
error in complex problem domains, and because it is less used in the literature,
two unique variations of gradient boosting were implemented, Gradient Boosting
Decision Tree (GBM) and Dropouts meet Multiple Additive Regression Trees
(DART).
Gradient Boosting implemented with Microsoft’s version of LightGBM [25].
It is an optimized version of gradient boosting and is faster with the same ac-
curacy than its competitors XGBoost and Scikit Learns version. In this paper,
we use the implementation of the traditional GBM, and DART. PyTorch is used
to implement the Recurrent Neural Network (RNN) model. The implementa-
tion can utilize either GRU or LSTM cells. Several model hyperparameters were
optimized using randomized search; the RNN cell (LSTM or GRU), number of
layers, number of RNN cells, learning rate, sequence length, dropout rate, and
batch size.
Evaluation metrics. In the literature of air quality, there is no single supe-
rior evaluation method. For our experiments, we have used the set of multiple
performance metrics, including Mean Absolute Error (MAE), Relative Absolute
Error (RAE), and Root Mean Squared Error (RMSE). However, because of the
limitation on the number of pages in this paper, we chose to present the RAE
results only. Other evaluation metrics provided consistent results.
In addition to regular air quality patterns, it frequently occurs sudden changes
in the pollution concentration, which are essential to predict for real-time moni-
toring as they can have more impact on the daily life of most people. While the
evaluation metrics defined in the previous section cover the total error and how
good the model fit the actual values, they are not suitable metrics for anomaly
prediction. Instead, we used the F1-Score as the evaluation metric for anomaly
prediction. The predicted anomalies are matched against the real observed time
series and are counted as hits if they were in the span of 1 hour into the past
and 1 hour into the future. The smoothing and interval calculation will then ac-
count for a range of 4 hours that needs to overlap. The interval of 4 hours is fine
since a typical sudden change lasts for about 4-6 hours, and there are few partial
overlaps of lengthy anomalies in the time series dataset. This straightforward
approach for anomaly prediction ignores the residuals of the predicted spikes,
but it related well to classifying the specific warning levels. These warning levels
(good, OK, or bad) are a simple indicator for the city populations to grasp the
air quality at their location.
4.2 Experimental results.
The models are trained on data from 1. January 2014, to 30. November 2018,
and tested on data until 30. April 2019. The results are split up into two evalu-
ations where the first concerned with the models regression error for general air
quality pattern, while the second for its classification accuracy toward anomaly
prediction of sudden changes and spikes. All results are shown in Figure 5. As10 Lepperød et al.
we can see, the DART model performed the best in terms of predicting the ordi-
nary situations of air quality whereas the GRU model provided the best results
in predicting spikes in air quality pollution.
Fig. 5. Models performance RAE (left chart) and anomaly prediction F1-score (right
chart) with different pollutants.
Fig. 6. Results of regression error RAE (left chart) and anomaly prediction F1-score
(right chart) grouped by pollutant type.
We compared the results of machine learning predictions with the Norwegian
national air quality service, a knowledge-driven model described in Section 2. The
evaluation of the results is presented in two parts in Fig. 6: The first includes
the RAE regression error of 24-hour predictions. The second evaluation shows
the results of the accuracy of classifying anomalies found. Our tested machine
learning models DART and GRU outperformed the MET expert-based forecast
model in both ordinary situations and in case of sudden changes in the air quality.Abbreviated paper title 11 5 Conclusion We have developed a complete solution for air quality monitoring and forecast- ing, which contains the holistic IoT pipeline with our own developed micro- sensors, IoT data platform, data analytics, machine learning for prediction, and mobile app for visualization. The goal of this study is to evaluate the perfor- mance of machine learning methods for air quality prediction in Trondheim. We started with an analysis of datasets of Trondheim, including air pollutants, his- torical weather observations, traffic volume count, and wood burners. Further, we created more features with statistical feature engineering and tested multi- ple state-of-the-art machine learning techniques. Seven machine learning models were implemented, optimized, trained, and tested to determine the strengths and weaknesses of air quality prediction. The results showed that DART has the best performance of predicting the overall air quality for all the pollutants studied (PM2.5 , PM10 , NO2 ). We found that GRU can classify sudden changes better than the other methods. Lastly, the machine learning results were com- pared with the national air quality service, a knowledge-driven model, to eval- uate real-world practice. The predictions of general pattern and anomalies of this study are shown to be superior for 24-hour, and more comparable for the 48-hour forecast. Acknowledgements This work is part of the AI4EU project (https://www.ai4eu.eu/) which has re- ceived funding from the European Unions Horizon 2020 research and innovation program, under the Grant Agreement No 825619. References 1. Horde IoT Backend Service, https://blog.exploratory.engineering/post/horde-iot- backend/. Last accessed 13 Aug 2019 2. Lufta app, https://play.google.com/store/apps/details?id=com.luftaapp.lufta. Last accessed 13 August 2019 3. Zhang, Y., Bocquet, M., Mallet, V., Seigneur, C., Baklanov, A., 2012a. Real-time air quality forecasting, part i: History, techniques, and current status. Atmospheric Environment 60, 632655. 4. X. Yi et al. Deep Distributed Fusion Network for Air Quality Prediction. In Pro- ceedings of the 24th ACM SIGKDD International Conference on Knowledge Dis- covery & Data Mining (KDD ’18). ACM, New York, NY, USA, 965-973. DOI: https://doi.org/10.1145/3219819.3219822 5. Chen, L. et al. Spatially fine-grained urban air quality estimation using ensemble semi-supervised learning and pruning. International Joint Conference on Pervasive and Ubiquitous Computing. ACM, pp. 1076-1087, 2016 6. Wang, J., Song, G., 2018. A deep spatial-temporal ensemble model for air quality prediction. Neuro computing 314, 198206.
12      Lepperød et al.

                         7. Qi, Z. et al. Deep air learning: Interpolation, prediction, and feature analysis of
                            fine-grained air quality. IEEE Transactions on Knowledge and Data Engineering 30
                            (12), 2285-2297, 2018
                         8. Lin, Y. et al. Exploiting spatiotemporal patterns for accurate air quality forecasting
                            using deep learning. In: Proceedings of the 26th ACM SIGSPATIAL International
                            Conference on Advances in Geographic Information Systems, pp. 359-368, 2018.
                         9. Kök, İbrahim et al. A deep learning model for air quality prediction in smart cities.
                            In IEEE International Conference on Big Data, pp. 1983-1990, 2017.
                         10. Bougoudis, I. et al. Hisycol a hybrid computational intelligence system for com-
                            bined machine learning: the case of air pollution modeling in athens. Neural Com-
                            puting and Applications 27 (5), 1191-1206, 2016.
                         11. Tamas, W. et al. Hybridization of air quality forecasting models using machine
                            learning and clustering: An original approach to detect pollutant peaks. Aerosol Air
                            Qual. Res 16, 405-416, 2016.
                         12. Athira, V. et al. Deepairnet: Applying recurrent networks for air quality prediction.
                            Procedia computer science 132, 1394-1403, 2018.
                         13. Li, X. et al. Long short-term memory neural network for air pollutant concentration
                            predictions: Method development and evaluation. Environmental pollution 231, 2017
                         14. Zhan, Y. et al. Satellite-based estimates of daily NO2 exposure in china using
                            hybrid random forest and spatiotemporal kriging model. Environmental science &
                            technology 52 (7), 4180-4189, 2018
                         15. Chen, G. et al. A machine learning method to estimate PM2.5 concentrations across
                            china with remote sensing, meteorological and land use information. Science of the
                            Total Environment 636, 52-60, 2018
                         16. Zheng, Y. et al. Forecasting fine-grained air quality based on big data. In: Proceed-
                            ings of the 21th ACM SIGKDD International Conference on Knowledge Discovery
                            and Data Mining. ACM, pp. 2267-2276.
                         17. Ghoneim, O. A., Manjunatha, B., et al., 2017. Forecasting of ozone concentration
                            in smart city using deep learning. In: 2017 International Conference on Advances in
                            Computing, Communications and Informatics (ICACCI). IEEE, pp. 13201326.
                         18. Bruce Rolstad Denby et al. The norwegian air quality service: Model forecasting,
                            2018. https://www.met.no/
                         19. Tørseth, K. et al. Introduction to the european monitoring and evaluation pro-
                            gramme (emep) and observed atmospheric composition change during 19722009.
                            Atmospheric Chemistry and Physics 12 (12), 54475481.
                         20. Fishbain, B. et al. An evaluation tool kit of air quality micro-sensing units..
                            Science of The Total Environment. Volume 575, 1 January 2017, Pages 639-648,
                            https://doi.org/10.1016/j.scitotenv.2016.09.061
                         21. M. Kiran, P. Murphy, I. Monga, J. Dugan and S. S. Baveja, 2015. Lambda architec-
                            ture for cost-effective batch and speed big data processing. 2015 IEEE International
                            Conference on Big Data (Big Data), Santa Clara, CA, pp. 2785-2792.
                         22. M. Singh, M. A. Rajan, V. L. Shivraj and P. Balamuralidhar, 2015. Secure MQTT
                            for Internet of Things (IoT). 2015 Fifth International Conference on Communication
                            Systems and Network Technologies, Gwalior, 2015, pp. 746-751.
                         23. D. Kauling and Q. H. Mahmoud, 2017. Sensorian Hub: An IFTTT-based platform
                            for collecting and processing sensor data. 2017 14th IEEE Annual Consumer Com-
                            munications & Networking Conference (CCNC), Las Vegas, NV, 2017, pp. 504-509.
                         24. Norwegian Institute for Air Research. https://www.nilu.no/en/
                         25. Ke, G. et al. Lightgbm: A highly efficient gradient boosting decision tree. In Ad-
                            vances in Neural Information Processing Systems 30. Curran Associates, Inc., pp.
                            31463154, 2017

View publication stats
You can also read